Transcription
McAdam et al. Journal of the International Society of Sports Nutrition(2018) ARCH ARTICLEOpen AccessEstimation of energy balance and trainingvolume during Army Initial Entry TrainingJeremy McAdam1, Kaitlin McGinnis1, Rian Ory1, Kaelin Young2,3, Andrew D. Frugé4, Michael Roberts2,3and JoEllen Sefton1*AbstractBackground: Adequate dietary intake is important for promoting adaptation and prevention of musculoskeletalinjury in response to large volumes of physical training such as Army Initial Entry Training (IET). The purpose of thisstudy was to evaluate training volume and dietary intake and estimate energy balance in Army IET soldiers.Methods: Dietary intake was assessed by collecting diet logs for three meals on each of three, non-consecutivedays during the first week of IET. Training volume was measured across 13 weeks of training using Actigraph wGT3Xaccelerometers. Training intensity was classified using Sasaki vector magnitude three cut points. Energy expenditureestimates were calculated during weeks two and three of training using the modified Harris-Benedict equation and byestimation of active energy expenditure using metabolic equivalents for each classification of physical activity. All datais presented as mean standard deviation.Results: A total of 111 male soldiers (ht. 173 5.8 cm, age 19 2 years, mass 71.6. 12.4 kg) completed dietlogs and were monitored with Actigraphs. IET soldiers performed on average 273 62 min low, 107 42 minmoderate, 26 22 min vigorous, and 10 21 min of very vigorous intensity physical activity daily across 13weeks. The estimated total daily energy expenditure was on average 3238 457 kcals/d during weeks twoand three of IET. Compared to week one caloric intake, there was a caloric deficit of 595 896 kcals/d onaverage during weeks two and three of IET. Regression analysis showed that body weight was a significantpredictor for negative energy balance (adj. R2 0.54, p 0.001), whereby a 1 kg increase in body mass wasassociated with a 53 kcal energy deficit.Conclusions: Based on week one dietary assessment, IET soldiers did not consume adequate calories andnutrients to meet training needs during red phase (weeks one through three). This may directly affect soldierperformance and injury frequency. IET soldiers undergo rigorous training, and these data may help directfuture guidelines for adequate nourishment to optimize soldier health and performance.Keywords: Soldiers, Diet, Energy, Training, VolumeBackgroundInitial Entry Training (IET) is a mentally and physicallydemanding military training program designed to transform civilians into soldiers. The transformation from civilian to soldier has become more challenging as theability of IET soldiers to respond and adapt to IET hasdeclined over recent decades. The American populationhas become less active due to changes in lifestyle factors* Correspondence: jmsefton@auburn.edu1Warrior Research Center, School of Kinesiology, Auburn University, 301 WireRoad, Auburn, AL 36849, USAFull list of author information is available at the end of the articlesuch as increases in screen time in the place of physicalactivity, reductions in physically active jobs, and reducedactive transportation (e.g., walking, riding bikes) [1].Consequently, fitness levels of civilians entering IET arelower as evidenced by increases in failure rates on theinitial fitness assessment of IET [2]. Lower physical fitness has been shown to be an important predictor ofmusculoskeletal injury (MSI) [2–6]. Soldier health andforce readiness are greatly impacted by MSI, with MSIalone during IET estimated to cost the United States approximately 384 million per year [2, 7]. The Author(s). 2018 Open Access This article is distributed under the terms of the Creative Commons Attribution 4.0International License (http://creativecommons.org/licenses/by/4.0/), which permits unrestricted use, distribution, andreproduction in any medium, provided you give appropriate credit to the original author(s) and the source, provide a link tothe Creative Commons license, and indicate if changes were made. The Creative Commons Public Domain Dedication o/1.0/) applies to the data made available in this article, unless otherwise stated.
McAdam et al. Journal of the International Society of Sports Nutrition(2018) 15:55Soldiers perform organized physical fitness trainingas well as occupational physical activity to improvephysical fitness and learn soldiering skills during IET[8–10]. Organized physical fitness training is designedto expose IET soldiers to progressively increasinglevels of physical training to improve endurance andstrength [9]. Occupational physical activity consists oftactical and survival drills that will enable IET soldiersto carry out required duties for the completion of successful missions. These physical and cognitive effortsmust be adequately fueled in order to optimize IETsoldier performance.Rapid increases in training volume and intensityhave been related to higher MSI rates [11]. Few investigations have quantified overall training volume including occupational physical activity. One study [12]quantified steps and distance covered by soldiers during IET and observed that those who walked moreduring basic combat training had a higher risk of musculoskeletal injury. To date, only one study [13] hasinvestigated intensity of training in IET. However, themonitors were removed at dinnertime likely underestimating training volume.Dietary intake must match training volume to fuelphysiological demands. Inadequate energy is detrimental to bone health [14, 15], immune health [16,17], cognitive performance [18, 19], as well as exerciseperformance in physically active populations [20, 21].Research conducted on the dietary needs of active individuals has primarily focused on power or endurance training populations. IET soldiers are required tocomplete strength, power, endurance and functionaltraining. This suggests IET soldiers have unique fueling needs due to the large variety in training intensityand duration. IET soldiers likely require the higherprotein needs of strength and power athletes as well asthe higher carbohydrate and fat intake needs of endurance athletes.Clearly understanding training volume and nutritionintakes of IET soldiers is critical in ensuring trainingsuccess. However, few studies to date have examinedthese areas in the IET environment, and none have examined both factors together in IET soldiers. Thus, theprimary aims of this study were to: 1) quantify totaltraining volume; 2) determine dietary intake; and 3) estimate energy balance in soldiers participating in IET.Secondary aims were to determine how dietary intake ofIET soldiers compares to current nutritional recommendations for active individuals [22] and to determine ifbody size is a predictor of energy balance. We hypothesized IET soldiers would be in a negative energy balanceand consume inadequate dietary intake. We also hypothesized that IET soldiers with heavier body mass wouldbe at a greater risk for negative energy balance.MethodsPage 2 of 9Ethical approvalThe Auburn University Institutional Review Board,Army Institutional Review Board, and the Director, Research & Analysis Directorate Army Center approvedthe study procedures. For inclusion, participants had tobe at least 18 years of age, healthy with no apparent disease or MSI, and participating in IET. Interested potential participants from one training unit received verbalexplanation of the study from the study team and provided written consent. One hundred eleven male IETsoldiers (mean SD: age: 19 2 yrs., height: 173 5.8cm, mass: 72.2 12.5 kg) from one training unit of IETsoldiers at Fort Benning, Georgia volunteered for thisinvestigation.Study designThis study was 14 weeks in total duration. Diet analysisand body mass information was collected during the firstweek of IET. Physical activity data was collected dailybeginning at week two and continued ended duringweek 14 of IET training.Body mass measurementAnthropometric measures were conducted in a fastedstate prior to morning physical training and breakfaston the morning of day three of IET. Urine specific gravity was evaluated the morning of testing using a handheld refractometer (Manual, Atago, Tokyo, Japan) toensure participants were properly hydrated (USG below1.03) [23]. Height and weight were recorded with IETsoldiers wearing only army issued physical trainingshorts, socks and underwear using a Health-O-Meterprofessional scale (Model 500KL, Sunbeam Products,Inc. Boca Raton, FL, USA).Diet logsDietary intake was recorded after each meal on threenon-consecutive days (Tuesday, Thursday, and Saturday)during the first full week of IET. Food menus from thecafeteria-style dining facility serving the IET soldiers wereused to create meal specific diet logs (Additional file 1) containing meal specific food items and serving sizes for eachfood item. Study staff provided guidance on identifyingfoods and quantifying portions prior to their first recordedmeal. Items on the salad and fruit bars were measured inunits relating to hand size whereas items explicitly listed onthe dining facility menu were measured in standardizedserving sizes (e.g., Lasagna-scoop). To assist participants adocument was provided that contained written and visualrepresentations of the relationships between food portionsizes relative to the hand. The IET soldiers were asked tocircle the food item and portion they consumed. A memberof the research team met the participants at the company
McAdam et al. Journal of the International Society of Sports Nutrition(2018) 15:55barracks immediately following each meal to administerand obtain the diet logs.monitors. A day was considered valid if wear time was atleast 600 min [36]. A total of 840 data points were eliminated from the analysis due to wear times less than 600min. All training data was averaged per day and week oftraining. The data is presented in average minutes per day.Diet log analysisMacronutrient and select micronutrient data for the dining facility foods were accessed from the Army Joint Culinary Center of Excellence (JCOE) website [24]. Fooditems not found on the JCOE menu were retrieved fromthe US Department of Agriculture (USDA) nutritiondata base [25]. Dietary intakes and nutrient informationwere entered into customized excel spreadsheets (Microsoft Excel, Microsoft Corporation, Redmond, WA, USA),and checked by two researchers to ensure data accuracy.Dietary intake calculations were completed using R statistical software [26] and R Studio [27]. R programmingpackages, dplyr [28], tidyr [29], reshape2 [30] ez [31], car[32], vars [33], ggplot2 [34]. Total calorie, protein, fat,carbohydrate, cholesterol, and sodium intakes were obtained for each meal and each day. Dietary intakes werethen averaged across each day of diet logs to calculatedaily averages. Participants who completed at least twofull days of diet logs were used in calculation of averagedaily intakes and energy balance. However, for the statistical comparison of dietary intake at each meal, only participants who completed all three meals were used in theanalysis. In total, 85 participants completed all 3 days ofdiet logs (included in the statistical analysis), and 26 participants completed only 2 days of diet logs.Physical activity assessmentParticipants were outfitted with Actigraph wGT3X monitors (Actigraph, Pensacola, FL, USA). Training volume andintensity were measured across weeks 2–14 and energy balance was estimated for weeks two and three of red phaseduring IET. Monitors were initialized using Actilife software version 13.1.1 (Actigraph, Pensacola, FL, USA). Eachweek of training a member of the research team met with12 soldiers (3 per platoon) to instruct them to wear themonitors around the waist, on the right side of the body, atall times (awake and asleep), and to only remove for showering. At the end of each week the monitors were collected,and age, height, weight, ethnicity, and hand dominancewere entered into the Actilife software for each subject.Sasaki Vector Magnitude 3 cut points were used were usedto divide activity into three categories: moderate (2690–6166 cpm), vigorous (6167–9642 cpm) and very vigorous( 9642 cpm) [35]. A cut-point was added to classify countsless than moderate physical activity into sedentary and lightintensity physical activity (Sedentary 200 cpm, Light 201–2689 cpm) which has been used in previous researchas a cut point to delineate sedentary time from vector magnitude three data [36]. The monitors collected data at therecommended 30 Hz sampling rate [37]. Wear time validation was also used to estimate adherence to wearing thePage 3 of 9Energy expenditure estimationEnergy expenditure was estimated during weeks two andthree of IET. Minutes per day were averaged for eachclassification of physical activity and then metabolicequivalents (MET) were assigned to each category ofphysical activity. The MET assignments are as follows:light 2 METs [38], Moderate 3–5.99 METs, Vigorous 6–8.99 METs, Very Vigorous 9 METs (Sasaki) [35].We conservatively applied the lowest MET values formoderate (3 METs), vigorous (6 METs), and very vigorous (9 METs) physical activity to estimate active energyexpenditure [35]. Once MET values were assigned, average daily active energy expenditure (AEE) was estimatedfor each participant during weeks two and three usingthe Cooper Institutes MET to calorie conversion [39]:AEE ¼ MET Value x Participant body weight ðkgÞ x Time ðhrs:ÞWe estimated resting energy expenditure (REE) usingthe Modified Harris-Benedict equation [40]:REE ¼ 88:362 þ ð13:397 x body weight ðkgÞÞþð4:799 x Height ðcmÞÞ ð5:677 x age ðyrs:ÞÞTotal energy expenditure was the sum of REE andAEE. Energy balance was estimated by subtracting eachparticipant’s caloric intake from the estimated total energy expenditure; negative or positive values indicate acaloric deficit or surplus, respectively.Data presentation and statistical analysisGiven that this study was largely observational, food intake,physical activity and energy balance data were presented asmean standard deviation values, and no statistical testingwas performed for these metrics. Dietary intake acrossmeals was evaluated using repeated measures ANOVA.Paired samples t-tests were used to evaluate the simplemain effect of time and independent samples t-tests toevaluate the simple main effect of group when significantgroup by time interactions were found. Normality of residuals was tested using the Shapiro-Wilks and KomolgorovSmirnov test. Sphericity was evaluated using Maulchy’s test.During tests for normality of residuals for dietary intakeone meal was determined to be a statistical outlier and wasremoved from the analysis because the participant’s calorieintake was approximately 3500 cal for one meal, which was2.5 times greater than his next closest meal (1427 cal). Linear regression was used to determine if body weight was a
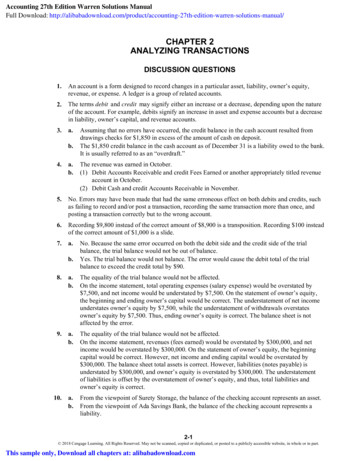
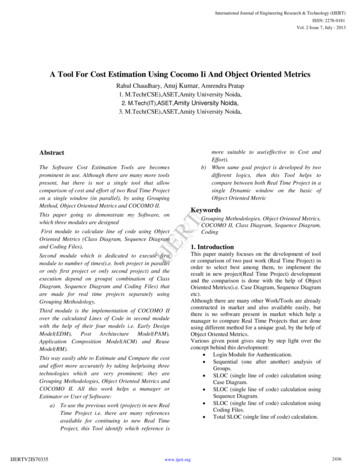
McAdam et al. Journal of the International Society of Sports Nutrition(2018) 15:55significant predictor of negative energy balance. Bodyweight was mean centered (participants body weight– mean (body weight)) was used as the predictor foraverage energy balance during weeks two and three ofIET. For probability testing, statistical significance wasset at p 0.05.813 225 cal, and lunch 769 201 cal (F 69.1, p 0.001). There was a significant difference between allmeals for calorie intake, breakfast and dinner (t 8.29,p 0.001), breakfast and lunch (t 10.72, p 0.001),dinner and lunch (t 2.31, p 0.02). Protein intake averaged 38.1 11.2 g for breakfast, 33.7 9.9 g forlunch, and 41.1 11.0 g for dinner. There was a significant effect of meal on dietary protein intake (F 24.18, p 0.001). Post-hoc paired t-tests revealed a significant difference between breakfast and dinner (t 2.84, p 0.005), breakfast and lunch (t 3.95, p 0.001), dinner and lunch (t 7.14, p 0.001). Carbohydrate intake averaged 137.3 39.7 g for breakfast,104.5 28.2 g for lunch, and 101.8 30.3 g for dinner.For carbohydrate intake, Greenhouse-Geisser corrections were used because sphericity was violated. Statistical analysis revealed a significant effect of meal.Post-hoc paired t-tests revealed a significant differencebetween breakfast and dinner (t 9.03, p 0.001),breakfast and lunch (t 8.89, p 0.001), but no significant difference between dinner and lunch (t 0.95, p 0.34). Fat intake averaged 34.6 11.2 g for breakfast,25.9 9.2 for lunch, and 27.8 11.2 g for dinner. Statistical analysis revealed a significant main effect ofmeal (F 30.7, p 0.001). Post-hoc paired t-tests revealed a significant difference between breakfast anddinner (t 5.67, p 0.001), breakfast and lunch (t 7.67, p 0.001), but no significant difference betweendinner and lunch (t 1.61, p 0.11) for fat intake.Approximately 49/111 participants consumed less thanthe recommended 1.5 g/kg of body weight per day ofprotein intake and 78/111 consumed less than the recommended 6 g/kg of carbohydrate per day. Approximately 103/111 met the lower limit of dietary fat intake(which is 25% of total calorie intake from fat).ResultsPhysical activity dataPhysical activity data are presented in Fig. 1. On averageIET soldiers spent approximately 273 62 min in light,107 42 min in moderate, 26 22 min in vigorous, and10 21 min in very vigorous intensity physical activityper day during weeks 2–14 of IET. Training volume during red phase was on average 284 54 min in light, 114 34 min in moderate, 28 21 min in vigorous and 12 17 min in very vigorous physical activity. Actilife software estimated the activity monitors were not worn(non-wear time) an average of 322 min per day. Thisnon-wear time was inversely correlated with time spentin light intensity (Moderate Correlation: 0.51) andmoderate intensity (Small Correlation: 0.33) exercise.Therefore, on weeks where wear time was lower, physical activity levels may be underestimated. IET soldiersaveraged 13,569 5197 steps per day during IET.Dietary intakeAverage macronutrient intake is presented in Fig. 2.IET soldiers consumed on average 2644 639 cal perday during week one. Intake ranged from 1211 to4228 cal per day. When comparing energy intakeacross meals, statistical comparison using repeatedmeasures ANOVA revealed a significant main effect ofmeal with caloric intake highest at breakfast with anaverage intake of 1013 273 cal, followed by dinnerPage 4 of 9Fig. 1 Summary of training volume across IET. Total physical activity (Sum of time spent in: light, moderate, vigorous, and very vigorous intensity)is represented by the columns and time spent in each classification of physical activity is represented by the lines. Data is presented in averageminutes per day during each week of training
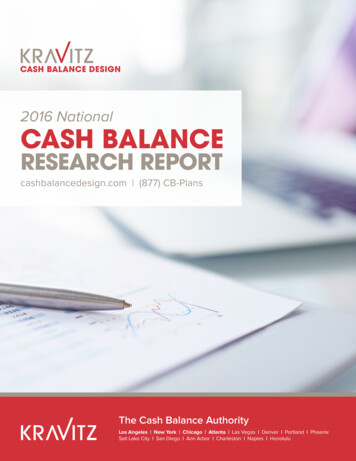
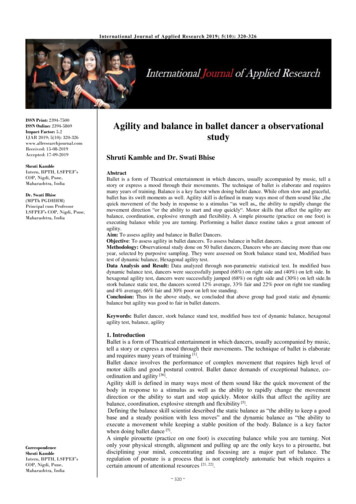
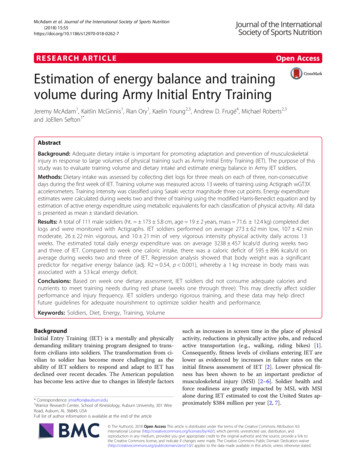
McAdam et al. Journal of the International Society of Sports Nutrition(2018) 15:55Page 5 of 9Fig. 2 Summary of dietary intake in IET soldiers. Caloric intake (Calories per day), individuals who did not meet the recommendation were thosewho were in a negative energy balance; Protein, recommendation 1.5 g/kg body weight; Carbohydrate, recommendation 6 g/kg of body weight;Fat 25% total kcal intake, represent macronutrient intakes of IET soldiers in comparison to the recommended intake for active individuals [22]Energy balanceEnergy expenditure was estimated using the mostconservative MET value associated with each classification of physical activity (Light 2 METs, Moderate 3 METs, Vigorous 6 METs, Very Vigorous 9METs). Figure 3 summarizes energy balance duringred phase of IET when the lowest MET values, average METs (Light 2.5 METs, Moderate 4.5 METs,Vigorous 7.5 METs, Very Vigorous 9 METs) andhigh MET (Light: 2.99 METs, Moderate 5.99, Vigorous 8.99, Very Vigorous 9) values associatedwith each classification of physical activity. Averagetotal energy expenditure was estimated to be 3238 457 during red phase (week two: 3107 415, weekthree: 3371 461). Resting energy expenditure wasestimated to be 1777 185 and active energy expenditure was 1461 286 (week two: 1329 231,week three: 1593 276) kcal kcal/day on averageduring red phase of IET. On average 71% of IET(week two: 66%, week three: 77%), soldiers wereclassified as being in negative net energy balanceduring red phase. Average energy balance was 595 896 kcal/day during red phase of IET based onweek one dietary intake. Regression analysis revealedbody weight was a significant predictor for negativeenergy balance (adj. R2 0.54, p 0.001). Specifically,for every 1-kg increase in body mass, energy balancebecame more negative by 53 cal.Fig. 3 Energy balance estimate during red phase of IET. Energy balance is presented using three different MET values related to each classification ofphysical activity. Low, (Light 2, Moderate 3, Vigorous 6). Mid, (Light 2.5, Moderate 4.5, Vigorous 7.5); High, (Light 2.99, Moderate 5.99,Vigorous 8.99) Very Vigorous was 9 METs across all estimates
McAdam et al. Journal of the International Society of Sports Nutrition(2018) 15:55DiscussionThis study evaluated the dietary intake, training load, andbalance between estimated energy expenditure and energyintake in U.S. Army IET soldiers. Our primary finding wasthat IET soldiers expended approximately 595 more calories per day during red phase than they consumed basedon our estimation of metabolic training load. It is likelythat our estimation of energy expenditure is low based onthree important considerations: 1) we applied conservativeMET assignments to moderate, vigorous, and very vigorous intensity physical activity; 2) estimation of BMR usingthe Modified Harris-Benedict equation was also a conservative estimate of non-physically active energy expenditure. It assumes the participant is immobile and in asupine position, whereas over half of sedentary time forIET soldiers is standing time which has been reported toincrease energy expenditure by as much as 10% [41]; 3)IET soldiers frequently carry loads (10–80 pounds) whichincreases energy expenditure and was not considered inour calculations [13]. Therefore, the imbalance betweenenergy expenditure and nutrition intake is likely higherthan reported here. In addition to preventing optimal performance and recovery, inadequate energy intake cannegatively affect bone turnover (formation and breakdown), and may predispose active individuals to musculoskeletal injury [14, 15, 42, 43] which is one of the mostcostly challenges facing the US armed forces today [2, 7].Quantification of training volume during IET revealedsoldiers averaged approximately 3180 320 min of physical activity per week with 1202 291 of those minutesbeing moderate to vigorous physical activity across 14weeks of IET. For comparison, research indicates only49–53% of civilian adults 18–34 reported at least 150min of moderate or 75 min of vigorous and only 31% reported participating in 300 min of moderate or 150 minof vigorous physical activity per week [44]. Furthermore,only 27% of adolescents participate in more than 1 h perday of moderate or vigorous physical activity [9]. Thus,IET soldiers complete substantially more physical activitythan the general civilian population of the same agerange. Also noteworthy was our observation that physical activity was higher during the first three weeks compared to the overall cycle average for IET training. Thus,IET soldiers may experience rapid increases in physicalactivity upon entry to IET compared to civilian life,which has been reported to increase the risk of MSI[11]. To combat this disparity, there are several voluntary pre-conditioning programs provided to new U. S.Army recruits. Discussions with training and recruitingcommand Cadre suggest most recruits do not take advantage of these programs or guidance provided on howto prepare for the rigors of military training. A differentapproach for pre-conditioning of recruits may be necessary to prepare them for the rigors of IET.Previous research reported that IET soldiers spent onaverage 140 min per day in light, approximately 92 min inmoderate, and 38 min per day in vigorous intensity exercise (averages calculated from cumulative results fromFort Sill and Fort Jackson) [13]. Differences found in thecurrent study are likely due methodological differences inactivity monitoring. The previous study distributed activitymonitors at breakfast and collected them at dinner, missing any evening physical activity [13]. Additionally, differences in algorithms used to classify activity counts intophysical activity may account for the differences. The priorstudy used Freedson cut points which are based on vertical axis counts [36, 45], whereas our study used Sasakivector magnitude cut-points which are based on a vectormagnitude estimate calculated from all three axes [35].While vertical axis counts have been validated for recording ambulatory physical activity (walking and jogging),they tend to underestimate activities that do not necessarily occur in the vertical axis (such as shoveling) [46, 47].Comparison of models using vector magnitude (tri-axis)and vertical axis only have reported higher physical activities when using vector magnitude whereas vertical axistends to report larger amounts of time in sedentary activity [46, 48].Soldiers consumed an average of 2644 cal, 114 g ofprotein, 352 g of carbohydrate, and 89 g of fat per day.Our results are limited as we only report week one dietary intake. A 2002 study of dietary intakes in IET soldiers found they consumed on average 3000 cal per day,whereas a 2012 study found IET soldiers consumed onaverage 1975 cal (78 g of protein, 240 g of carbohydrate,and 77 g of fat) [49, 50]. Differences in dietary intake results may also be due to methodologies employed in collecting nutritional data. The first study conducted in2002 used a highly accurate food photography methodwhereas the study conducted in 2012 used food frequency questionnaires and the current investigation utilized diet logs. Additionally, it should be noted that theprevious studies used serial measures (pre and post) fordietary assessment, whereas we only report week onedietary intake. Even though differences exist, our resultsfor calorie intake still fall within the reported calorie intakes of these two studies. Previous research has reported factors such as not having enough time to eatand command climate can influence nutritional behaviors [51]. Special care to protect feeding times needs tobe considered especially when the influx of IET soldiersincreases due to force expansion or yearly fluctuations,which may further reduce the time allotment for mealsdue to increased demand on dining facilities. Additionally, many doctrine changes to the IET environmenthave been made during this period. Early in 2012 and2013 the U.S. Army began using strategies for food education and selection to encourage IET soldiers to avoidPage 6 of 9
McAdam et al. Journal of the International Society of Sports Nutrition(2018) 15:55consuming energy dense food items. Soldiers were encouraged to select foods lower in fat content and increase consumption of vegetables, fruits and complex carbohydrates[52, 53]. While this nutritional education is important fordevelopment of long-term soldier health, care should betaken when explaining these strategies to IET soldiers whoare exposed to very high training volumes and need energydense food items to match caloric expenditure.Protein intake is crucial for provision of amino acidpools to support cellular adaptations of skeletal musclesuch as hypertrophy [54], mitochondrial protein turnover [55, 56], repair of muscle damage caused by training [57, 58], bone health [59–61] and improvedperformance [22]. On average IET soldiers consumedmore than the lower limit of 1.2 g/kg for protein. However, approximately 44% of IET soldiers consumed lessthan the recommended 1.5 g/kg of protein intake perday, which is thought to be a more accurate estimationof protein needs for strength and endurance training[22, 62, 63]. Additionally, protein needs for active individuals may increase to 2–3 g/kg of body weight per daywhen training during energy restriction [64]. This suggests that even though IET soldiers consumed above thelower limit for daily protein intake, they are likely consuming inadequate amounts of protein in due to thetraining demands and energy restriction soldiers faceduring IET.Diets high in carbohydrate intake are associated withincreased power output [65, 66], prolonged time to exhaustion [67], and overall increases in exercise performance [66]. We report that approximately 50% of IETsoldiers did not consume more than 5 g/kg and 70% didnot meet the lower limit (6 g/kg) of the recommendations for carbohydrate for individuals participating inhigh levels of physical activity [22]. Conversely, 93% ofIET soldiers met the lower recommendation of 25% oftotal calorie intake from fat. These findings suggest thatcarbohydrate intake may be inadequate to meet the demands of training and thus may limit performance inIET soldiers. This is important as we apply research findings clinically to develop fueling recommendations forthe IET population. Currently all IET soldiers receive thesame serving size and amount at the dining facility. Individual soldier body composition, fitness and activity levelshould be considered as we work towards optimizationof health and performance.This investigation is a first step at evaluating energy balance in the IET environment and represents only one training company at one location. One limitation to this study isour assumption that entry-level dietary intake values werereflective of eating habits throughout the 14-week dura
Diet logs Dietary intake was recorded after each meal on three non-consecutive days (Tuesday, Thursday, and Saturday) during the first full week of IET. Food menus from the cafeteria-style dining facility serving the IET soldiers were used to create meal specific diet logs (Additional file 1)con-taining meal specific food items and serving .