Transcription
sixth editionArizona Minority StudentProgress Report2016The TransformationContinuesCounty AddendumMilem Salazar Bryan
AmepacArizona Minority EducationPolicy Analysis CenterPREPARED BYDr. Jeffrey F. MilemKarina G. SalazarW. Patrick BryanThe University of ArizonaCenter for the Study of Higher EducationDr. David CamachoFred LockhartNorthern Arizona UniversityArizona Private School AssociationSusan Carlson, ChairEverardo Martinez-InzunzaCarlson & AffiliatesArizona Western CollegePanfilo ContrerasJacob MoorePrivate Education ConsultantArizona State UniversityDr. Mark S. DenkeDr. Ray OstosArizona Board of RegentsMaricopa Community College DistrictDr. Alfredo G. De Los Santos Jr.Dr. Rebecca TsosieFounding MemberArizona State UniversityDr. René X. DiazMagdalena VerdugoAZ Hispanic School Admin. AssociationDr. Dolores Duran-CerdaPima Community CollegeJoseph GarcíaChicanos Por La Causa, Inc.Dr. Angie WilliamsUniversity of PhoenixArizona State UniversityCOMMISSION STAFFTannya GaxiolaDr. April OsbornThe University of ArizonaMary HaluskaArizona Department of EducationExecutive DirectorJulie VoOffice and Program ManagerC - 2 ARIZONA MINORITY STUDENT PROGRESS REPORT 2013 County Addendum
Arizona Minority Student Progress Report 2016The Transformation ContinuesArizona Counties AddendumApache County.4Cochise County.5Coconino County.6Gila County.7Graham County.8Greenlee County.9La Paz County.10Maricopa County. 11Race / Ethnicity Category CodesAIAmerican IndianAPAsian / Pacific IslanderBBlackWWhiteHHispanicUKUnknown RaceMohave County. 12MMultiracialNavajo County. 13AZArizonaNRNon-Resident Alien(International Student)Pima County.14Pinal County. 15Santa Cruz County. 16Yavapai County. 17Yuma County. 18INTRODUCTION C - 3
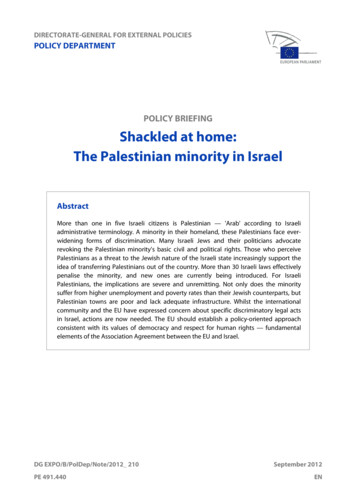
Apache CountyApache County, with a population of 71,978 constitutes just1 percent of the state population, and is one of only twocounties where the largest racial/ethnic group is AmericanIndian (71%). School age children and adults below 44 yearsof age comprise over one half of the population (64%), whilethose over 65 years of age comprise just 12 percent. Pre K-12enrollments by race/ethnicity for Apache are very similar tothe population distribution for the county, with AmericanIndian students compromising about 80 percent of allstudent enrollments since 2010.County has considerably less educational attainment thanthe state level where 27 percent of the population has abachelor’s degree or higher.Diné College is located in Tsaile and is one of only 37 tribalcolleges and universities in the United States and one oftwo in Arizona. Diné College is the nation’s first triballychartered college, and awards primarily associate degreesand a bachelor’s degree in elementary education. In 2013,Diné College enrolled 1,466 students, 99 percent of whichwere American Indian, and graduated 240 students withassociate’s degrees.About 32 percent of county residents over the age of 25have achieved a high school diploma or equivalent, while26 percent have less than a high school diploma. About onequarter of Apache County residents (24%) have completedsome college but did not complete a degree, 7 percent haveobtained an associate’s degree, 7 percent have earned abachelor’s degree and only 4 percent have completed agraduate or professional degree, indicating that ApacheWhile American Indians in Apache County comprise morethan 70 percent of the population, they have considerablyfewer financial resources, as their median household income( 25,332) is nearly half that of Whites ( 43,658) and the statemedian household income for all Arizona residents ( 49,774).2013 Apache County Population2013 Apache County Populationby Race/Ethnicityby Age12%6%7%8%2%20%2013 Apache CountyEducational %AIAPBHWsource U.S. Census Bureau (2013)M0-19Figure 120-4445-6465 source U.S. Census Bureau (2013)Figure 2 HS DiplomaHS DiplomaSome CollegeAssociate’sBachelor’sGrad Schoolsource U.S. Census Bureau (2013)Figure 3thousands of dollars2013 Apache County Median Household Income by Race/Ethnicity60arizonaapache40200WAIAPMHsource U.S. Census Bureau (2013)80%Figure 4Pre K-12 Enrollment in Apache County 2010-2014 by Race/Ethnicity60%40%20%0%2010source U.S. Census Bureau (2014)20112012AIBAP2013HC - 4 ARIZONA MINORITY STUDENT PROGRESS REPORT 2013 County AddendumWM2014UKFigure 5
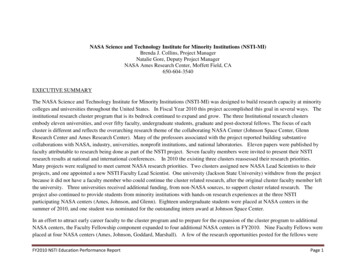
Cochise CountyCochise County, with a population of 131,038 makes up just2 percent of the state population. School age children andadolescents comprise about a quarter of the population (26%),while those over 65 years of age comprise just 18 percent. PreK-12 enrollments reflect the reversal of demographics withinthe 0-19 year-old demographic, as Hispanics now comprisemore than half of all students in the Pre K-12 system (53%),followed by Whites (38%), Blacks (4%), Multiracial (3%), andAsians (2%).More than one third (38%) of county residents over the ageof 25 have achieved a high school diploma or less, 29 percentcompleted some college but did not complete a degree, 10 percenthave obtained an associate’s degree, 14 percent have earned abachelor’s degree and 9 percent have completed a graduate orprofessional degree, indicating that Cochise County’s educationalattainment closely reflects that of the state.In 2013, the College enrolled 4,453 students who, whendisaggregated by race/ethnicity, were 44 percent White,42 percent Hispanic, 5 percent Black, 1 percent AmericanIndian, 2 percent Asian Pacific American, and 3 percentmultiple races. In the same year, Cochise College graduated3,552 students with associate’s degrees, of which 58 percentwere White and 24 percent were Hispanic.Median household income for Cochise County is below thestate median income for all race/ethnicity categories withthe exception of Blacks, whose median household incomewas 11,000 higher, likely the effect of the economic impactof the Fort Huachuca Military BaseCochise College has campuses in Douglas and Sierra Vista,and satellite locations in Nogales, Wilcox and Benson.2013 Cochise County Population2013 Cochise County Populationby Race/Ethnicityby Age2013 Cochise CountyEducational 1314%26%14%26%AIAPBHWsource U.S. Census Bureau (2013)M0-19Figure 620-4445-6465 source U.S. Census Bureau (2013)Figure 724% HS DiplomaHS DiplomaSome CollegeAssociate’sBachelor’sGrad SchoolFigure 8source U.S. Census Bureau (2013)thousands of dollars2013 Cochise County Median Household Income by Race/Ethnicity60arizonacochise40200WBHAIAPMsource U.S. Census Bureau (2013)60%Figure 9Pre K-12 Enrollment in Cochise County 2010-2014 by Race/Ethnicity40%20%0%2010source U.S. Census Bureau (2014)20112012AIBAP2013HWM2014UKFigure 10COUNTY DEMOGRAPHICS C - 5
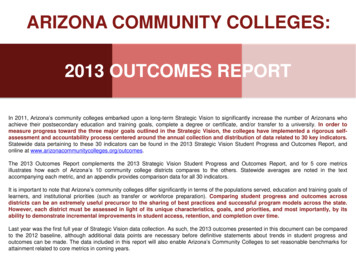
Coconino CountyCoconino County, with a population of 134,795constitutes just 2 percent of the state population.School age children and adolescents comprise underone third of the population (29%), while those over65 years of age comprise just 10 percent. White andAmerican Indian students are the largest racial/ethnicgroups among pre K-12 enrollments for Coconino, 41percent and 36 percent respectively.More than one third (35%) of the county has achieved ahigh school diploma or less, 25 percent have completedsome college but did not complete a degree, 9 percent haveobtained an associate’s degree, 18 percent have earneda bachelor’s degree, and 13 percent have completed agraduate or professional degree, indicating that CochiseCounty’s educational attainment, on average, is higherthan that of the state. This is likely due to the educationalattainment impact of NAU in Flagstaff.Coconino Community College is located primarily inFlagstaff with satellite campuses in Page, Tuba City,Williams and the Grand Canyon. In 2013, Coconinoenrolled 3,694 students who were primarily White(50%) and American Indian (20%), and graduated 516students with associate’s degrees. Northern ArizonaUniversity is also located in Coconino County, and acomplete review of NAU enrollments and completionscan be found in the Postsecondary Education section.Median household income for Coconino County isgenerally at or above the state median householdincome for all race/ethnicity categories with theexception of Asian and Multiracial residents, whosemedian household incomes were 25,000 and 20,000below the state level respectively.2013 Coconino County Population2013 Coconino County Populationby Race/Ethnicityby Agenknownack2013 Coconino CountyEducational 5%12%3%ian/PI134,79578,52313%26%22%merican Indian18%29%hiteAIAPBHWsource U.S. Census Bureau (2013)M0-19Figure 1120-4445-6465 source U.S. Census Bureau (2013)Figure 12 HS DiplomaHS DiplomaSome CollegeAssociate’sBachelor’sGrad SchoolFigure 13source U.S. Census Bureau (2013)thousands of dollars2013 Coconino County Median Household Income by Race/Ethnicityarizona60coconino40200WBHAIAPMFigure 14source U.S. Census Bureau (2013)Pre K-12 Enrollment in Coconino County 2010-2014 by Race/Ethnicity40%20%0%2010source U.S. Census Bureau (2014)2011AIB2012APHC - 6 ARIZONA MINORITY STUDENT PROGRESS REPORT 2013 County AddendumW2013M2014UKFigure 15
Gila CountyGila County, with a population of 53,335 constitutesjust 1 percent of the state population. School agechildren and adolescents comprise under one quarterof the population (23%), while more than half ofthe county (54%) is over the age of 45, bringing themedian age in the county to 48. Pre K-12 enrollmentsfor Gila reflect different demographics than the largercounty population. Whites make up more than halfof county residents (65%) but only representing 43percent of students enrolled in the Pre K-12 system.Similarly, American Indians make up 15 percent of thecounty population but represent nearly 30 percent ofP-12 enrollments.associate’s degree, 9 percent have earned a bachelor’sdegree and 7 percent have completed a graduate orprofessional degree, indicating that Gila County’seducational attainment, on average, is lower than thestate level.Median household income for Gila County is belowthe state median household income for all race/ethnicity categories except for Asians and Hispanics,whose median household incomes are 16,000 and 5,000 above the state average.Nearly half of county residents over the age of 25years (47%) have achieved a high school diploma orless, 28 percent have completed some college but didnot complete a degree, 9 percent have obtained an2013 Gila County Population2013 Gila County Populationby Race/Ethnicityby Age2013 Gila CountyEducational ,49416%23%24%AIAPBHWsource U.S. Census Bureau (2013)M0-19Figure 1620-4445-6428%65 source U.S. Census Bureau (2013)Figure 17 HS DiplomaHS DiplomaSome CollegeAssociate’sBachelor’sGrad SchoolFigure 18source U.S. Census Bureau (2013)thousands of dollars2013 Gila County Median Household Income by Race/Ethnicityarizona80gila6040200WBHAIAPMFigure 19source U.S. Census Bureau (2013)Pre K-12 Enrollment in Gila County 2010-2014 by Race/Ethnicity40%20%0%2010source U.S. Census Bureau (2014)2011AIB2012APHW2013M2014UKFigure 20COUNTY DEMOGRAPHICS C - 7
Graham CountyGraham County, with a population of 37,168 constitutesjust 1 percent of the state population. School agechildren and adolescents comprise almost one thirdof the population (31%), while those over 45 years ofage comprise another third of the county (34%). PreK-12 enrollments for Graham County reflect similardemographics as the larger population, with White,Hispanic and American Indian populations at similarproportions.Half of county residents over the age of 25 yeas (50%)have achieved a high school diploma or less, 31 percenthave completed some college but did not complete adegree, 7 percent have obtained an associate’s degree, 7percent have earned a bachelor’s degree, and 5 percenthave completed a graduate or professional degree,indicating that Graham County’s educational attainmentis, on average, much lower than the state level.Eastern Arizona College is located in Thatcher and, in2013, enrolled 6,602 students with 64 percent White,19 percent Hispanic, 7 percent American Indian, 3percent Black and 1 percent Asian Pacific American.In the same year, EAC graduated 1,126 students withassociate’s degrees.Median household income for Graham County isbelow the state median income for Whites, Blacks,and American Indians. The largest income disparityis among Blacks, whose median household income is 23,000 below the state average. Asian, Multiracial,and Hispanic residents enjoy a higher medianhousehold income than the state average, with largestdifferent among Multiracial and Hispanics, whosemedian household incomes are both about 10,000above the state average.2013 Graham County Population2013 Graham County Populationby Race/Ethnicityby 7,168merican Indian2013 Graham CountyEducational PBHWsource U.S. Census Bureau (2013)M0-19Figure 2120-4445-6465 source U.S. Census Bureau (2013)Figure 22 HS DiplomaHS DiplomaSome CollegeAssociate’sBachelor’sGrad SchoolFigure 23source U.S. Census Bureau (2013)thousands of dollars2013 Graham County Median Household Income by Race/Ethnicityarizona80graham6040200WBHAIAPMFigure 24source U.S. Census Bureau (2013)60%Pre K-12 Enrollment in Graham County 2010-2014 by Race/Ethnicity40%20%0%2010source U.S. Census Bureau (2014)2011AIB2012APHC - 8 ARIZONA MINORITY STUDENT PROGRESS REPORT 2013 County AddendumW2013M2014UKFigure 25
Greenlee CountyGreenlee County, with a population of 8,679 constitutesjust 0.1 percent of the state population. School agechildren and adolescents comprise almost one thirdof the population (31%), while those over 45 years ofage comprise another third of the county (36%). PK12 enrollments for Graham County reflect similardemographics as the larger population, with Whiteand Hispanic populations at similar proportions.the state level (39 percent with a high school diplomaor less).Median household income for Greenlee Countywas below the state median income for Whites andAmerican Indians, while for Hispanics it was 11,000higher than the state average.More than half of county residents over the age of 25years (54%) have achieved a high school diploma orless, 28 percent have completed some college but didnot complete a degree, 7 percent have obtained anassociate’s degree, 8 percent have earned a bachelor’sdegree, and 3 percent have completed a graduate orprofessional degree, indicating that Graham County’seducational attainment is, on average, much lower than2013 Greenlee County Population2013 Greenlee County Populationby Race/Ethnicityby Age2013 Greenlee CountyEducational %28%31%AIAPBHWsource U.S. Census Bureau (2013)M0-19Figure 2620-4438%45-6465 source U.S. Census Bureau (2013)Figure 27 HS DiplomaHS DiplomaSome CollegeAssociate’sBachelor’sGrad Schoolsource U.S. Census Bureau (2013)Figure 28thousands of dollars2013 Greenlee County Median Household Income by Race/Ethnicityarizona60greenlee40200WHAIFigure 29source U.S. Census Bureau (2013)60%Pre K-12 Enrollment in Greenlee County 2010-2014 by Race/Ethnicity40%20%0%2010source U.S. Census Bureau (2014)2011AIB2012APHW2013M2014UKFigure 30COUNTY DEMOGRAPHICS C - 9
La Paz CountyLa Paz County, with a population of 20,408 constitutesjust 0.3 percent of the state population. School agechildren and adolescents comprise less than one fifth(19%), while those over 65 years of age compriseone third of the county (33%). Pre K-12 enrollmentsfor La Paz County reflect a changing demographicin the younger portion of the population. WhileWhites make up 61 percent of the total countypopulation, they only represent 23 percent of pre K-12enrollments. Hispanic students represent the largestracial/ethnic student group with 49 percent, followedby Whites (23%) and American Indians (22%).degree and 3percent have completed a graduate orprofessional degree, indicating that La Paz County’seducational attainment is, on average, much lowerthan the state level (39 percent with a high schooldiploma or less).Median household income for La Paz County isbelow the state median income for all race/ethnicitycategories with the largest gap for Whites at 17,000below the state level ( 55,000).More than half of county residents over the age of25 (58%) have achieved a high school diploma orless, 26 percent have completed some college but didnot complete a degree, 7 percent have obtained anassociate’s degree, 6 percent have earned a bachelor’s2013 La Paz County Population2013 La Paz County Populationby Race/Ethnicityby Ageownacial12%6%19%7%1%/PI3%34%20,40824%2013 La Paz CountyEducational Attainment20,40862%can Indiannic15,96725%21%27%AIAPBHWsource U.S. Census Bureau (2013)M0-19Figure 3120-4434%26%45-6465 source U.S. Census Bureau (2013)Figure 32 HS DiplomaHS DiplomaSome CollegeAssociate’sBachelor’sGrad Schoolsource U.S. Census Bureau (2013)Figure 33thousands of dollars2013 La Paz County Median Household Income by Race/Ethnicityarizona60la paz40200WHAIFigure 34source U.S. Census Bureau (2013)Pre K-12 Enrollment in La Paz County 2010-2014 by Race/Ethnicity40%20%0%2010source U.S. Census Bureau (2014)2011AIB2012APHWC - 10 ARIZONA MINORITY STUDENT PROGRESS REPORT 2013 County Addendum2013M2014UKFigure 35
Maricopa CountyMaricopa County, with a population of 3,889,131 is the mostpopulous Arizona county and constitutes 60 percent ofthe state population. School age children and adolescentscomprise just under one third of the population (29%),while those over 65 years of age comprise just 12 percent.Pre K-12 enrollments for Maricopa reflect changingdemographics within the 0-19 year-old demographic, asthe largest proportion of students in schools has shiftedfrom White to Hispanic students. This is consistent withstate-level trends.More than one third of county residents over the age of25 years (37%) have achieved a high school diploma orless, 25 percent have completed some college but did notcomplete a degree, 8 percent have obtained an associate’sdegree, 19 percent have earned a bachelor’s degree and11 percent have completed a graduate or professionaldegree, indicating that Maricopa County’s educationalattainment, on average, is equal to that of the state. This,however, is expected as the majority of the state lives inMaricopa County.The Maricopa Community College District has 10 collegesand 2 skill centers throughout the county, and is one ofthe largest community college districts in the nation.In 2013, MCCD enrolled 132,877 students who wereprimarily White (48%), Hispanic (26%) and Black (7%),and graduated 19,408 students with associate’s degrees.Arizona State University, the largest public university inArizona and the nation, is also located in Maricopa County(a complete review of ASU enrollments and completionscan be found in the Postsecondary Education section).Median household income for Maricopa County isgenerally above the state median household income forall race/ethnicity categories with the exception of Blacks,whose median household incomes were 600 below thestate level.2013 Maricopa County Population2013 Maricopa County Populationby Race/Ethnicityby Age8%13%5%2%24%58%3,889,161APBHWsource U.S. Census Bureau (2013)M0-19Figure %2013 Maricopa CountyEducational Attainment45-6465 source U.S. Census Bureau (2013)Figure 37 HS DiplomaHS DiplomaSome CollegeAssociate’sBachelor’sGrad SchoolFigure 38source U.S. Census Bureau (2013)thousands of dollars2013 Maricopa County Median Household Income by Race/Ethnicityarizona60maricopa40200WBAIAPMHFigure 39source U.S. Census Bureau (2013)Pre K-12 Enrollment in Maricopa County 2010-2014 by Race/Ethnicity40%20%0%2010source U.S. Census Bureau (2014)2011AIB2012APHW2013M2014UKFigure 40COUNTY DEMOGRAPHICS C - 11
Mohave CountyMohave County, with a population of 201,680, constitutes3 percent of the state population. School age children andadolescents comprise less than one quarter of the population(22%), while those over 65 years of age comprise almostanother quarter (24%). Pre K-12 enrollments for Mohavereflect similar demographics to the county population,although by 2014 only 67 percent of students were white,with Hispanics growing to 25 percent of the student body.This disparity between the race/ethnicity proportionswithin the county compared to Pre K-12 enrollments islikely due to the large proportion of the population in the65 and older age range who are predominantly white.More than half of county residents over the age of 25 years(51%) have achieved a high school diploma or less, 30percent have completed some college but did not completea degree, 7 percent have obtained an associate’s degree,8 percent have earned a bachelor’s degree and 4 percenthave completed a graduate or professional degree. Thisindicates that Mohave County’s educational attainment,on average, is much lower than the state levels.Mohave Community College District has 4 campuses inKingman, Lake Havasu City, Bullhead City and ColoradoCity. In 2013, MCC enrolled 5,227 students who werepredominantly White (73%) and Hispanic (18%), andgraduated 888 students with associate’s degrees. ArizonaState University also has a presence in Mohave Countyafter opening its first Colleges of ASU campus in LakeHavasu City in 2012.Median household income for Mohave County is generallybelow the state median household income for all race/ethnicity categories with the exception of AmericanIndians, whose median household incomes were 7,000above the state level.2013 Mohave County Population2013 Mohave County Populationby Race/Ethnicityby Ageknown2013 Mohave CountyEducational Attainmentck15%an/PIerican 43,12016%24%24%panic30%iteAIAPBHWsource U.S. Census Bureau (2013)M0-19Figure 4120-4445-6465 source U.S. Census Bureau (2013)Figure 42 HS DiplomaHS DiplomaSome CollegeAssociate’sBachelor’sGrad SchoolFigure 43source U.S. Census Bureau (2013)thousands of dollars2013 Mohave County Median Household Income by Race/Ethnicityarizona60mohave40200WBAIAPMHFigure 44source U.S. Census Bureau (2013)80%Pre K-12 Enrollment in Mohave County 2010-2014 by Race/Ethnicity60%40%20%0%2010source U.S. Census Bureau (2014)2011AIB2012APHC - 12 ARIZONA MINORITY STUDENT PROGRESS REPORT 2013 County AddendumW2013M2014UKFigure 45
Navajo CountyNavajo County, with a population of 107,326 constitutes just2 percent of the state population. School age children andadolescents comprise about one third of the population(32%), while only 14 percent of the county is over the age of65. Pre K-12 enrollments for Navajo County reflect similarrace/ethnicity proportions as the larger county population,with about 40 percent representation for both AmericanIndian and White groups, although White studentrepresentation has steadily decline since 2010.About half of the county has achieved a high school degreeor less (48%), 29 percent have completed some collegebut did not complete a degree, 8 percent have obtainedan associate’s degree, 9 percent have earned a bachelor’sdegree and 6 percent have completed a graduate orprofessional degree. This indicates that Navajo County’seducational attainment, on average, is much lower thanthe state level.Northland Pioneer Community College has four campusesthroughout Navajo County in Show Low, Holbrook,Winslow and Snowflake. In 2010, NPC enrolled 3,223students and graduated 308 students with associate’sdegrees.Median household income for Navajo County is belowthe state average for all racial/ethnic groups exceptMultiracial residents, with Blacks accounting for thelargest disparity ( 23,000 less than the state average).Multiracial residents’ income is on average 8,000 abovetheir state level.2013 Navajo County Population2013 Navajo County Populationby Race/Ethnicityby Age2013 Navajo CountyEducational 65,80219%42%28%29%AIAPBHWsource U.S. Census Bureau (2013)M0-19Figure 4620-4445-6465 source U.S. Census Bureau (2013)Figure 47 HS DiplomaHS DiplomaSome CollegeAssociate’sBachelor’sGrad SchoolFigure 48source U.S. Census Bureau (2013)thousands of dollars2013 Navajo County Median Household Income by Race/Ethnicityarizona60navajo40200WBAIAPMHFigure 49source U.S. Census Bureau (2013)Pre K-12 Enrollment in Navajo County 2010-2014 by Race/Ethnicity40%20%0%2010source U.S. Census Bureau (2014)2011AIB2012APHW2013M2014UKFigure 50COUNTY DEMOGRAPHICS C - 13
Pima CountyPima County, with a population of 986,891, is thesecond largest county in Arizona, and accounts for 15percent of the state population. School age childrenand adolescents comprise more than one quarter ofthe population (26%), while 16 percent of the countyis over the age of 65. Although Whites are the largestproportion of the county population (55%), they arethe second largest group in Pima County schools(34%) behind Hispanics (53%); a gap that has steadilywidened since 2010.About one third of county residents over the age of 25years (36%) have achieved a high school diploma or less,26 percent have completed some college but did notcomplete a degree, 8 percent have obtained an associate’sdegree, 18 percent have earned a bachelor’s degree and12 percent have completed a graduate or professionaldegree. This indicates that Pima County is the mosthighly educated county in the state, with almost one thirdof the population holding a bachelor’s degree or higher(30%), compared to the state rate of 27 percent.Pima Community College has 6 campuses and 5centers in the Tucson Metropolitan Area. In 2013, PCCenrolled 30,082 students who were predominantlyWhite (44%) and Hispanic (40%), and graduated 5,260students with associate’s degrees. The University ofArizona, the state’s flagship, land-grant institutionis also located in Pima County (a complete review ofUA enrollments and completions can be found in thePostsecondary Education section).Median household income for Pima County, on average,is slightly below the state level across all racial/ethnicgroups. Asians ( 13,000) experienced the largest gap inmedian income when compared to their state average.2013 Pima County Population2013 Pima County Populationby Race/Ethnicityby Ageknownultiracial2013 Pima CountyEducational Attainment8%16%merican 4013%ck23%panic18%26%hiteAIAPBHWsource U.S. Census Bureau (2013)M0-19Figure 5120-4445-6465 source U.S. Census Bureau (2013)Figure 52 HS DiplomaHS DiplomaSome CollegeAssociate’sBachelor’sGrad SchoolFigure 53source U.S. Census Bureau (2013)thousands of dollars2013 Pima County Median Household Income by Race/Ethnicityarizona60pima40200WBAIAPMHFigure 54source U.S. Census Bureau (2013)Pre K-12 Enrollment in Pima County 2010-2014 by Race/Ethnicity60%40%20%0%2010source U.S. Census Bureau (2014)2011AIB2012APHC - 14 ARIZONA MINORITY STUDENT PROGRESS REPORT 2013 County AddendumW2013M2014UKFigure 55
Pinal CountyPinal County, with a population of 379,128 accounts for 6percent of the state population. School age children andadolescents comprise over one quarter of the population(29%), while 15 percent of the county is over the age of65. Although Whites are the largest proportion of thecounty population (58%), they are only 44 percent ofPinal County’s Pre K-12 enrollments, while Hispanicsmake up 40 percent.Nearly half of the county (45%) has achieved a highschool diploma or less, 28 percent have completed somecollege but did not complete a degree, 9 percent haveobtained an associate’s degree, 12 percent have earneda bachelor’s degree and 6 percent have completed agraduate or professional degree. This indicates thatPinal County’s educational attainment is below thestate level.Central Arizona College has 3 campuses and 7 centersnear Casa Grande, Apache Junction and Winkleman.In 2013, CAC enrolled 6,445 students who werepredominantly White (47%) and Hispanic (28%), andgraduated 1,148 students with associate’s degrees.Median household income for Pinal County, on average,is slightly higher than the state level for all racial/ethnicgroups except Asians and Whites. Multiracial ( 11,000),Black ( 8,000), Hispanic ( 5,000), American Indian( 500) had higher median incomes when compared tothe same groups across the state. Asians and Whites hadlower median incomes than their state average, 10,000and 2000 respectively.2013 Pinal County Population2013 Pinal County Populationby Race/Ethnicityby Age2013 Pinal CountyEducational 8250,12015%28%28%AIAPBHWsource U.S. Census Bureau (2013)M0-19Figure 5620-4445-6465 source U.S. Census Bureau (2013)Figure 57 HS DiplomaHS DiplomaSome CollegeAssociate’sBachelor’sGrad SchoolFigure 58source U.S. Census Bureau (2013)thousands of dollars2013 Pinal County Median Household Income by Race/Ethnicityarizona60pinal40200WBAIAPMHFigure 59source U.S. Census Bureau (2013)Pre K-12 Enrollment in Pinal County 2010-2014 by Race/Ethnicity40%20%0%2010source U.S. Census Bureau (2014)2011AIB2012APHW2013M2014UKFigure 60COUNTY DEMOGRAPHICS C - 1
bachelor's degree or higher. Diné College is located in Tsaile and is one of only 37 tribal colleges and universities in the United States and one of two in Arizona. Diné College is the nation's first tribally chartered college, and awards primarily associate degrees and a bachelor's degree in elementary education. In 2013,