Transcription
Biology S6Student BookExperimental versionKigali August 2018
Copyright 2018 Rwanda Education BoardAll rights reserved.This document is the property of Rwanda Education Board.Credit should be given to REB when the source of this book is quotedii
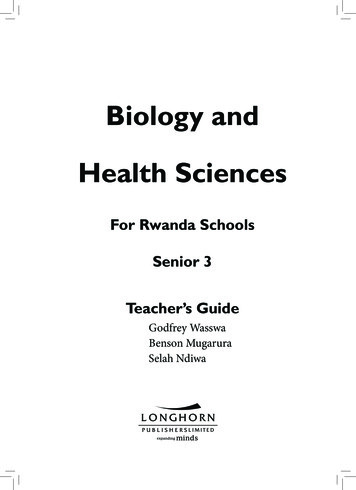
TABLE OF CONTENTTABLE OF CONTENT . iiiUNIT 1 POPULATION AND NATURAL RESOURCES . 11.1 Population characteristics . 21.2 Population density: Dependent and independent factors affecting population density . 51.3Methods or techniques of measuring population density . 71.4 Population growth patterns and environmental resistance. 101.5 Natural resources and their importance . 131.6 Methods of conserving natural resources . 15End of unit assessment 1 . 18UNIT 2 CONCEPT OF ECOSYSTEM . 212.1 Ecosystem definition and types of ecosystem . 232.2 Properties of an ecosystem and ecological factors influencing the life of organisms . 272.3. Energy flow in an ecosystem . 302.4 Ecological succession . 352.5 Bioaccumulation and Bio magnification . 382.6 Efficiency of ecological production . 412.7 Biogeochemical Cycles . 45End of unit assessment 2 . 50UNIT 3 EFFECT OF HUMAN ACTIVITIES ON ECOSYSTEM . 533.1 Modern agricultural technologies for food production . 543.2 Impacts of human activities on ecosystem. 563.3 Pollution . 613.4 Biological conservation and restoration. 65End of unit assessment 3 . 68UNIT 4 THE CIRCULATORY SYSTEM . 684.1 Blood circulatory system in animals . 704.2 Structure of the human heart . 764.3 Heart beat and mammalian cardiac cycle . 774.4 Control of the heart rate. . 824.5 Blood vessels . 84iii
4.6 Body fluids, composition and functions . 864.7 Transport of respiratory gases . 924.8 Blood clotting and common cardiovascular diseases . 954.9 Lymphatic system . 98End of unit assessment 4 . 102UNIT 5 ENERGY FROM RESPIRATION . 1055.1 Need for energy by organisms . 1065.2 Structure of Adenosine Triphosphate and its importance . 1075.3 Synthesis and breakdown of ATP . 1095.4 Respiratory substrates and their relative energy values . 1115.5 Measurement of respiration and respiratory quotient . 113End of unit assessment 5 . 118UNIT 6 CELLULAR RESPIRATION . 1216.1 Overview of respiration process . 1216.2 Link reaction and the Krebs cycle . 1246.3 Oxidative phosphorylation and electron transport chain . 1266.4 Efficiency of aerobic and anaerobic respiration . 1286.5 Factors affecting the rate of respiration . 1316.6 Use of other substrates in respiration . 133End of unit assessment 6 . 135UNIT 7 EXCRETION AND OSMOREGULATION . 1377.1 Structure and functions of excretory organs in mammals . 1387.2 Structure and the functions of the nephron. . 1427.3 Formation of urine and purification of blood . 1467.4 Role of hypothalamus, pituitary gland, adrenal gland and nephron in varying the bloodosmotic pressure. 1487.5 Kidney transplants and dialysis machines . 1507.6 Principles of osmoregulation in marine, freshwater and terrestrial organisms. . 1527.7 Excretion and osmoregulation in protoctista, insects, fish, amphibians and birds. . 1537.8 Excretion in plants . 156End of unit assessment 7 . 158iv
UNIT 8 GENERAL PRINCIPLES OF RECEPTION AND RESPONSE IN ANIMALS. . 1608.1 Types of sensory receptors and stimuli . 1618.2 Components of the sensory system: transduction, transmission and processing . 1638.3 Structure and functioning of the eye . 1658.4 Structure and functioning of the ear. 1758.5 Structure and functioning of the tongue. 1808.6 Structure and functioning of the skin . 182End of unit assessment 8 . 185UNIT 9 NERVOUS COORDINATION . 1879.1 Overview of control and co-ordination in mammals . 1879.2 Structure, types and functions of neurons . 1929.3 Nature and generation of a nerve impulse . 1969.4 Transmission of nerve impulses. 2019.5 Structure and function of a cholinergic synapse. . 2079.6 Functions of sensory, relay and motor neurons in a reflex arc . 211End of unit assessment 9 . 214UNIT 10 HORMONAL COORDINATION IN ANIMALS . 21910.1 Structure and function of the endocrine system in humans . 21910.2 Principles of the negative feedback mechanism of hormonal action. . 22710.3 Effects of hormonal imbalances. 22910.4 Comparison of hormonal and nervous systems . 232End of unit assessment 10 . 234UNIT 11 SKELETONS, MUSCLES AND MOVEMENT . 23611.1 Types of animal skeletons: hydrostatic, exoskeleton and endoskeleton. . 23711.2 Types of joints. 24911.3 Types of muscles: cardiac, smooth and skeletal muscle . 25311.4 Ultrastructure and functioning of striated muscle . 26411.5 Sliding filament theory of muscle contraction . 266End of unit assessment 11 . 268UNIT 12 HUMAN REPRODUCTION . 26912.1 Menstrual cycle . 270v
12.2 Oestrous cycle . 27312.3 Copulation, fertilization and embryo development. . 27312.4 Role of Placenta in the development of embryo . 27812.5 Physiological changes during pregnancy and parental care . 28012.6 Twins and multiple births . 28312.7 Infertility or barrenness . 28512.8 Family planning: birth control and contraception . 28712.9 Causes and prevention of STIs and HIV. 289End of unit assessment 12 . 293UNIT 13 PRINCIPLES OF GENE TECHNOLOGY . 29513.1 Recombinant DNA and enzymes involved in genetic engineering . 29613.2 Properties of plasmids and gene manipulation . 30113.3 Transfer of genes using plasmids in transgenic organisms . 30313.4 Non-biological methods of gene transfer . 31013.5 Principles of Polymerase Chain Reaction (PCR) in cloning and amplifying DNA . 32013.6 Gel electrophoresis. 32313.7 Use of microarrays in the analysis of genomes and in detecting mRNA . 327End of unit assessment 13 . 331UNIT 14 APPLICATION OF GENE TECHNOLOGY . 33314.1 Bioinformatics. 33514.2 Production of human proteins by recombinant DNA technology . 33614.3 Genetic technology applied to medicine and forensic science . 33814.4 Significance of genetic engineering in improving the quality and yield of crop plants andlivestock . 34314.5 Ethical and social implications of using genetically modified organisms (GMOs). . 346End of unit assessment 14 . 349UNIT 15: VARIATION . 35215.1 Variation . 35315.2 Types of variation . 35515.3 Causes of variation in living things . 36315.4 t-test. 366vi
End unit assessment 15. 370UNIT 16 NATURAL AND ARTIFICIAL SELECTION . 37216.1 Natural selection . 37316.2 Artificial selection . 37816.3 Allele frequency and its causes . 38116.4 Study of population genetic variation by Hardy-Weinberg principle . 385End of unit assessment 16 . 388UNIT 17 EVOLUTION AND SPECIATION . 38917.1 Theories of evolution . 39117.2Evidence of evolution . 39617.3 Causes of evolution . 40017.4 Speciation . 40317.5 Roles natural selection in speciation . 40517.6 Mechanism of speciation . 406End unit assessment 17. 411REFERENCES . 413vii
UNIT 1 POPULATION AND NATURAL RESOURCESKey Unit CompetenceTo be able to describe the factors affecting population size and the importance of natural resourcesLearning ObjectivesBy the end of this unit, I should be able to:-State and define population characteristics.Explain factors that affect population density.Explain population growth patterns.Explain the terms renewable and non-renewable resources.Explain how environmental resistance affects the balance of nature.Explain the importance of natural resources in growth of the Rwandan economy and methodsof conservation.Demonstrate methods used in estimating populations by using quadrats and line transects.Research how the human population has grown over the past 250 years.Compare statistics on the population age-sex structure of developing and developedcountries.Analyse the costs and benefits of managing renewable and non-renewable resources.Support that human population explosion impacts negatively on the environment.Recognize that some resources are renewable and others are non-renewable and that effectiveuse of these resources is of great value.Justify the practice of family planning as a tool for reducing population explosion.Introductory activity1) The following pictures were taken from different areas and consist of a group ofanimals. Analyse them and answer the questions that follow.a) List down similarities and differences for pictures A and B?b) What can you conclude about the picture A and the picture B using appropriateecological terms?c) Specify the appropriate ecological term to describe picture A and picture B2) Explain briefly the characteristics of a population.3) Categorize the natural resources1
Pictures A and B represent ecological populations. In biology, an ecological population is a groupof organisms of the same species that live in the same area at a certain period of time. Thepopulation is the unit of natural selection and evolution. How large population is and how fast it isgrowing are often used as measures of its health.1.1 Population characteristicsActivity 1.1Discuss the following terms in relation to population:1) Density2) Age structure3) Growth pattern4) Birth rate5) Death rateA given population is characterized by its density, its age structure, its growth patterns, its birthand death rate.1.1.1Population densityPopulation density is the number of individuals of the same species per unit area or volume. Forexample, the number of Acacia tree species per square kilometer in the Akagera National park inRwanda or the number of Escherichia coli per millilitre in a test tube express the density of theseindividuals per square kilometre in a natural forest and per millilitre in a test tube.1.1.2Population age structureAge structure is the number or proportion of individuals in each age group within a population.The figure 1.1 below provides the distribution of the population according to age.Figure 1.1: Age structure in Rwanda2
Information is included by sex and age group as follows: 0-14 years (children), 15-24 years (earlyworking age), 25-54 years (prime working age), 55-64 years (mature working age), 65 years andover (elder age). The age structure of a population affects a nation's key socioeconomic issues. Forexample, countries with young populations (high percentage under age 15) need to invest more inschools while countries with older populations (high percentage ages 65 and over) need to investmore in the health sector.Figure 1.2: Age- sex structure pyramids of developing and developed countriesThe shapes of the age- sex structure pyramids shown above show the age sex-structure of adeveloping and developed country. The main characteristics of developing countries includingsome of the African countries in terms of population growth include high death rate; high birth rateand low life expectancy, while the main characteristics of developed countries such as mostEuropean countries in terms of population growth are low death rate, low birth rate and longer lifeexpectancy1.1.3Population explosionPopulation explosion is the rapid increase in number of individuals of a particular species. Forexample, the world's human population increase since the end of World War II is attributed to; anaccelerating birth-rate, a decrease in infant mortality and an increase in life expectancy. Suchhuman population increase impacts negatively the environment. For instance, human populationexplosion contributes to pollution leading to; ozone depletion, eutrophication, acid rain, globaldeforestation, soil erosion and desertification.3
Figure 1.3: World population growth from 1950 to 2050.As the figure 1.3 above indicates, the World population is exponentially growing. This is the reasonwhy most countries, including Rwanda, are practicing the family planning. Family planning is thepractice of controlling the number of children in a family and the intervals between their births. Ifa married couple is sexually active, they have to adopt at least one family planning technique suchas contraception and timing of reproduction. Other techniques commonly used include; sexualityeducation, prevention and management of sexually transmitted infections, pre-conceptioncounselling and management, and infertility management.1.1.4Population growth patternsPopulation growth patterns are graphs (population growth curves) in which increases in size areplotted per unit time. When a population size increases, the growth rate also increases. The largerthe population becomes, the faster it grows. The factors that contribute to the population growthare immigration of new species as well as the birth rate. Population growth is also influencednegatively by emigration and the death rate.1.1.5Birth and death ratesBirth rate is the ratio of live births in a specified area to the adults in population of that area. It isusually expressed per one thousand individuals per year. It is estimated from this calculation:Birth rate x 1000Death rate is the ratio of deaths to the adults in population of a particular area during a particularperiod of time. It is usually calculated as the number of deaths per one thousand individuals peryear and it is estimated from this calculation:Death rate 𝑥.Self –assessment 1.11) Distinguish between population density4 and age structure.2) There are 100 adult elephants in a population of an area. Each year, 10 elephants areproduced while 2 elephants die.
1.2 Population density: Dependent and independent factors affecting populationdensityActivity 1.2The list of factors including; space, nutrients/food, shelter, natural disasters, competition,predation, disease, sunlight, parasitism, temperature, water, human activities, physicalcharacteristics of the environment, and behaviour of organisms in an environment have therelationship with figures below indicating the relationship between animals and theirenvironment.ABFigure 1.4: Some factors affecting population density.1) Categorize the listed factors into density-dependent and density-independent factors.2) Among the 2 categories of factors given above, suggest the factors illustrated by thefigures A and B.Populations are differently distributed. The distribution and the density are controlled byenvironmental factors, which can either increase or decrease the population size by affecting birthrate, death rate, immigration and emigration (Table 1.1 below). These factors are grouped into twomajor categories: Density -dependent factors and Density- independent factors.1.2.1 Density-dependent factors5
Density dependent factors are factors whose effects on the size or growth of the population varywith the population density. The types of density dependent factors include: availability of food,predation, disease and migration. However, food availability is considered as the main factor.1.2.2 Density-independent factorsDensity independent factors can affect the population without being necessary based on the density.They include; natural disasters (droughts, floods, hurricanes and fires), temperature, sunlight,seasonal cycle, human activities, and levels of acidity, cited among many others.Table 1.1: Environmental factors that affect the population densityFactors that increase the population densityPlenty of suitable space availableGood food supplyGood water supplyAbility to resist diseaseSmall number of predators or ability to escapefrom predationHigh reproductive rateFavorable lightStable abiotic conditions including temperatureand chemical conditions within the optimalrange Factors that decrease the population densitySuitable space unavailable or limitedInadequate food supplyInadequate water supplyInability to resist diseaseInability to escape from predationLow reproductive rateToo much or too little , chemical conditions outside theoptimal range .Self-assessment 1.2Discuss the ways by which natural disasters (droughts, floods, hurricanes and fires) affect thepopulation growth.6
1.3 Methods or techniques of measuring population densityActivity 1.3.1Using pegs, strings/ropes, meter-ruler, and quadrats in your school ground, carry out thefollowing field work.a) Move in the school ground and make a line transect of 15 meters by the use of adecametre.b) Use a pegs and strings/ropes to collect all plants and animal species found at each fivemeters across transect.c) In the ground, make five different quadrats of one square meter separated by 3 metersand use pegs and strings/ropes to collect different plants and animal species withineach quadrat.d) Record your samples in the following table with respect to each quadrat:TotalSpecies Number of individuals in each quadratQuadrat 1 Quadrat 2 Quadrat 3 Quadrat 4 Quadrat 5Calculate the population density and species frequency for each studied quadrat.1.3.1 Quadrat methodA quadrat is a square frame that marks off an area of ground, or water, where you can identifydifferent species present and/or take a measurement of their abundance. Before any experiment,the decision on a suitable size for the quadrat and the number of samples to use is taken. Samplesmust be selected randomly to avoid any bias, such as choosing to take all of samples from the placewith fewest species simply because it is the easiest to do. This would not represent the whole areayou are surveying.Figure 1.5: Sampling using a quadrat method7
A quadrat method enables the calculations of 3 aspects of species distribution including; speciesfrequency, species density and species percentage cover. The results can be used to calculatespecies frequency and species density.1.3.2 Species frequencySpecies frequency is a measure of the chance (probability) of a particular species being foundwithin any one of the quadrat, and it is found simply by recording whether the species was presentin each analysed quadrat. For example, if a quadrat is placed 50 times, and a given plant wasidentified in 22 samples, then the species frequency for this plants equals1.3.3 Species density %.Species density is a quantity of how many individuals there are per unit area, for example, persquare meter. To achieve this, one takes the total number of counted individuals and then divide itby the number of quadrats done. An example is:Total number of individuals 200Total area of quadrats 480m2Species density 1.3.4 Species cover .7 individuals/m2.Species cover is a measure of the proportion of ground occupied by the species and gives anestimate of the area covered by the species as the percentage of the total area. For example, if thereare 100 small squares in one quadrat, then the squares in which the plant species is present arecounted. If plants are found in 25 squares within that quadrat, the conclusion is that the plant covers25% of the area.1.3.4 Line transect methodLine transect is a tape or string laid along the ground in a straight line between two poles as a guideto a sampling method used to measure the distribution of organisms. For example, the investigationon change at the edge of a field where it becomes very marshy is done by randomly selecting astarting point in the field a
Pictures A and B represent ecological populations. In biology, an ecological population is a group of organisms of the same species that live in the same area at a certain period of time. The population is the unit of natural selection and evolution. How large population is and how fast it is growing are often used as measures of its health.