Transcription
ARIZONA COMMUNITY COLLEGES:2013 OUTCOMES REPORTIn 2011, Arizona’s community colleges embarked upon a long-term Strategic Vision to significantly increase the number of Arizonans whoachieve their postsecondary education and training goals, complete a degree or certificate, and/or transfer to a university. In order tomeasure progress toward the three major goals outlined in the Strategic Vision, the colleges have implemented a rigorous selfassessment and accountability process centered around the annual collection and distribution of data related to 30 key indicators.Statewide data pertaining to these 30 indicators can be found in the 2013 Strategic Vision Student Progress and Outcomes Report, andonline at www.arizonacommunitycolleges.org/outcomes.The 2013 Outcomes Report complements the 2013 Strategic Vision Student Progress and Outcomes Report, and for 5 core metricsillustrates how each of Arizona’s 10 community college districts compares to the others. Statewide averages are noted in the textaccompanying each metric, and an appendix provides comparison data for all 30 indicators.It is important to note that Arizona’s community colleges differ significantly in terms of the populations served, education and training goals oflearners, and institutional priorities (such as transfer or workforce preparation). Comparing student progress and outcomes acrossdistricts can be an extremely useful precursor to the sharing of best practices and successful program models across the state.However, each district must be assessed in light of its unique characteristics, goals, and priorities, and most importantly, by itsability to demonstrate incremental improvements in student access, retention, and completion over time.Last year was the first full year of Strategic Vision data collection. As such, the 2013 outcomes presented in this document can be comparedto the 2012 baseline, although additional data points are necessary before definitive statements about trends in student progress andoutcomes can be made. The data included in this report will also enable Arizona’s Community Colleges to set reasonable benchmarks forattainment related to core metrics in coming years.
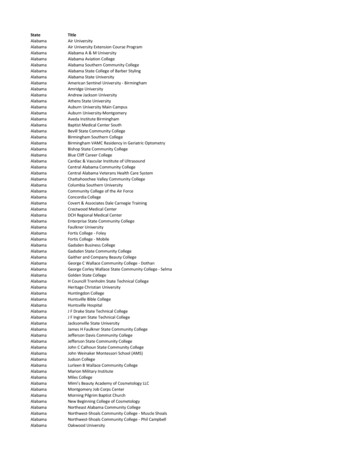
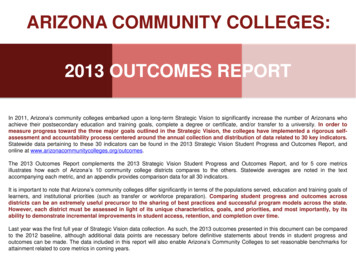
This figure, as well as those that appear on the following pages, illustrate student progress and outcomes data for Arizona Western College(AWC), Central Arizona College (CAC), Cochise College, Coconino Community College (CCC), Eastern Arizona College (EAC), the tencolleges and two skills centers in the Maricopa County Community College District (MCCCD), Mohave Community College, NorthlandPioneer College (NPC), Pima Community College, and Yavapai College.After six years, 30 percent of developmental math learners in the statewide 2006 new student cohort successfully completed a college-levelcourse in math (down slightly from 31 percent the previous year). As well, 45 percent of all developmental English or reading learners in thesame cohort completed a college-level English course (down from 46 percent).While true comparisons with national norms will not be possible until the Voluntary Framework of Accountability begins publishing nationaldata for these and other indicators, a study conducted by scholars at Columbia University’s Community College Research Center¹ showedthat 20 percent of community college students referred to developmental math—and 37 percent of community college students referred todevelopmental English/reading—completed a college-level course in the corresponding subject area within three years. These nationalsuccess after remediation rates are somewhat lower than Arizona’s rates, but are likely comparable, as the national study was limited tothree years.1¹Bailey, T., Jeong, D. W., & Cho, S. W. (2010). Referral, enrollment, and completion in developmental education sequences in community colleges.Economics of Education Review, 29, 255-270.
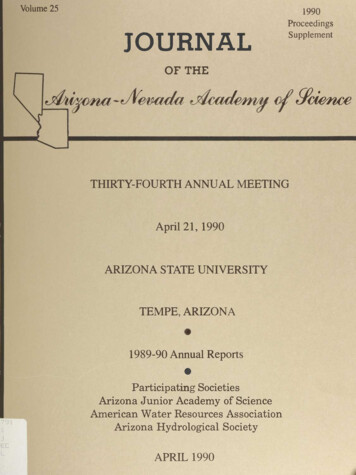
This figure depicts developmental and college-level course success rates among the 2009 and 2010 new student cohorts for each ofArizona’s ten community college districts.Over two years, 61 percent of student credit hours attempted in developmental courses by the statewide 2010 new student cohort weresuccessfully completed (with a grade of A, B, C, or Pass).In that same time period, 72 percent of student credit hours attempted in college-level courses by the statewide 2010 new student cohortwere successfully completed (with a grade of A, B, C, or Pass).These rates are down slightly from the previous year (course success rates for the statewide 2009 new student cohort were 64 and 75percent, respectively), which may be the result of an improved economy drawing some learners out of classrooms and into the workforce.Although national course success rates are not yet available, these indicators are aligned with those included in the American Associationfor Community Colleges’ Voluntary Framework of Accountability initiative, which will allow for comparisons with national norms in years tocome.2
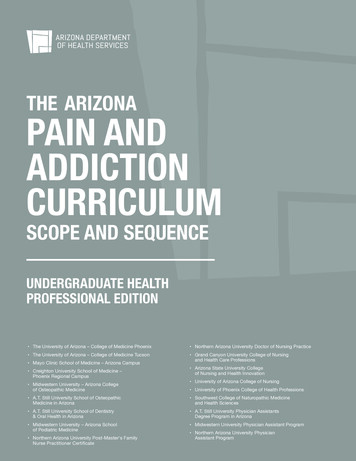
This figure depicts fall-to-fall retention rates among the 2009 and 2010 credential-seeking cohorts for each of Arizona’s ten communitycollege districts.Credential-seeking cohorts are defined as full- and part-time learners who earned at least 12 credit hours by the end of their second year.Tracking a credential-seeking cohort aligns Arizona’s data collection and accountability strategies with those of national community collegeinitiatives such as the Voluntary Framework of Accountability (VFA). Furthermore, analysis of retention outcomes within this cohort providesa more accurate gauge of community college student persistence, as it takes into account learners’ diverse education and training goals.Statewide, 77 percent of learners in the statewide 2010 credential-seeking cohort (excluding those who successfully transferred and/orearned a degree or certificate) persisted at their district to the following fall (the statewide retention rate for the 2009 cohort was also 77percent).The statewide rate—as well as the most recent retention rates at all 10 of Arizona’s community college districts—are somewhat higher thana comparative national rate (53 percent),² as the national number is not limited to credential-seekers. However, because the VFA isbeginning to track and analyze retention among credential-seeking cohorts, more accurate national comparisons should be available infuture years.3²NCHEMS. (2010). Retention rates – First-time college freshmen returning their second year (two-year public institutions). Boulder, CO: Author.
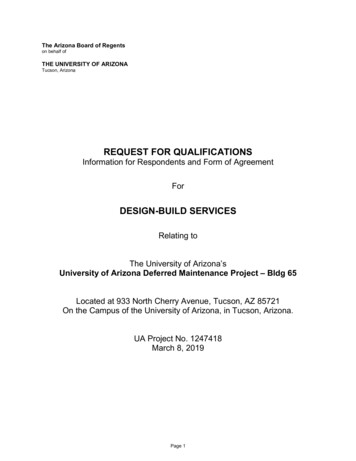
This figure depicts degree/certificate completion (graduation) rates among the 2005 and 2006 credential-seeking cohorts for each ofArizona’s ten community college districts.Credential-seeking cohorts are defined as full- and part-time learners who earned at least 12 credit hours by the end of their second year.Tracking a credential-seeking cohort aligns Arizona’s data collection and accountability strategies with those of national community collegeinitiatives such as the Voluntary Framework of Accountability (VFA). Furthermore, analysis of graduation rates within this cohort provides amore accurate gauge of community college student success, as it takes into account learners’ diverse education and training goals.After six years, 30 percent of the statewide 2006 credential-seeking cohort had completed a community college degree or certificate (thestatewide completion rate for the 2005 cohort was also 30 percent). Graduation rates vary substantially among Arizona’s 10 communitycollege districts and relate, in large part, to the percentage of learners at each district who transfer to a four-year university and/or gainemployment prior to earning a degree or certificate.The statewide rate—as well as the most recent graduation rates at 8 out of 10 of Arizona’s community college districts—are equal to orhigher than a comparative national rate (25 percent),³ as the national number is not limited to credential-seekers. However, because theVFA is beginning to track and analyze completion among credential-seeking sub-cohorts, more accurate national comparisons should beavailable in future years.³U.S. Department of Education, National Center for Education Statistics. (2011). Digest of education statistics. Washington, DC: Author.4
Arizona’s tribal, public community colleges, and universities have agreed upon a common structure for the Arizona General EducationCurriculum (AGEC) in order to ensure the comparability and seamless transfer of general education credits across institutions. The AGECis comprised of 35-37 credit hours of coursework that, upon completion, will transfer to all tribal or public community colleges, as well as thethree state universities, and meet lower division, general education requirements.Although most community college students take courses included in the AGEC, some transfer prior to completing the full curriculum. Whilethese “early transfers” are still viewed as successful completers, research shows that students who have completed a common generaleducation core (such as the AGEC) and/or a degree prior to transfer are better prepared for upper-division work and earn bachelor’sdegrees in less time and with fewer excess credits—both of which lead to cost savings for students and states.⁴In order to improve the efficiency and cost-effectiveness of the transfer process in Arizona, the state’s community colleges are making aconcerted effort to raise the proportion (currently 59 percent, statewide) of in-state transfers who have earned an AGEC and/or degree priorto transfer.5⁴Kisker, C. B., & Wagoner, R. L., (Eds.). (2012). Implementing transfer associate degrees: Perspectives from the states. New directions for communitycolleges, no. 160. San Francisco: Jossey-Bass.
This figure depicts the percent of learners in each district’s 2005 and 2006 credential-seeking cohorts achieving a successful outcome,defined as earning a degree or certificate, transferring to another two- or four-year college or university, continued enrollment, and/orearning at least 30 credits before leaving the institution.Statewide, 80 percent of learners in the 2006 credential-seeking cohort achieved a successful outcome within six years, up from 77 percentfor the 2005 cohort.This definition of a successful community college outcome is aligned with AACC’s VFA project, and recognizes that learners entercommunity colleges with diverse education and training goals, often attend part-time and for more than 6 years, and frequently earn creditsfrom more than one institution en route to the university or to a degree or certificate.Aggregate outcomes measures such as this are receiving increased attention at the national level. In summer 2013 six nationalassociations (AACC, AASCU, ACE, AAU, APLGU, and NAICU) endorsed the aggregate Student Achievement Measure, which in manyways mirrors this one.6
Out of all learners the statewide 2009 occupational completers/leavers cohort who took a technical skill or end-of-program assessmentaligned with industry-recognized standards up to one year after college exit, 94 percent passed the assessment and/or earned an industryrecognized credential. This level of performance far exceeds the 2009-10 national average of 80 percent.⁵The percentage of occupational completers earning industry-recognized credentials ranged from 86 to 97 percent among Arizona’s 10community college districts. Clearly, Arizona’s community colleges provide excellent occupational training and preparation for industryaligned assessments.Examples of occupational programs leading to industry-recognized credentials include, among others, aviation technology, building andconstruction, dental hygiene, education, emergency medical technician, fashion, fire science, nursing, solar technologies, and veterinarytechnologies.7⁵Perkins Collaborative Resource Network. (2013). Core indicator report :1P1 Technical Skill Attainment , 2009-10. Washington, DC: Author.
APPENDIX: ACCESS INDICATORS2013 STRATEGIC VISION STUDENT PROGRESS AND OUTCOMES DATA (BY 2a. Enrollment of underserved populations(underserved 2b. Enrollment of underserved populations (age25 )44%40%⁶35%51%48%36%54%42%52%39%46%55%2c. Enrollment of underserved populations 6%31%3. Percent of 2011-12 credit hours earned viaalternative delivery methods and/or at alternativetimes or places62%-56%69%85%50%35%63%64%66%52%54%4. Community college-going rate42%27%⁷43%38%31%9%22%29%31%15%41%27%5. Overall college-going rate58%⁸68%⁷----------6. Succes after developmental math rate30%20%⁹34%28%28%30%44%34%22%23%25%37%7. Success after developmental 2%49%32%8. Cost of attendance as a percentage of Arizona(or county) median household income15%-21%10%10%18%16%14%22%22%6%13%ACCESS INDICATORS1. 2011-12 full-time student equivalent (FTSE)enrollment⁶U.S. Department of Education, National Center for Education Statistics. (2012). Digest of Education Statistics. Washington, DC: Author.⁷U.S. Department of Labor, Bureau of Labor Statistics. (2012). College enrollment and work activity of 2011 high school graduates. Washington, DC: Author.⁸Postsecondary Education Opportunity. (2013). Chance for College by Age 19 by State, 2010. Oskaloosa, IA: The Mortenson Seminar on Public Policy Analysis and Opportunity for Postsecondary Education.⁹Bailey, T., Jeong, D. W., & Cho, S. W. (2010). Referral, enrollment, and completion in developmental education sequences in community colleges. Economics of Education Review, 29, 155-270.8
APPENDIX: RETENTION INDICATORS2013 STRATEGIC VISION STUDENT PROGRESS AND OUTCOMES DATA (BY DISTRICT, ochiseCCCEACMCCCDMohaveNPCPimaYavapai9. Developmental course success rate60%VFA60%48%66%69%62%66%52%73%52%66%10. College-level course success rate72%VFA64%74%79%78%83%73%77%77%64%74%11a. Percent of first college-level credit hourssuccessfully completed (English Comp. I)70%70%¹⁰62%46%70%82%73%71%77%77%59%71%11b. Percent of first college-level credit hourssuccessfully completed (English Comp. II)72%69%¹⁰66%58%74%79%74%72%81%82%78%72%11c. Percent of first college-level credit hourssuccessfully completed 1c. Percent of first college-level credit hourssuccessfully completed (College 2a. Percent of full-time learners completing 42credits by the end of the second academic year41%VFA59%44%27%36%46%42%32%47%32%38%12b. Percent of part-time learners completing 24credits by the end of the second academic year50%VFA76%52%47%46%55%50%47%54%45%50%13. Fall-to-next-term retention rate92%VFA97%90%90%90%83%93%90%89%91%96%14. Fall-to-fall retention ION INDICATORS¹⁰National Community College Benchmark Project. (2012). Report of national aggregate data. Overland Park, KS: Author.¹¹NCHEMS. (2010). Retention rates - First-time college freshmen returning their second year (two-year public institutions). Boulder, CO: Author.9
APPENDIX: COMPLETION INDICATORS2013 STRATEGIC VISION STUDENT PROGRESS AND OUTCOMES DATA (BY DISTRICT, CONT.)COMPLETION INDICATORS15. Percent of learners achieving stated educationor training hiseCCCEACMCCCDMohaveNPCPimaYavapaiThis indicator is in development. It will be incorporated into the Strategic Vision once enough time has passed to link intention to completion data.16. Number of degrees and certificates awarded 4215,89980817. Graduation (degree/certificate completion) rate30%25%¹²27%46%30%11%28%30%34%14%32%25%18. Percent of learners who complete an AGECwithin six 2552321546,9581791041,81730520. Percent of 2011-12 transfers with an AGECand/or degree at time of transfer59%-70%73%66%52%69%57%67%54%61%61%21. In-state university transfer rate (2005-06 cohort)29%-24%30%19%48%22%31%13%16%29%25%22. Overall transfer rate (2006-07 cohort)29%25%¹³27%24%27%32%29%29%23%18%30%28%23. Percent of learners achieving a successfulcommunity college outcome80%VFA90%92%70%79%73%77%85%74%97%67%24. Percent of 2008-09 full-time transfers to Arizonapublic universities who earn a bachelor's degree infour years70%-73%66%59%65%63%71%65%57%71%74%19. Number of in-state university transfers in 2011-12¹²U.S. Department of Education, National Center for Education Statistics. (2011). Digest of Education Statistics. Washington, DC: Author.¹³Center for the Study of Community Colleges. (2002). National transfer rates are up! Results of the 2001 Transfer Assembly Project. Los Angeles: Author.10
APPENDIX: COMPLETION INDICATORS2013 STRATEGIC VISION STUDENT PROGRESS AND OUTCOMES DATA (BY DISTRICT, ochiseCCCEACMCCCDMohaveNPCPimaYavapai25. Percent of all 2008-09 transfers who earn abachelor's degree in four years43%60%¹⁴46%47%26%40%69%43%11%31%70%44%26. Percent of occupational program completersearning an industry-recognized credential within ION INDICATORS, CONT.27. Percent of occupational program completerseither employed with a livable wage or enrolled infurther educationThis indicator is in development. It will be incorporated into the Strategic Vision once adjustments have been made to account for disparities in wagesacross various community college service areas.28. Percent of ABE/GED learners who . Percent of ABE/GED completers enrolled inpostsecondary education or training80%-100%87%98%89%-61%69%64%91%83%30a. Percent of adults in Arizona (or county) withsome college or an associate degree34%29%¹⁵32 - 35%37%38%33%36% - 38%33%38%38%34%39%30b. Percent of adults in Arizona (or county) with abachelor's or higher degree26%28%¹⁵9% - 14%18%22%31%12% - 16%29%12%14%30%24%¹⁴National Student Clearinghouse. (2012). Snapshot Report: Transfer Outcomes (Four Years After Transfer). Herndon, VA: Author.¹⁵U.S. Bureau of the Census. (2013). Educational attainment: 2007-2011 American Community Survey 5-year estimates. Washington, DC: Author.11
This figure, as well as those that appear on the following pages, illustrate student progress and outcomes data for Arizona Western College (AWC), Central Arizona College (CAC), Cochise College, Coconino Community College (CCC), Eastern Arizona College (EAC), the ten