Transcription
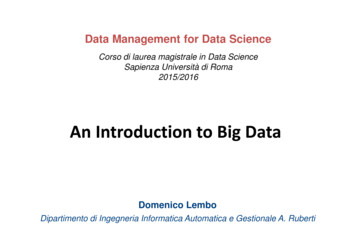
Network Telemetryand Big DataFrom Flow Aggregation over Streaming Telemetry toAnomaly Detection
Towards Intelligent MonitoringDevices do not know the network. Big Data & Analytics doesAIBringing visibility andstructure into whatappears to be chaos tohumans, but makessense so machines andnetworksMetabaseAuto Insight
Data collection with Network TelemetryWithout order and structure, Big Data & Analytics gets lostNetwork Telemetry A data collection framework where the networkdevice pushes its metrics to Big Data.Big Data & IXgRPCNetflowgNMINetstreamOpenConfigYANGsFlowIn Situ OAMData CollectionNetworkTopology metrics How logical and physical network devices areconnected with each other.Control-plane metrics How the network is provisioned and redundancyworks.Forwarding-plane metrics How traffic flows through the network.
Data pipeline with Big DataHow do you eat an elephant? Piece by piece1Network Device7Human/Machine1. Pushing metrics to collectors.2. Aggregate or directly ingest into topics.3. Buffers, consolidate and forward.2Collector6Analytics4. Process and re-ingest.5. Import for midterm storage.3Message Broker5Data Storage4Data Processing3Message Broker6. Access metrics and perform baselinemeasurements.7. Are informed about events and possibleservice impact.
Intent Based Network - Insights into metric modellingWithout a BGP route-distinguisher, 192.168.1.1 isn't unique172.16.31.10TCP 80Logical ConnectionConnection PointNET 172.16.31.0/24COM 64499:123RD 64999:1100.67.1.4TCP 2345ECOM: 60633:1100001064COM 64497:798NET 172.16.31.0/24, 100.67.1.0/24MPLS PEConnection PointMPLS PENET 100.67.1.0/24COM 64499:456RD 64999:2Service Inventory consists of variouslogical elements which influencespredefined forwarding behavior withinnetwork.Service Inventory is pushed with BGPservice and topology relevant standardcommunities into BGP network.MPLS PE exposing flow (forwardingplane) and BGP (routing control-plane) tocollector.Daisy CollectorCollector collect, correlate, aggregate andingest into message broker.
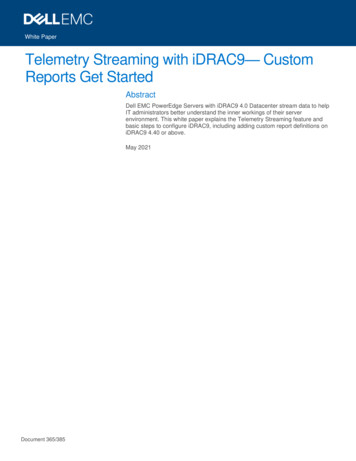
VPN Service view with BGP VPNv4/6 Flow AggregationDepending our needs, we can look at data from different anglesBig Data & AnalyticsControl-PlaneBGP VPNv4/6 MetricsBGP Standard BGP ExtendedCommunities CommunitiesBGP routedistinguisherForwarding-PlaneIPv4/6 Header MetricsSRCIPv4/6DSTIPv4/6L4Type ofSRC Port DST PortProtocolServiceApplication CorrelationTopologyDevice Interface MetricsFwdStatusIncomingEgressInterface ID Interface IDOctetPacketCountBytePacketCountTopology CorrelationData CollectionNetworkBGP communities are used to correlate to service inventoryIPv4/6 address, Layer 4 port and protocol are used to correlate to applicationsInterface ID will be used to correlate to physical topology collected through streaming telemetry
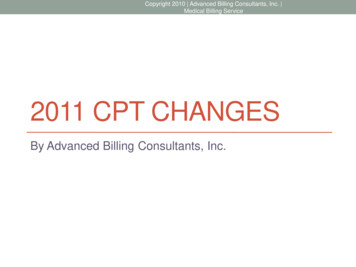
Kafka Message ingestion - BGP VPNv4/6 Flow AggregationBGP and flow metrics come together into one message{"event type": "purge","label": "sgs01ro1010olt","comms": "60633:100 60633:265 60633:1001 60633:1032 64497:1528 64499:6000","ecomms": "RT:12429:20000001 RT:60633:1100001715","peer ip src": "138.187.57.53","src comms": "60633:100 60633:204 60633:1004 60633:1020 60633:1034 60633:10004 60633:10031 60633:10044","src ecomms": "RT:12429:30000001 RT:12429:32100001 RT:65511:1581 RT:65511:881581","iface in": 33,"iface out": 47,"mpls vpn rd": "2:4200005685:11","ip src": "85.3.167.134","net src": "85.3.164.0","ip dst": "195.186.219.32","net dst": "195.186.219.32","mask src": 22,"mask dst": 32,"port src": 50379,"port dst": 8443,"tcp flags": "24","ip proto": "tcp","tos": 0,"timestamp start": "1540999270.0","timestamp end": "1540999270.0","timestamp arrival": "1540999295.307353","timestamp min": "1540999296.0","timestamp max": "1540999296.0","in iface desc": "","forwarding status": "64","vrf id ingress": "1610612736","vrf id egress": "1610612752","vrf name": "","stamp inserted": "1540999260","stamp updated": "1540999299","packets": 512,"bytes": 770048,"writer id": "zhb01bgp01/10592" Example Kafka message containing correlated BGPVPNv4, IPFIX Flow and collector enriched metrics We use locally unique SNMP Interface ID (RFC 2863) formetric correlation on collector.}
NAT service view with BGP VPNv4/6 Flow AggregationGiving insights in what is forwarded with which addresses at which pointBig Data & AnalyticsControl-PlaneBGP VPNv4/6 MetricsBGP Standard BGP ExtendedCommunities CommunitiesBGP routedistinguisherForwarding-PlaneIPv4/6 NAT Event MetricsSRCIPv4/6SRCIPv4/6DSTIPv4/6DSTIPv4/6L4SRC Port DST PortProtocolL4SRC Port DST PortProtocolTopologyDevice Interface MetricsBefore NATAfter NATIncomingVRF IDOctetPacketCountBytePacketCountApplication CorrelationData CollectionNetworkBGP communities are used to correlate to service inventoryIPv4/6 address, Layer 4 port and protocol are used to correlate to applicationsInterface ID will be used to correlate to physical topology collected through streaming telemetry
Kafka Message ingestion - BGP VPNv4/6 NAT Event AggregationBGP and NAT event come together into one message{"event type": "purge","label": "ipf-bew640-r-ss-01,SCB-NAT","comms": "60633:299 60633:1001 60633:1033 60633:1111 64497:9998 64499:9013 64499:9014","ecomms": "RT:60633:1100009988 RT:60633:1100009998 SoO:64499:1","peer ip src": "138.187.57.59","comms src": "60633:299 60633:1001 60633:1034 64497:9998 64499:9016","ecomms src": "RT:60633:1100009998","mpls vpn rd": "0:64499:1000990012","ip src": "10.100.100.2","net src": "10.100.100.0","ip dst": "8.8.8.2","net dst": "8.8.8.0","mask src": 24,"mask dst": 24,"port src": 17384,"port dst": 17384,"ip proto": "icmp","post nat ip src": "100.100.1.3","post nat ip dst": "8.8.8.2","post nat port src": 17384,"post nat port dst": 17384,"nat event": 1,"timestamp start": "1556517591.666000","timestamp end": "0.000000","timestamp arrival": "1556517660.675699","timestamp min": "1556517682.000000","timestamp max": "1556517682.000000","vrf id ingress": "1","stamp inserted": "1556517660","stamp updated": "1556517683","writer id": "daisy62bgp01/16124" Example Kafka message containing correlated BGPVPNv4, IPFIF NAT Event and collector enriched metrics We use locally unique ingress VRF ID for metriccorrelation on collector.}
VPN Service view with VXLAN Flow AggregationGroup by VNI or CVLAN to bring visibility into the forwarding pathBig Data & AnalyticsControl-PlaneVXLAN Ethernet MericsVNISVLAN TagCVLANTagService CorrelationSRCMACDSTMACForwarding-PlaneIPv4/6 Header MetricsSRCIPv4/6DSTIPv4/6L4Type ofSRC Port DST PortProtocolServiceApplication CorrelationTopologyDevice Interface MetricsIncomingEgressInterface ID Interface IDOctetPacketCountBytePacketCountTopology CorrelationData CollectionNetworkSVLAN and CVLAN tag are used to correlate to service inventoryIPv4/6 address, Layer 4 port and protocol are used to correlate to applicationsInterface ID is used to correlate to physical topology collected through streaming telemetry
Kafka Message ingestion – VXLAN Flow AggregationVXLAN and flow metrics come together into one message{"event type": "purge","label": "ipi-zbb900-r-ms-01","mac src": "00:00:5e:00:01:01","mac dst": "00:70:01:00:00:2d","peer ip src": "10.244.23.1","iface in": 0,"iface out": 134,"ip src": "10.239.16.1","ip dst": "10.238.19.144","port src": 67,"port dst": 68,"tcp flags": "0","ip proto": "udp","tos": 112,"timestamp start": "1541000396.0","timestamp end": "1541000396.0","timestamp arrival":"1541000410.542835","timestamp min": "1541001726.0","timestamp max": "1541001726.0","dot1qcvlanid": "104","dot1qsvlanid": "100000000325d61","stamp inserted": "1541001720","stamp updated": "1541001727","packets": 1,"bytes": 402,"writer id": "daisyvxl02/67251"} Example Kafka message containing correlated VXLAN,IPFIX Flow and collector enriched metrics Metric correlation is performed on routers.
Huawei and Swisscom Colaboration within NetcityAlone we can do so little; together we can do so much Since March 2018, Huawei and Swisscomcollaborate under Netcity to coordinatecutting edge technology developments.VXLAN Tunnel /1100GE5/0/11 Within this scope, Netstream VXLAN inner-IPfeature was extended to support the nextgeneration Swisscom Broadband IPv6underlay network and expose VXLAN headermetrics on highly scalable Cloud EnginePlatform in latest VRP V200R005 release.
Its Demo Time !Network Telemetry at Swisscom
"Wait a minute, Doc. Are you tellingme that you built a time machine.out of a DeLorean?!"Marty McFly 1985 - Back to the Future
MeerkatAnomaly Detection Engine @Timeseries Analytics PlatformZongren LiuSenior Data Scientist
Timeseries Analytics Platform (TAP)From Analytics to Root Cause AnalysisAnomaly DetectionwithRoot Cause AnalysisTAPSelf-service AnalyticsMetabaseMeerkatDruidKafka/HDFSRealtime OLAP Storage & Query Engine
TAP in NumbersIn seconds to billions40 Kqueries/ day20 TiB2 Bievents/day20 nodes150 Kevents/sec150 Birows100 timeseries150 users1’600 questions1 sec/query(Avg)
Towards Intelligent MonitoringThreshold based approach is not enoughNeed to build a statistical model that will Learn the time series pattern from historical data (and labels) Predict future values and compare with real measurements Outlier if : prediction – observation threshold
ChallengesNeed to be quick and accurateRealtime detectiondaily cycleweekly cycle Online and fast algorithm Delay & data quality handlingNo/few labels Unsupervised (semi) learning Models auto selection/tuningunderfittingoverfitting
Root Cause AnalysisUnderstand the cause/impact of an alerted anomalyBased on contextual data stored in DruidTimestampFailed CallsCell TowerBrandFirmwareKPI 12:0070a3b2.z6553523An engineering team may look at 6 different categories Having from 2 to 25’000 different valuesMeerkat can do this a few seconds !
Meerkat – Building BlocksHow do you eat an elephant? Piece by ectionAlertingAlertingRoot onInterfacesPersistenceAnomaly APIFeedback APIWeb App
"Jesus Christ, Doc, youdisintegrated Einstein!"Marty McFly 1985 - Back to the Future
whoamiPaolo LucenteGitHub: paololucenteLinkedIn: plucenteDigging data out of networks worldwide for fun andprofit for more than 10 years
pmacct is open-source, free, GPL’ed wIPFIXhttp://www.pmacct.net
The use-case for message brokers
Use cases by industryMonitor customer quotas or fair-usage policyPeeringInfer member relationsProvide members traffic statsVerify roaming chargesInspect subscribers behaviourDetect revenue leaksCustomer retentionPeeringQuery traffic stats on customspatial and temporal bounds
Some technical facts (1/2)Pluggable architecture: Can easily add support for new data sources and backendsCorrelation of data sources: Natively supported data sources (ie. BGP, BMP, IGP, Streaming Telemetry) External data sources via tags and labelsPervasive data-reduction techniques, ie.: Data aggregation Filtering Sampling
Some technical facts (1/2)Build multiple views out of the very same collected network traffic dataset, ie.: Unaggregated to flat-files for security and forensics; or to message brokers (RabbitMQ,Kafka) for Big Data Aggregated as [ ingress router , ingress interface , BGP next-hop , peerdestination ASN ] and sent to a SQL DB to build an internal traffic matrix for capacityplanning purposesEnable analytics against the collected data sources (ie. BGP, BMP, Streaming Telemetry): Stream real-time Dump at regular time intervals (possible state compression)
Streaming TelemetryA scalable replacement for SNMP: Push technology Subscribing to data of interestA long journey to standardization ahead: Models: Openconfig and vendor-specific Transport: traditional, Netconf and gNMI RPC: Netconf (YANG Push) and gNMI Encoding: JSON and GPB
pmacct & Streaming Telemetry (1/3)Mission statement: Integrate Streaming Telemetry data with other relevant technologies (ie. IPFIX, BMP,etc.) Especially in the current pre-standardization stage, offer an efficient multi-vendorcollection layer for Streaming Telemetry
pmacct & Streaming Telemetry (2/3)pmtelemetrydTelemetry dump at regular time intervalsStreamingTelemetryTelemetry real-time logflat-filesKafka
pmacct & Streaming Telemetry (3/3)aggregation method #1nfacctdNetFlowIPFIXaggregation method #2flat-filesMySQLKafkaStreamingtelemetry
pmacct in SwisscomNetwork DeviceHuman / MachineCollectorAnalyticsMessage BrokerData StorageData ProcessingMessage BrokerBig Data & IXgRPCNetflowgNMINetstreamOpenConfigYANGsFlowIn Situ OAMData CollectionNetworkCredits to: T. Graf (Swisscom) @ UBBF 2018
"I guess you guys aren't ready forthat yet. But your kids are gonnalove it."Marty McFly 1955 - Back to the Future
CreditsPaolo Lucente paolo@pmacct.net Zongren Liu zongren.liu@swisscom.com Thomas Graf thomas.graf@swisscom.com
GlossaryWhat?pmacctpmacct is a small set of multi-purpose passive network monitoring tools by Paolo LucenteDaisyIs the Network Telemetry platform name at SwisscomMeerkatIs the Anomaly Detection platform name at SwisscomNetcityMemorandum between Swisscom and Huawei to improve collaborationBig DataIs set of applications and databases to manage a very large amount of metricsAnomaly DetectionCompares real time metrics to history by using artificial intelligenceControl PlaneSteers the network. Example: BGP, Border Gateway ProtocolForwarding PlaneForwards traffic through the network. Example: FIB, Forwarding Information BaseTopologyPhysical connections between a group of network devicesFlow AggregationWith topology or control-plane correlated Layer2-4 IP flow metricsStreaming TelemetryA SNMP replacement where topology metrics are streamed to a collectorOpenConfigA consistent set of vendor-neutral data models written in YANGNetconfNetwork management protocol for device configurationRabbitMQ, KafkaRabbitMQ and Apache Kafka are the two most popular message brokersDruidApache Druid is a high performance analytics data store for time series metrics
GlossaryWhat?VXLANVirtual Extensible Local Area Network. An IP overlay encapsulationVNIVirtual Extensible LAN Network Identifier. A unique VPN tunnel identifierIPFIXIP Flow Information Export. A protocol to collect IP flow metricsBMPBGP Monitoring Protocol. A protocol to collect BGP control-plane metricsBGPBorder Gateway Protocol. The routing protocol used in the Internet and at large networksASNAutonomous System Number. A network domain used in the routing protocol BGPIGPInternal Gateway Protocol. Providing the next-hop attribute for BGP.gRPCGoogle Remote Procedure Call, transport Protocol for Streaming TelemetrygNMIGoogle Network Management Interface, IETF Draft for Streaming TelemetryYANGYet Another Next Generation. A data modelling language for topology metricsJSONJavaScript Object Notation. A lightweight data-interchange formatGPBGoogle's language/platform-neutral, extensible mechanism for serializing structured data
VPN Service view with BGP VPNv4/6 Flow Aggregation Depending our needs, we can look at data from different angles BGP communities are used to correlate to service inventory IPv4/6 address, Layer 4 port and protocol are used to correlate to applications Interface ID will be used to correlate to physical topology collected through streaming telemetry .