Transcription
Transportation PlanADOPTED JULY 17, 2019CITY OFBLOOMINGTONPLANNING AND TRANSPORTATION
3DVVHG 5XII &KRSUD DEVHQW
'LVWULEXWHG WR 0D\RU &RXQFLO &OHUN &RQWUROOHU /HJDO 3ODQQLQJ 3XEOLF :RUNV
Table of ContentsExecutive Summary . iiOverarching Goals and Approaches . iiiSpecific Suggestions for Improvement . iiiIntegrate New Trends and Transit Expansion. iii1.2.3.4.5.6.Introduction . 11.1Vision and Planning Approach . 11.2Purpose . 21.3Development of the Plan . 3The State of Transportation in Bloomington . 32.1City Transportation History . 32.2Bloomington Today . 42.3Review of Previous Plans . 72.4Existing Transportation Conditions . 92.5Planning for New and Future Transportation Options . 19Street Network and Classifications . 213.1Transportation Planning Approach . 213.2Street Typologies . 233.3Bicycle Facility Types. 373.4Bicycle Network . 393.5Pedestrian Network Assessment . 433.6Key Treatments and Supporting Guidance . 48Recommended Projects . 534.1New Roadway Connections . 534.2Multimodal Projects . 57Next Steps for Key Recommendations . 615.1Overall Approaches . 615.2Policy Recommendations . 62Conclusion . 66i
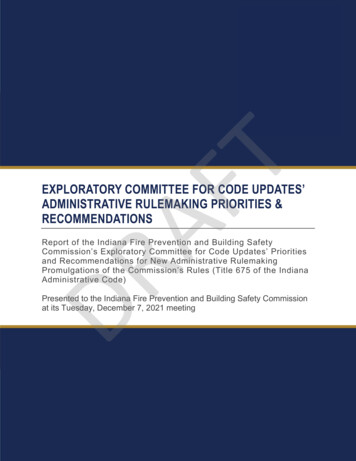
Executive SummaryIn October of 2018 the Intergovernmental Panel onClimate Change (IPCC) reported that it is anecessity for the governments of the world to bringabout a 45% reduction of greenhouse gasemissions by 2030 and a 100% reduction by 2050.If we do not hit these targets, the IPCC said wecould start seeing “catastrophic” consequences asearly as 2040 that will make the worlduninhabitable for many species and do irreparableharm to our ecosystems.The City of Bloomington is a government of theBloomington’s B-Line Trailworld, and we have to do our part to reduceemissions. According to the EPA, the Transportation sector accounts for 28% of US greenhouse gasemissions. Of Transportation emissions, 60% -- meaning 16.8% of total US emissions -- are causedby “light duty vehicles,” meaning personal cars and trucks. The City of Bloomington can directlyimpact our transportation emissions through the infrastructure we build, the modes oftransportation we prioritize, and the behaviors we incentivize.As stated in the Comprehensive Master Plan goals, which were agreed upon after a thorough andlengthy public vetting process, the City must “Provide a safe, efficient, accessible, and connectedsystem of transportation that emphasizes public transit, walking, and biking to enhance options toreduce our overall dependence on the automobile.” This must be the guiding principle of ourTransportation Plan.Bloomington’s growing population presents immense challenges to the city’s transportationnetwork. Even though residents are walking, bicycling, and taking transit at high rates, the existingtransportation infrastructure was primarily designed to serve automobile transportation. We haverenewed concerns about the link between transportation and healthy lifestyles. Meanwhile, thegrowing urgency of addressing climate change makes moving away from individual automobile usemore imperative.The Bloomington Transportation Plan (Plan) supports Bloomington’s vision of a safe, efficient,accessible, and well-connected multimodal transportation system with enhanced transportationoptions and reduced dependence on the individual automobile; and, will guide the city as itcontinues to grow and face new transportation challenges.This Plan fulfills the 2018 Comprehensive Plan requirement that calls for the development of anupdated Master Thoroughfare Plan that includes elements of an active transportation plan. As anupdate to the 2002 Master Thoroughfare Plan, this Plan identifies new projects and programs aswell as opportunities to coordinate their delivery for maximum benefit to community members.This Plan will be incorporated into the City’s Comprehensive Plan, and it will guide the City’stransportation investments, policies, and operations to achieve its 2040 vision.This Plan recognizes the growing rates of walking, bicycling, and transit riding in Bloomington andthe importance of planning for these active and healthy modes while continuing to maintain andimprove the City’s existing transportation infrastructure. The Plan achieves this shift by rethinkingii
street classifications and providing updated multimodal facility recommendations. As Bloomingtonhas limited right-of-way (ROW) for new or expanded transportation infrastructure, the City mustconsider the needs of all travelers in various types of environments as it retrofits existing facilities.The City of Bloomington must carefully consider its space, funding, and time to prioritizeinfrastructure for people who take the bus, bicycle, or walk for transportation. Since someresidents are not able to use these transportation modes, and electric cars are becoming a morefeasible option (even powered by renewable energy), infrastructure for cars should not beneglected. However, as stated in our Comprehensive Plan, investment in nonautomotive modesmust be prioritized. This multimodal and context-driven approach positions Bloomington to meetits current and future transportation needs and goals.The project and program recommendations in this Plan were developed through a communityengagement process, a review of the City’s and region’s adopted plans, and technical analysis. Thecommunity engagement process included public charrettes, an online survey, an online mappingtool, and one-on-one meetings with stakeholders and public officials. These in-depth engagementsprovided key insights into what community members value most in their transportation network,what is missing, what works, and what can be improved.The Plan recommends 67 new street connections, 33 multimodal projects, and 7 policyrecommendations. Below is a summary of the major sections of this Plan.Overarching Goals and ApproachesxxxxPlan for future street connectionsIntegrate transportation and land useMaintain the street grid network and expand it to new developmentsAdopt a Complete Streets policySpecific Suggestions for ImprovementxxxxxRedesign Kirkwood Avenue as a shared street with focus on pedestriansImprove multimodal travel along major E-W and N-S corridors This mainly focuses on two pairs of one-way street corridors: College Avenue andWalnut Street, and 3rd Street and Atwater AvenueExtend the B-Line and invest in high-priority multimodal routesExpand the neighborhood greenway network with resident inputUpdate the neighborhood traffic calming policy and proceduresIntegrate New Trends and Transit ExpansionxxxxxPlace a high priority on public transitWork on curbside managementPlan for dockless mobility optionsIntegrate ride-hailing services in the transportation systemPlan for the use of autonomous vehiclesiii
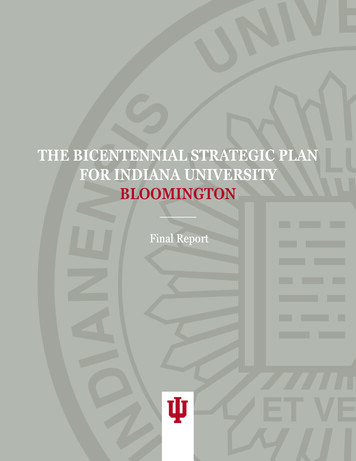
The Bloomington Transportation Plan responds toexisting and future transportation needs andreflects the community’s shared vision, values, andgoals. The Plan is a roadmap for a more connectedand multimodal Bloomington.Community members participating in the firstplanning charrette (January 2018)iv
1. IntroductionThe City of Bloomington’s population growth sincethe 1990s has put pressure on its transportationsystem, making it increasingly difficult to providemobility within existing and often constrainedstreets. Fortunately, the City’s recently updated2018 Comprehensive Plan provides Bloomingtonwith a clear vision for a safe, efficient, accessible,and connected transportation system.The Bloomington Transportation Plan (Plan) takesinto consideration the City’s existing transportationstudies, the existing state of the system, and policyanalyses and builds upon the Comprehensive Plan’smultimodal transportation vision and goals. ThisPlan will help the City realize the ComprehensivePlan’s vision by defining the necessary steps tobuild a transportation system that works for allroadway users, regardless of age, income, mobility,or transportation mode. This Plan will also help theCity improve and maintain its existingtransportation system, implement new projects,and establish transportation priorities for the next20 years. Although the Plan has a 20-year horizon,Benefits of multimodal transportation planningthe City intends for it to be reviewed, and possiblyamended, every 5 years to remain current.1.1 Vision and Planning ApproachThe City’s focus on multimodal transportation planning is outlined in the City’s Comprehensive Planand the Vision Statement included within that Plan. The Vision Statement comprises 16 principlesthat were drafted through a public engagement process and adopted by City Council on January 16,2013. This Plan will help the City of Bloomington work towards its vision of achieving excellencethrough collaboration, creativity, cultural vitality, inclusion and sustainability.1 The Plan supports theCity’s vision by implementing one of the 16 identified Vision Statement Principles:Provide a safe, efficient, accessible and connected system of transportation thatemphasizes public transit, walking, and biking to enhance options to reduce our overalldependence on the automobile.In addition to this transportation-focused Vision Statement Principle, this Plan also supports thefollowing six guiding principles from the Comprehensive Plan:x1Nurture a resilient, environmentally responsible community by judiciously using our scarceresources, enhancing our natural assets, protecting our historic resources, and supporting avital local food system.City of Bloomington. 2018 Comprehensive Plan.1
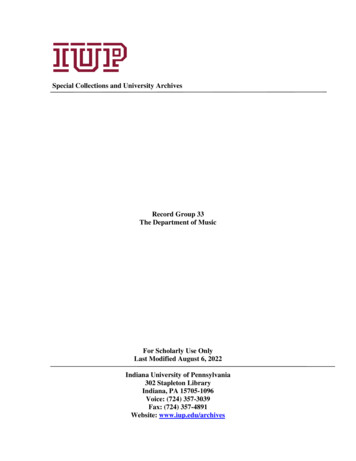
In particular, the goal “reduce greenhouse gas emissions” from Chapter 3 of theComprehensive Plan is relevant.Nurture our vibrant and historic downtown as the flourishing center of the communityEnsure all land development activity makes a positive and lasting community contributionEmbrace all of our neighborhoods as active and vital community assets that need essentialservices, infrastructure, assistance, historic protection and access to small-scaled mixed-usecentersEnhance the community’s role as a regional economic hubEncourage healthy lifestyles by providing high quality public places, greenspaces, and parksand an array of recreational activities and eventsoxxxxxIn responding to the Comprehensive Plan’s call for the development of a truly multimodaltransportation system, this Plan takes a place-based approach to developing the transportationnetwork. This approach is shaped by the City’s recognition of the community-wide costs of unequalplanning and programming among different modes of travel. It also highlights the congestionmanagement and long-term transportation planning benefits of a multimodal approach. Increasesin inequality, emissions, transportation maintenance costs, obesity rates, physical inactivity levels,and roadway crashes are some of the costs of not taking a multimodal planning approach.1.2 PurposeThe City’s transportation plans must reflect its evolving vision and policies, land use profile, andfuture needs. Bloomington’s transportation and land use policies must be aligned and updated on aregular basis because the public right-of-way (ROW) connects all land uses to people, goods,services, and utilities. Not considering transportation and land use policies in tandem, or notupdating these policies on a regular basis, can lead to imbalanced growth, service deliverydisruption, and expanding and inequitable public-sector costs. Through coordinated, contextsensitive planning, the City can leverage its growth and work towards its vision of achievingexcellence through collaboration, creativity, cultural vitality, inclusion, and sustainability. Thecharacter of streets often change from block to block. As new streets are designed and existingstreets are redesigned with various projects, the focus should be on livability and the pivotal rolestreets play in social, public, and economic vitality.The City is required by Indiana Code 36-7-4-502 to develop and maintain a master thoroughfareplan, as part of a comprehensive plan, to provide guidance on the public ROW development. ThisPlan fulfills that requirement by providing general guidance to the City on the design, operations,and maintenance of the public right-of-way.Figure 1. Public Input on Transportation Planning GoalsFurthermore, in accordance with Indiana Code36-7-4-506, this Plan provides guidance on, 1) thepublic ROW’s preservation, 2) theimplementation of the Comprehensive Plan’stransportation-focused Vision Principle, and 3)the interdepartmental coordination within theCity administration.In addition to the state requirements, this Planreflects the City’s focus on multimodaltransportation planning and context-based design2
approaches. This Plan combines elements that have traditionally been presented separately in athoroughfare plan and an active transportation plan. This combined approach provides significantbenefits to the City as it establishes a comprehensive planning approach for developing,prioritizing, and implementing the City’s various transportation needs. This approach also assiststhe City in identifying opportunities to improve project coordination, to maximize benefits toresidents, and to improve project delivery efficiencies.1.3 Development of the PlanThis Plan’s development was guided by a review of past transportation studies and adopted plans,dialogue and input from two charrettes with community stakeholders, review of national bestpractice design guidelines, analysis of crash data and traffic volume data, and a geographic analysisof the existing network. Studies and plans reviewed include the 2018 Bloomington ComprehensivePlan, the 2012 Monroe County Comprehensive Plan, the 2010 Indiana University BloomingtonCampus Master Plan, 2015 Indiana University Bicycle Master Plan, the 2011 Breaking Away:Journey to Platinum report, the 2008 Bicycle and Pedestrian Transportation and Greenways SystemPlan, and the 2002 Growth Policies Plan- Part 5: Master Thoroughfare Plan. The review’s findingsare discussed in Section 2.4 and provided in Appendix A.Planning CharrettesThe first of the two planning charrettes was 4-days long in January 2018 and included two publicmeetings and numerous one-on-one meetings with elected officials, chamber of commercerepresentatives, Monroe County planning and public works officials, Bloomington Transitrepresentatives, Stone Belt representatives, and many more residents. Approximately 80 and 40residents attended the first and the second public meetings, respectively. The planning charrettesincluded presentations, small group discussions, and dot matrix voting to encourage participants toengage with the Plan’s development. The charrette participants shared their perspectives on whatthey like and dislike most about the city’s transportation network, what values should be includedin Bloomington’s street design, and what the transportation network is missing.Additionally, the participants voted on what transportation planning goals they agreed with most.From the five options that were presented, “Create/Maintain Sustainable Transportation” receivedthe most votes during the charrette, and the option “Plan and Develop Parking” received the leastnumber of votes. Figure 1 shows the results of the public input on goals and values.The second planning charrette was 3-days long in July 2018 and was designed to obtain valuableinput from community stakeholders on the draft of the Plan. Over 100 people attended the publicmeeting held at the end of the charrette. Stakeholders and the public provided feedback on thePlan’s recommendations including two-way restoration, the Kirkwood shared street, publictransportation improvements, and new roadway connections.2. The State of Transportation in Bloomington2.1 City Transportation HistoryTransportation has played an important role in Bloomington’s history. As the city’s economicengine grew, so did its needs and desire to connect to regional markets. Connections to the railroad3
in 1853-1854 significantly improved the transport of people and limestone, and led to theestablishment of new communities along the lines and growth in the region.While Bloomington and Monroe County enjoyed significant success immediately following WorldWar II, the region went through an economic downturn in the late 1950s and through the 1970s.During this period multiple long-time businesses, including limestone companies, closed and travelbehavior shifted as the opening of College Mall in 1965 reflected changing tastes in retail shopping.Bloomington’s transportation network continued to grow during the early 1990s as additionalroads, railroads, city sewers, paved streets, and sidewalks emerged along the City’s public right-ofway.Today, Bloomington continues to experience economic growth as the high tech, business, education,non-profit, public, and artisan sectors furtherTable 1. Commute Mode Share in Bloomington, 2010mature and develop in the region.2 For example,and 2016from 2014 to 2015 the employment rate grew byDrivePublic3.46 percent in Bloomington, while the state ofWalk CarpoolBikeAloneTransit3 ThisIndiana only saw 0.65 percent growth.201066.30% 11.10% 9.00%5.70% 2.30%trajectory began in the 1980s and has led to201662.80% 13.60% 8.70%6.50% 3.90%significant land use developments and populationPercentgrowth since the 1990s. However, it should be noted-5.30% 22.50% -3.30% 14.00% 69.60%Changethat the employment growth has not led to wagegrowth which has negatively impacted housing and transportation affordability.As Bloomington’s population, economy, and land use has grown and developed over the past 20years, so too have individual transportation habits across the community. From 2010 to 2016, it isestimated that the percentage of Bloomingtonians who drove alone to work decreased 5.3 percent,from 66.3 percent to 62.8 percent. During this period the number of car-free employees inBloomington increased 1.4 percent from 4.7 percent in 2010 to 6.1 percent in 2016.4From 2010 to 2016, walking, public transit, and bicycling commute mode shares significantlyincreased, with bicycling experiencing the greatest change of almost 70 percent. Walking, publictransit, and bicycling mode shares also grew in Monroe County from 2010 to 2016, while stayingrelatively stagnant across Indiana and the U.S. However, transit ridership in Bloomington decreasedbetween 2016 and 2017. This may be attributed, in part, to the popularity of transportationnetwork companies (TNCs) such as Uber and Lyft.2.2 Bloomington TodayAt just over 23 square miles and with an estimated population of over 83,000, Bloomington’s 2016population density is significantly higher—nearly 10 times—than Monroe County’s, as well as FortWayne’s and Indianapolis’s. Higher population density helps support multimodal transportationand accessibility. In comparison to all of Monroe County in 2016, Bloomington had a lower medianhousehold income ( 31,254 compared to 43,389); and median age (23.7 years old compared to28.6 years old). Additionally, Bloomington had a higher poverty rate than Monroe County at 382City of Bloomington. “History of Bloomington and Monroe County.” Accessed .3 U.S. Census Bureau. American Community Survey 2015 1-Year Estimates.4 U.S. Census Bureau. American Community Survey 2016 and 2010 5-Year Estimates.4
percent, compared to 25 percent.5 A further discussion on Bloomington’s demographic profile isprovided in Appendix B.Public HealthIn addition to Bloomington’s general demographics and transportation profile, local public healthdata was analyzed during the Plan’s development to understand current conditions. Commonhealth metrics, such as average amount of leisure-time physical activity and obesity rates, forBloomington were reviewed to gauge the impact of the transportation network’s quality on publichealth. Leisure-time physical activity is just one measure of health, and this Plan recognizes that theamount of leisure time available depends on each person’s circumstances. Bloomington residentswith little or no leisure time can integrate physical activity into their commute by walking orbicycling.Figure 2. Public Health Data ComparisonPublic Health Data Comparison,2015*USAIndianaBloomington0.0%10.0% 20.0% 30.0% 40.0%Adult Leisure-time Inactivity RateAdult Obesity RateIn comparison to national averages, Bloomingtonhas a more active and less obese population. As of2016, about 24 percent of adults in Bloomingtonare not physically active (i.e., 24 percent ofBloomington respondents answered “no” to thefollowing question from the Behavioral Risk FactorSurveillance System survey: “During the pastmonth, other than your regular job, did youparticipate in any physical activities or exercise,such as running, calisthenics, golf, gardening, orwalking for exercise?”) and about 26 percent ofadults are obese.6 While these numbers fall farbelow the national average, there is stillopportunity for improvement and for ensuring thatall residents, regardless of socioeconomic status,have access to safe and reliable opportunities forphysical activity.7, 8*National level data is from 2016The level of physical inactivity among adults variesacross the City of Bloomington. In reviewing data at the census tract level, adults that live north of3rd Street, west of Rogers Street, and south of the SR 45/46 Bypass are less likely to participate inleisure-time physical activities than adults in other parts of the city. See Appendix C. This dataaligns with the findings from the Bicycle Network Analysis (BNA) that was conducted as part of thisPlan’s development. The BNA and its findings are discussed in Section 2.4E.Access to Active Transportation FacilitiesProviding multimodal infrastructure and promoting active transportation is a combined publichealth and planning approach to improve community health. In addition to providing open spaces,building pedestrian and bicycle infrastructure that is accessible to all users is an effective way to5U.S. Census Bureau. American Community Survey 2016 5-Year Estimates.500 Cities Project. Center for Disease Control and Prevention.7 500 Cities Project. Center for Disease Control and Prevention.8 The Centers for Disease Control and Prevention, Behavioral Risk Factor Surveillance System, “Nutrition, PhysicalActivity, and Obesity: Data, Trends and Map.” /index.html.65
promote physical activity. Proximity to walking facilities impacts the physical activity levels ofcommunities. A study of five community clinics that provide health services to underservedpopulations found that clinical patients who lived near a trail were more likely to walk at least 30minutes five times per week, compared to those patients who did not have a trail near their home.9Bloomington’s current pedestrian and bicycle network connects to many popular destinations inthe Downtown area, including schools, grocery stores, retail shops, and the farmers’ market.However, there are also several gaps in the city’s active transportation network due to barriersfrom highways, railroads, and lack of adequate public right-of-way that continue to impactcommunity members’ access, ability, and comfort in walking and bicycling to destinations.Appendix C provides a map of the current pedestrian and bicycle network and destinations.Access to TransitReliable, connected, and high-quality transit service is important to supporting Bloomington’scontinued growth. As identified in the 2018 Comprehensive Plan,Efficient and frequent public transit allows residents of all ages and abilities tofunction independently, avoid isolation, and access destinations around town.10Several studies found that public transit use is associated with less obesity, lower stress levels, andimproved air quality. Additionally, public transit use (even as little as once per week) is associatedwith fewer car trips and more active trips, including walking and biking.11Bloomington Transit is the main local transit service in the City and operates 14 routes with a fleetof 49 buses. It generally operates from around 6:00 a.m. to around midnight during the weekday.Weekend services are limited and infrequent. In 2016, there were approximately, 3.48 millionpassenger boardings, compared to 3.53 million boardings in 2015.Decreases in ridership may be attributed, in part, to the increasing popularity of ride-hailingservices, provided by transportation network companies (TNCs) such as Uber and Lyft. Based onsurvey results in large cities across the country, one study suggests that 24 percent of respondentswould have opted to ride transit if ride-hailing services weren’t available.12 In addition to increasingthe frequency, reliability, and connectivity of transit service, the City of Bloomington can enactordinances to more efficiently manage curb space allocation and prioritize transit vehicles. Keepingaccess to bus stops clear of other vehicles through policy, infrastructure, and enforcement can helpbus operators maintain their schedules and increase efficiency.Several streets in Bloomington serve high-demand and high-use bus routes including 3rd Street, 7thStreet, and 10th Street. Transit should be given priority along these corridors, including above TNCsand private buses. Along these corridors and others, TNCs can diminish the efficiency of transit andthe safety of bicycle facilities for the convenience of a few. For some areas, such as 10th Street, acorridor study that considers, among other options, restricting private vehicle access at all times orduring certain hours would greatly improve the efficiency, convenience, and reliability of transit.9Pierce, J.R., Denison, A.V., Arif, A.A. et al. J Community Health (2006) 31: 289. https://doi.org/10.1007/s10900-0069014-8.10 City of Bloomington. 2018 Comprehensive Plan. Pg.71.11 M. Bopp, V. Gayah, M. Campbell. Examining the Link. 2015. Between Public Transit Use and Active Commuting. Int. J.Environ. Res. Public Health. 12 (4256-4274).12 Schaller Consulting. The New Automobility: Lyft, Uber and the Future of American Cities. July 25, 2018.6
Dedicating specific locations for TNC pick-ups and drop-offs, especially near major destinations,may reduce the likelihood of ride-hailing drivers blocking bus stops; enforcement would also play arole in reducing and preventing instances of TNCs blocking bus stops and bicycle lanes. Anincreasing number of communities are finding ways to successfully integrate transit service withride-hailing service, taking advantage of ride-hailing to complement or replace underperformingtransit routes.13Indiana University also operates a free fixed-route bus service called Campus Bus in Bloomington. Itoperates five ro
1.1 Vision and Planning Approach The City's focus on multimodal transportation planning is outlined in the City's Comprehensive Plan and the Vision Statement included within that Plan. The Vision Statement comprises 16 principles that were drafted through a public engagement process and adopted by City Council on January 16, 2013.