Transcription
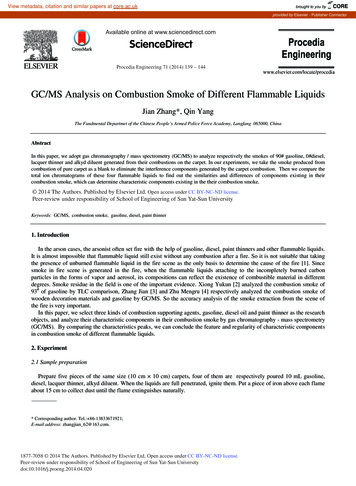
1Smoke on the Water: Energy usage of the Muir-Samuelson NatatoriumJillian Hancock, 17 May 2009, GEOS 206-01Figure 1: View of the Muir-Samuelson Pool from the South endIntroduction and Pool HistoryDuring the times of the Greeks and Romans, large bathing houses were built forrecreational enjoyment, cleansing, and ritual. Over the centuries, the bathing house hasevolved into a high tech facility that involves numerous resources in order to meetregulations for safety as well as standards expected by its patrons. In 1987, WilliamsCollege completed construction of a new natatorium off of Lasell Gymnasium(Facilities). The new facility entailed a 50 meter Olympic sized swimming pool withmovable bulk heads and two one-meter and two three-meter diving boards (Figure 1).The pool contains roughly 800,000 gallons of water that must be treated and filtered daily
2to meet safety and hygiene regulations. It also must be heated for the patrons’ comfortand kept well lit during hours of operation. The facility includes two sets of lockerrooms, one public and one varsity, with running water for showers, sinks, toilets, hairdryers, and swim suit dryers.All of these demands require a substantial amount of energy to function, and inlight of the current interest in greening the Williams College campus and saving moneyduring a time of economic crisis, it may be beneficial to assess pool facility costs in orderto better understand how to make improvements. For my final project, I am going tomeasure and analyze the amount of energy that is required by the campus pool facility,the Muir-Samuelson Natatorium. I will specifically address improvements that could bemade to the pool heating, lighting systems, water use, and overall usage patterns and thenpresent recommendations for improving how the facility runs.Setting and Background InformationPool heatingThe Muir-Samuelson Natatorium is heated to maintain a water temperature of 81degrees Fahrenheit. This falls within the range required for NCAA swimmingcompetition and provides a suitable swimming environment for its patrons. Typically,during winter and spring breaks the pool is closed and not heated. Therefore, the poolmust be maintained at 81 degrees for approximately 49 or 50 weeks of the year.
3Figure 2: Supply for ventilation/dehumidificationFigure 3: Return for ventilation/dehumidificationDuring the summer, the pool is heated and dehumidified by Dry-O-Trons (Figure4). This system reclaims water and heat from the air and returns it to the pool. Supplyand return ventilation at the pool cycle air through the Dry-O-Tron system and the rest isreleased as exhaust (Figure 2, Figure 3). The air is compressed and heated as it flowsthrough the Dry-O-Trons. Heat is transferred to the water that is being filtered andcirculated through the Dry-O-TronsFigure 4: One of the Dry-O-Tron unitsbefore returning to the pool. The pooluses two, 10 horse power Dry-O-Tronswhich run on electricity bought by thecollege (Clark). A diagrammaticdrawing of the Dry-O-Tron system isshown in Figure 11 in the Appendix.Information gathered by Williams College Facilities during the summer of 2008found that the Dry-O-Trons required 13,020 kWh of electricity to heat and dehumidifythe pool for three months or 4,340 kWh per month (Clark, Appendix, Table 1).Assuming electricity costs 0.13 per kWh, it requires 564.20 to heat the pool in thesummer. Because the Dry-O-Trons handle water and humidity, the system corrodes over
4time and the pool’s system has aged since installation in 1987. In the winter, the pool isheated by steam from the Co-Gen power plant that sits behind the pool facility.Ventilation is provided by outside air (Clark). The energy requirements for this designhave not been measured however it is assumed that it requires less energy to run the poolin this manner.Pool lightingThe current lighting system at theFigure 5: Two of the metal halide lampsMuir-Samuelson Natatorium involves 80,400W halide lamps in high-bay industrialpendants with glass coverings (Figure 5).They are suspended over the pool surfacewhich makes maintenance and cleaningdifficult. The lights provide 40 foot candles(fc) of light at the water’s edge and 70 fc in the center of the pool for an average of 55 fc.The optimal amount of lighting for competitive swimming is 50 fc (Naomi Miller).Measurements done by an outside lighting consultant found the annual energydemands of the existing lighting system to be 158,828.8 kWh and at an annual cost of 20,647.74 (assuming energy costs at 0.13 per kWh) (Appendix, Table 2). Separately,facilities estimated lighting energy usage in the summer of 2008 and found that the poolused 29,760 kWh of electricity for three months (Appendix, Table 1).Pool usageAs mentioned earlier, the pool is kept open for approximately 49-50 weeks of theyear. The pool is open for public use from 7-9am, 12-2pm, and 7-9pm, Monday through
5Friday, 10am-4pm Saturday, and 1-6pm on Sunday. The varsity swim team uses the poolfacility for practices between 2-6pm Monday through Friday from November to March.Once or twice in November and December and almost every Saturday in January the poolis used nearly all day (10am-7pm) for competitive swim meets. Overall, the pool is openfor approximately 10 hours every day during the Fall, Winter, and Spring. In the past, thepool has remained open in the summer, Monday to Friday between 12-6 pm.Pool usage patterns are tracked by having patrons sign-in on pen and paper withthe pool monitor upon entering the pool deck. The keeping and maintenance of theseprocedures is poorly tracked. Official pool sign-in sheets are not always used, indicationof shift is not always recorded, and formal tallies of each shift and day are not made.Overall analysis of pool usage data for a month demonstrates that the pool is used mostheavily during the week (Monday to Friday) and most patrons swim during the afternoonshift between 12-2 pm (Table 1).Table 1: Muir-Samuelson Pool Usage Tracking. Information compiled from binder thatholds most recent patron sign-ins. Average patrons per hour for all shifts is divided by 6hours of pool operation per day.ShiftAverage # patrons Patrons per hour7-9 am16.08.012-2 pm19.79.97-9 pm11.35.6Saturday (10-4) 22.53.8Sunday (1-6)21.54.3All Shifts45.17.52The pool is used more intensively during the winter months particularlyNovember through early March because the varsity swim team holds practices for 4hours of the day. During those hours, the pool is closed to other patrons and the 62members of the swim team attend one of the two-hour practice times available to them
6(2:15-4:15 pm or 4:15-6:15). Practice is mandatory and swimmers do not sign in whenusing the pool. Also, when the pool is used for competitive swimming meets inDecember and January, nearly 100 swimmers, officials, coaches, and divers may bepresent on the pool deck for up to 7 hours of the day (estimating warm up times, meet,cool down and clean up).In summary, the pool seems to have the most traffic during the week, particularlyover lunch hours. Seasonally, the pool is used more in the winter months. However, thedata collected may not represent an accurate sample of pool use because records are notkept and maintained in a complete and orderly fashion.Changing for the betterSolar hot waterHeating the Muir-Samuelson Pool with a renewable energy source such as solarthermal would decrease college energy usage, energy costs, and college greenhouse gasemissions. However, we first have to examine the efficiency of such an option as well asthe feasibility of installing the equipment necessary to provide enough heat to maintainpool water temperature. I will first explore the different types of solar thermal, what typebest fits the Muir-Samuelson pool,estimate the effectiveness and issues ofthe chosen system.Solar hot water systems have twoforms: flat-plate collectors andevacuated-tube collectors. Typically, flatplate collectors are used for heatingFigure 6: Glazed flat-plate solar collectordiagram from RETScreen International
7swimming pools (“Energy Savers: Solar Hot Water Heaters,” Figure 6). Local solarenergy contractor J. Craig Robertson explained that this is because the temperature of thewater heated by the flat plate collector relative to the ambient air will remain relativelysimilar which means that flat-plate collectors are more efficiently matched for a pool.The flat-plate systems are usually 30% efficient while the evacuated-tube is 80% efficientbecause they are better insulated (GEOS 206). However, the flat-plates are also lessexpensive at 1125 per panel versus 4500 per evacuated-tube panel (Robertson).Because Williamstown experiences temperatures below freezing in the winter, asolar hot water collector would need to have a closed loop circulation system thatcontained anti-freeze to allow the collectors to be available for water heating throughoutthe year (Robertson). In order to extract heat from the collectors in this system, we needa heat exchanger to transfer the heat from the solar collector anti-freeze solution to thewater meant to enter and heat the pool. This is called a liquid-liquid heat exchanger(“Energy Savers: Solar Hot Water Heaters”). Craig Robertson recommends a platesystem where the heated anti-freeze solution and the water to be heated for the pool areseparated by a stainless steel plate. The two solutions flow counter-currently and transferof heat occurs across the plate. This is called a tube-in-tube heat transfer design (“EnergySavers: Solar Hot Water Heaters”).The company RETScreen has designed a computer model that estimates thefeasibility and energy savings of various clean energy technologies including solar hotwater. I used their program to assess the benefits of solar hot water for the WilliamsCollege pool facility (Appendix, Table 4). This model provides for the followingassumptions: a pool cover is used 10 hours every day, the pool loses 5% water volume
8per week, 400 Stiebel Eltron SOL 25 solar panels are installed at a 45 degree angle, aheat exchanger to transfer heat from the solar collectors runs at 90% efficiency, #6 oil isused year round and costs 1.80 per gallon (the steam heating system), and the collegereceives a rebate of 30% of the project costs to install this system. Certain financialparameters were also assumed (see Appendix, Table 4). In the proposed scenario, thepanels will cost 546,000 and the college will incur cost and debt payments of 12,928 ayear and save 78,897 dollars a year. Given this situation the payback period for thepanels would be 5.8 years (Appendix, Table 4).However, we must remember that the assumptions made using the RETScreenmodel do not always hold true and there are limitations to the model itself. For example,Figure 7: Diagram of energy gains and losses from RETScreen International
9their model calculates pool energy requirements using their own formula based on poolsurface area. I assume that they account for the factors of energy loss that they outline intheir chapter describing solar heating shown above (Figure 7). Their model also does notfactor in outside costs for panel installation and other costs for changing pool heatinginfrastructure (pipes, pumps, exchangers, etc.). Also, the RETScreen model seems to bedesigned to evaluate solar hot water systems for smaller indoor pools than the MuirSamuelson Natatorium. Example projects shown by the program include pools that rangefrom 200-350 sq. m. in surface area while Williams’ pool has a surface area of 966 sq. m(RETScreen Software). Those factors aside, this model nicely displays the benefits ofusing solar hot water to heat the pool. However, the data must be given furtherevaluation by an engineer who would specifically analyze the Muir-Samuelson pool ifsuch a project went forward.An issue that may arise with solar water heating is what to do when there is anexcess of hot water. A direct system like I have discussed thus far would transfer all hotwater from the collectors to the pool which, given a hot summer day, could heat the poolwell above the target 80 to 82 degrees Fahrenheit. In this scenario, the collectors couldbe built so that they never completely provide enough hot water to heat the pool bythemselves but would require some input from an outside boiler or the present Dry-OTron system now in place to fulfill pool energy needs. Or, the excess hot water could besiphoned away to a water tank that could be used for heating water for locker roomshowers and sinks. Such a system would require a hot water tank and the installation of amore extensive piping system as well as a mechanism with which to control where thehot water is going for a particular day (Robertson).
10So, assuming Williams employs the use of flat-plate collectors and heat exchangesystem I attempted to estimate how much excess energy may be produced by the solarcollectors at peak production. This would most likely occur on a sunny and clear summerday. Assuming the panels will produce the C ratings from the Stiebel Eltron Rating Chart(Table 2), on a clear day, one panel will produce 30,000 btu per day. Also, assuming that400 panels are installed, this system will produce 12 million btu per day. The estimatedenergy demand to heat the pool per day can be derived from estimates from facilitiescalculations of Dry-O-Tron usage (Appendix, Table 1) or the model using oil #6 from theRETScreen program (Appendix, Table 4).Table 2: Stiebel Eltron Sol 25 Plus, Glazed Flat-Plate Solar Collector ThermalPerformance Rating ChartThousands of Btu Per Panel Per DayCategory (Ti-Ta)Clear Day, 2000Mildly Cloudy,Cloudy Day, 100022Btu/ft d1500 Btu/ft dBtu/ft2 d392920A (-9 F)352616B (9 F)302112C (36 F)20113D (90 F)103E (144 F)A-Pool Heating (Warm Climate) B-Pool Heating (Cool Climate) C-Water Heating (Warm Climate) DWater Heating (Cool Climate) E-Air ConditioningThe numbers from facilities estimate that on a summer day the pool would require2.87 MMbtu per day to heat the pool water. The RETScreen model estimates that theaverage energy demand for pool heating over the course of the year for #6 oil will be18.01 MMbtu (Table 3). The facilities estimate suggests there will be excess energy on apeak production day. The RETScreen model suggests there will not be excess energy.However this estimate is based on data over the course of an entire year whereas thefacilities Dry-O-Tron estimate focuses solely on summer usage—the same time when
11peak energy production should occur. We must accept that there are limitations anderrors within both of these estimates however it seems safe to assume that when thepanels are at peak production, excess energy would be available.Table 3: Calculations for daily energy requirements for heating the Muir-Samuelson using datafrom RETScreen model (Oil #6) and Williams Facilities’ estimation (Dry-O-Tron)Oil #6Dry-O-Trons43,831.90gallons/year35kw150,000btu per gallon 840kw/day6,574,785,000 btu/year3,412.3btu per kw6,574.79MMbtu/year2,866,332 btu/day18.01MMbtu/day2.87MMbtu/dayDuring the summer months when the panels would be at peak production, naturalgas provides the energy to heat water for showers and domestic uses in ChandlerGymnasium and the pool. Average summer natural gas usage for Chandler Gymnasiumfrom May to September 2008 was 400 CCFs or 40 MMbtu (Table 4, Figure 8).Assuming, facilities’ estimate of 2.67 MMbtu to heat the pool is correct the excess 10MMbtu generated by the solar collectors on a peak production day could be used toreduce the amount of naturalgas required to heat water fordomestic uses.Table 4: Natural Gas use of ChandlerGymnasium Complex for Summer 2008(Sustainability at Williams)MonthNatural igure 8: Natural Gas use of Chandler GymnasiumComplex for Summer 2008 (Sustainability at Williams)
12If natural gas prices are 1.25 per CCF, then it currently costs 500 per month for naturalgas at Chandler Gymnasium. Assuming all that gas goes toward heating shower water(some gas is also used for dryers), using the solar panels on a peak production day wouldsave 125 because the showers would require 300 CCF instead of 400 CCF.Pool coverA pool cover is a simple and relatively inexpensive addition to a pool that canreduce evaporative losses from the pool and thus lower dehumidification and ventilationneeds when the pool is not in use. The Muir-Samuelson pool would require a large coverto span its 10,400 sq. ft. surface. The Sebesta-Blomberg energy report from 2008recommends the addition of a self-winding and potentially automated pool cover systemfor the pool in order to minimize the effort required by pool staff and maintenance.However, an automatic retrieval system may require extensive installation and newinfrastructure on the pool deck (Sebesta-Blomberg).The report says that a pool cover may reduce space moisture loading and heatingrequirements when the pool is closed to the extent that HVAC and heating systems wouldnot be required during off-hour periods (Sebesta-Blomberg). The recent report estimatedthat a pool cover would cost 96,000 to implement and save 156,100 kWh of electricityand 430 Mlb of CHP steam. The plans would avoid costs of 26,000 annually and 100metric tons of CO2 emissions per year. The estimated payback period is 3.7 years (Table4).Ventilation optionsThe current Dry-O-Tron dehumidification system used at the Muir-Samuelsonpool is in poor condition due to the corrosive nature of their application (Clark). Because
13the system is in bad condition it may not effectively or efficiently dehumidify, heat, orventilate the pool. The Sebesta Blomberg energy recommendation report addresses thisissue with two potential options for improvement.Table 4: Sebesta-Blomberg Report on Energy Savings and Paybacks for PoolCover and Dehumidification OptionsECM DescriptionImplementationCostAdd Pool Cover 96,000Pool Dehumidification 424,000OptionsAnnualElectricitySavings(kWh)Annual 56,100347,900430(530)3.78.4 26,000 n one involves using only outdoor air exchange for ventilation and installingequipment with air-to-air heat recovery where the Dry-O-Trons are currently located.This project would require a larger outside air duct and pool heating would be providedby a new boiler to be used in the summer (when steam from the Cogen plant is notavailable) and/or a solar collector system as previously discussed. Option two replacesthe old dehumidification units with new desiccant-based units. They would useregeneration heat from a new summer boiler and/or solar collection (Sebesta-Blomberg).The Sebesta Blomberg report estimates the implementation cost of a newventilation system at the pool to be 424,000. The new system would save 347,900 kWhof electricity and potentially 530 Mlb of steam depending on which option isimplemented (a new boiler would not save steam). The annual cost avoidance of a newventilation system would be 38,000 and the payback period would be 8.4 years (Table4).Lighting improvements
14Presently, Williams has been working with Naomi Miller Lighting Design, LLCto get recommendations and estimates for new lighting systems for several athleticfacilities including the Muir-Samuelson natatorium. For the pool, they haverecommended GLA series architectural lighting, specifically fixtures F5 and F6 (Figure9). These lights would be mounted end to end around the perimeter of the pool deck sothey could be easily accessible for maintenance. Each fixture contains six lamps so thelights can be turned on to provide full, 2/3, or 1/3 output. Different output levels could beFigure 9: Proposed lighting system recommended by Naomi Miller Lighting Designs, LLCutilized for different pool activities. For example, competitive swim meets would requirefull output but for open swim, PE, and swim practices, lighting could be reduced to 2/3output at considerable cost and energy savings (Naomi Miller).The lighting recommendations suggested by Naomi Miller Lighting Designs, LLCwould save energy and lighting costs. Total annual energy use with the proposed systemwould be 111,773.38 kWh, opposed to the current system which uses 158,828.80 kWhannually. Annual energy cost would be 14,530.54, saving the college 6,117.21 everyyear compared to the present system. Total equipment cost (not including labor) to
15install the proposed lighting system would be 36,340.00. The payback period of thenew lighting system would be 5.9 years (Appendix, Table 2).Tracking pool usage and scheduleMy intention in analyzing the intensity of pool usage was to makerecommendations about when and how often the pool should be open. However, it maybe best to first invest in an orderly and systematic way of documenting and saving poolusage information. Such a change would not be expensive but would require thecoordination and cooperation of pool monitors to create consistency in the record keepingprocess for patron sign-in. Perhaps, patrons could be signed in using a simple Excelspreadsheet on a computer however this would involve a computer and consistency withdata entry. Once a better system for tracking pool usage is in place, this data could beused to adjust pool hours to better serve patrons and help decrease energy costs incurredby pool operation.Conclusions and proposal for changeThere are various ways that Williams College can improve how efficiently theMuir-Samuelson Pool runs. However, the feasibility and practicality of these optionsmust be assessed before diving into new projects. I recommend that the Collegeapproach the possible improvements in this order: improve the tracking of pool usage,install a pool cover, upgrade the lighting system, and then improve or replace the currentheating system with solar hot water.Creating an organized pool sign-in procedure would help facilities and poolmanagement understand when the pool is used most intensively so they can adjust poolhours to meet the needs of their patients in an efficient manner. This project would
16require the least time and resources to implement but would require the cooperation ofpool staff.Installing a pool cover would provide benefits for the pool that may help alleviatethe energetic stress put in place by the current heating and ventilation system. The poolcover also had a relatively quick payback period at 3.7 years (Sebesta-Blomberg).However, pool staff must be charged with covering and uncovering the pool manuallyunless a more complex automated system is installed. Another option would be to coverthe pool during winter and spring breaks—approximately three weeks of the year.An upgraded light system would lower energy usage and cost as well as facilitatemaintenance operations required as the new lighting system would be located around theperimeter of the pool deck rather than suspended above the pool. Better quality light isalso an improvement that patrons can noticeably enjoy and reap the benefits of a well-litand energy efficient environment.I recommend solar hot water last because it is a project that requires much moreplanning and involvement that all the others. However, it is a well matched system forheating the pool water and probably the best renewable energy option in terms of energyuse and GHG reduction to be used for the pool facility. To further understand theapplication of solar heating at the Muir-Samuelson Natatorium a consultant should behired to assess the feasibility of a solar heating system considering the pool design andcurrent heating infrastructure.As these projects are implemented and improvements in energy usage occurWilliams could become a leader in green and sustainable initiatives in athletic facilities. Ibelieve that these recommendations should be seriously considered as a means of
17decreasing campus emissions and energy costs. Such changes can have positive effects atmany scales and Williams College and the Williamstown community is a great place tostart.Figure 10: View of the Muir-Samuelson Natatorium from the north side, in the spectator galleryAcknowledgementsThanks to Don Clark and Craig Robertson for providing information on the pooland solar hot water systems. Also, I would like to thank Stephanie Boyd and Amy Johnsfor working with me through all the information and data we collected on the pool andvarious pool systems to present some great recommendations for improving the Williamscampus energy use.
18ReferencesBoyd, Stephanie. Director of the Zilkha Center for Environmental Initiatives, Meetingsand Interviews.Clark, Donald. Williams College Utilities Program Manager, Interview and PoolViewing, Appendix, Table 1: Facilities Report on Swimming Pool Energy UseOver Three Months"Energy Savers: Solar Water Heaters." EERE: Energy Savers Home Page. 24 Mar. 2009.US Department of Energy. 06 May 2009 http://www.energysavers.gov/your home/water heating/index.cfm/mytopic 12850 .Facilities Website, http://www.williams.edu/admin/facilities/GEOS 206 Lecture Notes, Solar EnergyNaomi Miller Lighting Design, LLC. Pricing, Energy, and Savings Report, Figure 1RETScreen International Clean Energy Project Analysis: Solar Water Heating ProjectAnalysis Chapter. 2001-2004.RETScreen International Software for Clean Energy Project Analysis. Natural ResourcesCanada http://www.nrcan.gc.ca .Robertson, J. Craig. Solar Energy Contractor/Specialist, Interview, Stiebel Eltron SolarRating Chart, Flat-plate collectorSebesta Blomberg Report, February 2008 pp. 7, 86-87.Sustainability at Williams. http://www.williams.edu/resources/sustainability .
19Appendix:Table 1: Facilities Report on Swimming Pool Energy Use Over Three MonthsUtility CostElectricityAHUsLightsDry-O-TronsPool PumpsTotalFor 3 MonthsHrs reduced 76013,02013,392123,132air handlinglightsheating10 hrs per daysteam in winterWater and SewerEstimatedShowersShowerpool make up incl backwashTotalRatesElec/KWHW S/CCFWater and Sewer4650Gallon/Shower10Gallons46,50015,000Total Cost 0.12 9.14 14,775.84 751.48CCF - cubicfeet62.220.182.2need to check this withBea
Table 2: LT4 - Chandler Pool17,200Existing System(full)(half)50 fc25 fcExistingExistingUIlluminances: Target 50fcLuminaire Data80401) Number of luminaires400WMH400WMH2) Lamp type113) Lamps per system/luminaire4604604) System wattage20,00020,0005) Lamp life, hours36.8018.406) Total kW in lighting2.141.077) Power density by type, (w/ft2)2.141.078) Power density by control groupAnnual Energy Use78101) Weekly operating hours50502) Number of weeks per year149,260.809,568.003) Annual kWh use by fixture type4) Annual kWh use by control158,828.80group158,828.805) Total annual kWh useAnnual Energy Cost 0.13 0.131) Energy cost per kWh 19,403.90 1,243.842) Cost by fixture type 19,403.90 1,243.843) Cost by control group 20,647.744) Total annual energy costReturn on Investment1) Equipment cost per fixture2) Equipment cost by fixture type3) Total equipment cost4) Energy cost savings per year5) Payback period of new vs existing system, yearsUProposed SystemIntramural (2/3)34 fcF5F6Varsity (full)52 fcF5F61654W T5HO1270825,00011.330.661.892054W T5HO18106225,00021.241.23325018,849.79162054W T5HO54W 35,343.3654,193.15Cleaning (1/3)17 fc20F5F6465018,064.38162054W T5HO54W 1,773.38 0.13 0.13 2,450.47 4,594.64 7,045.11 790.00 12,640.00 36,340.00 6,117.215.9 0.13 0.13 2,348.37 4,403.19 6,751.56 14,530.54 0.13 0.13 255.26 478.61 733.87 1,185.00 23,700.00Report provided by Naomi Miller Lighting Designs, LLC. Hour assumptions based on estimate of 88 hours per week, which includes 32hours per week of varsity meets and practices, 46 hours per week of PE, intramural, and open swim with 10 hours of maintenance.Assumptions do not include savings from partial switching or maintenance savings.
21Table 3: Performance Rating Sheet for Stiebel Eltron Sol 25 Plus, Glazed Flat-Plate Solar Collector System
22Table 4: RETScreen Energy Model - Heating projectHeating projectTechnologyLoad characteristicsApplicationSolar water heaterSwimming poolHot waterBase caseIndoor966.00.027.05%UnitTypeAreaCover useTemperatureMakeup waterPercent of month usedSupply temperature methodWater temperature - minimumWater temperature - maximumHeatingResource assessmentSolar tracking modeSlopeAzimuthSolar water heaterTypeManufacturerModelGross area per solar collectorAperture area per solar collectorFr (tau alpha) coefficientFr UL coefficientTemperature coefficient for Fr ULNumber of collectorsSolar collector areaCapacitym²h/d C%/wProposed case966.010.027.05%Month C CFormula3.613.3UnitMWhBase case1,587.1 Fixed45.00.0m²m²(W/m²)/ C(W/m²)/ C²m²kWProposed case992.5GlazedStiebel EltronSOL 25 Plus2.732.480.723.964001093.20694.40Energy saved37%Incremental initialcosts 342546,600
23Miscellaneous losses%4.0%yes/no%%W/m² /kWhYes90.0%3.0%10.000.100MWhMWh%26.5785.879%gal /gal Base caseOil (#6) - gal85%43,831.91.80078,897Table 4 continued:Balance of system & miscellaneousHeat exchangerHeat exchanger efficiencyMiscellaneous lossesPump power / solar collector areaElectricity rateSummaryElectricity - pumpHeating deliveredSolar fractionHeating systemProject verificationFuel typeSeasonal efficiencyFuel consumption - annualFuel rateFuel costProposed caseOil (#6) - gal85%5,707.91.80010,274Financial AnalysisFinancial parametersInflation rateProject lifeDebt ratioInitial costsHeating systemOtherTotal initial costsIncentives and grantsAnnual costs and debt paymentsO&M (savings) costsFuel cost - proposed caseOther%yr%2.0%200% 546,600 546,600163,98012,928100.0%0.0%100.0%30.0%Energy savedgal /gal
24 12,928Annual savings and incomeFuel cost - base caseOtherTotal annual savings and income 78,897Financial v
d dehumidified by Dry-O-Trons (Figure 4). This system reclaims water and heat from the air and returns it to the pool. Supply and return ventilation at the pool cycle air through the Dry-O-Tron system and the re released as exhaust (Figure 2, Figure 3). The air is compressed and heated as it flows through the Dry-O-Trons.