Transcription
International Journal of Engineering and Techniques - Volume 5 Issue 2, Mar-Apr 2019RESEARCH ARTICLEOPEN ACCESSTemperature Process Monitoring and Control usingLabVIEWP.Thirumurugan1, M.Arshad Alam Mohammed 2, S.Karthikeyan3,D.Marimuthu4, P.S.Vijay51(Asst Professor, Department of Instrumentation and Control engineering,Saranathan College of engineering)2, 3, 4, 5 (UG Students, Department of Instrumentation and Control engineering,Saranathan College of engineering)Saranathan College of engineering)AbstractThis paper represents theLabVIEW based simulation design of Proportional-Integral-Derivative (PID) forTemperature control. It project aims at designing and implements a PID controller for temperature process.Temperature control of a liquid in a heating tank is achieved by a PID controller through switching a heater on andoff.The PID controller gives response outputs which have minimum steady state error so this used in this process.The process block diagram formulated using LabVIEW icons, indicators and controls. This LabVIEW programsaves the user time to identify and understand the operations of the process very easily by viewing the process flow.Keywords-- PID controller, LabVIEW, Temperature control,heating tank.I. INTRODUCTIONTemperature control plays a vital role inheat generation unit of industry. The temperatureprocess enables the continuous process in whichthe change in temperature is adjusted to get desiredtemperature. This can be implemented by usingPID controller and monitoring in front panel ofLabVIEW. This paper described about the real timeimplementation of PID algorithm on temperatureprocess. The real time implementation wassimulated and tested using LabVIEW. This controltechnique has produced good performance and highaccuracy. It gave good response for the tunedvalues of the parameters. [1].This paper represents PID algorithm-basedcontroller for electromagnetic oven for maintainingthe oven temperature. The controller parameters areadjusted and tuned using various tuning methodsand strategies. The controller is designed by theanalysis of all the responses which obtainedthrough the tuning methods. [2]This paperrepresents Fuzzy algorithm-based controller forMultiple Input Single Output of temperatureprocess. The fuzzy knowledge base algorithm isimplemented based on temperature value indicatedby the sensor. This can be monitored usingLabVIEW. [3]This paper described about thetemperature of control used to control theISSN: 2395-1303temperature of a chamber surface, such aconvoluted external surface of a chamber that isused to process a semiconductor substrate. A filmdistributor in the vacuum chamber applies a fluidfilm on to the process chamber surface. Thistemperature control system particularly used forcontrolling the temperature of a semiconductorprocessing apparatus comprising a process chamberhavingexternal surface [4].This paper implies that how to control andmonitor the temperature process in thepetrochemical industries. It starts from storing highamount of chemicals that leads to crack indistillation column, if it is not maintained properlyso it is vital to control the temperature process.Operation split into two parts. One is for sensingthe temperature using temperature sensor and otherone is to control the same using real timecontrolling software. In order to control theprocess, LabVIEW is a controlling software andVirtual Instrumentation are used. The analog outputof the temperature is given to the analog to digitalconverter and it is processed by the central system.[5] Humidity sensing is important in the fields ofenvironmental control, process monitoring and biomedical analysis. Silicon containing microstructured humidity sensor is fabricated at smalldistance above the surface of glass substrate as themovable electrode of a capacitor. Temperaturesensing is done by the thin film platinum resistors.[6]http://www.ijetjournal.orgPage 20
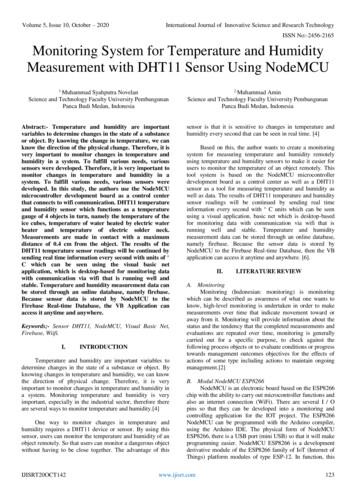
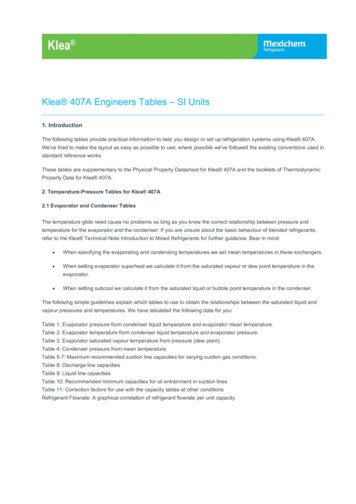
International Journal of Engineering and Techniques - Volume 5 Issue 2, Mar-Apr 2019The main objective is to give a propersimulation model of the temperature control systemand thereby making easier the real implementation.The other objective is it is an automation process itcan be controlled using our PC and Laptops. Theoutput of the process can be stored and it can bereviewed. This program can be easily interfacedwith other real word components for controlling theprocess effectively. [7]II. CONTROLLERFig .1PID block diagramPID controllers have three control modes:1. Proportional Control2. Integral Control3. Derivative ControlEach of the three modes reacts differentlyto the error. The amount of response produced byeach control mode is adjustable by changing thecontroller’s tuning settings. A PID controller is aninstrument or equipment used in industrial controlapplications to regulate temperature, flow, pressure,speed and other few process variables. PID(proportional integral derivative) controllers use acontrol loop feedback mechanism to controlprocess variables and are the most accurate andstable controller.The PID controller gives an outputresponse which have minimum overshoot and lesssteady state error as compared to other controllers.But it has more oscillations it affects the systemstability.The relationship between the input e(t)and output u(t) can be formulated for PIDcontroller in the followingU(t) Kpe(t) KI e(t)dt KDde(t)/dt (1)In Laplace domain, the transfer function isexpressed as follows:C(S) Kp KI/s KD s (2)III. SIMULATION ANDLABVIEWLabVIEW(LaboratoryVirtualEngineering Workbench) is a platform uagefromNationalInstruments.The LabVIEW graphical language isan intuitive way for engineers to develop theirmeasurement and control applications. It is easy tolearn and use, the language also delivers theperformance needed for advanced applications.With LabVIEW, control engineers can usethe same platform to develop and evolve anddesign their controlstrategies across differentapproaches andtechnologies. For PID control,LabVIEW is relatively simple and has controlapplications. For Advanced control design,LabVIEW tools include plant and controllermodelling tools based on control algorithms Input/Output signals. LabVIEW has a continuousdynamic system execution add-on for using thesemodels with traditional control blocks such astransfer functions, integrators, comparators,differentiators, feedback loops and nodes.In the field of Motion control, LabVIEW isused for controlling industrial Machines andsystems requiring machine control. The inherentLabVIEW Input/output capabilities make it anatural tool for acquiring load data to be used fordriving simulations or new prototypes andmechanisms of hardware1.FRONT PANELThe front panel is the user interface of a VI.We build the front panel by using controls andindicators, which are the interactive input andISSN: 2395-1303http://www.ijetjournal.orgPage 21
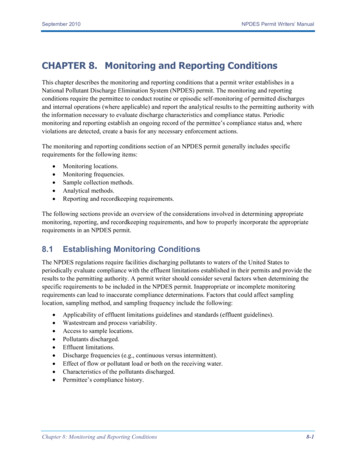
International Journal of Engineering and Techniques - Volume 5 Issue 2, Mar-Apr 2019output terminals of the VI, respectively. Controlsare knobs, push buttons, dials, and other located onthe controls palette.Controlssimulateinstrumentinputmechanisms and supply data to the block diagramof the VI created. Indicators are graphs, LED, andother displays. Indicators simulate instrumentoutput mechanisms display data the block diagramacquires or generates.Fig.3 Block diagram of the simulationFig.2 Front panel of simulationIn Fig 2, the knob is used to set the set pointfor the process. (The set point is the input givendefined as the desired or target value for anessential variable, or process value of a system.)The thermometer indicates the temperature of thewater inside the heating tank. (The change intemperature value represents the process variablechange). The P, I&D values are given to the PIDgain block the response of the process is recordedin the process chart.The output cluster is used todisplay the process variable and the set point given.Stop button is used to terminate the program oftemperature process.2.BLOCK DIAGRAMThe block diagram contains the graphicalrepresentations of functions to control the frontpanel objects.Front panel objects appear as iconterminals on the block. Wires connect controls andindicator to express VIs. This movement of data isknown as data flow programming.In this Fig 3, the setpoint is given to PIDcontroller. The gain values of PID also given toPID controller. The range of the tank is given toPID block. The PID controller is connected to theheater. Therefore bundle block is used to displayset point and process variable value in the processchart. Feedback node is used to compare the actualvalue with setpoint value. Stop button is a booleaninput which is used to stop the program.The timer is used to synchronize theprocess and computer speed for every 100 ms thevalues entered into the process. While loop usedfor accquiring the data simultaneously from theprocess so the continous data viewed in a tank.Setpoint is the actual requirement of the input. PIDgains are used to stay output in the set point. Timeris used for reduce power allocation, frequency andmemory usage. Feedback used to transfer theoutput to the original process variable. Arraycontainthe lower and upper limit of thetemperatures. In this VI, it contains 0oC as thelower temperaturerangeand 80oC as themaximum temperature range. The waveform chartrepresents the output response of the process byusing the PID gain values. Since the program hasno complexity, the general architecture ofLabVIEW is used.IV. MATHEMATICALMODELLINGThe experimental determination of thedynamic and static behaviour of the process iscalled system identification.System identificationcan be done mainly in two ways one is themathematical modelling and the other is theISSN: 2395-1303http://www.ijetjournal.orgPage 22
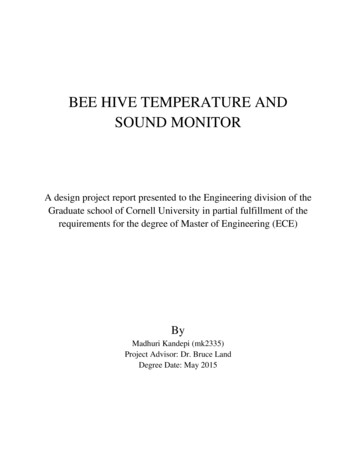
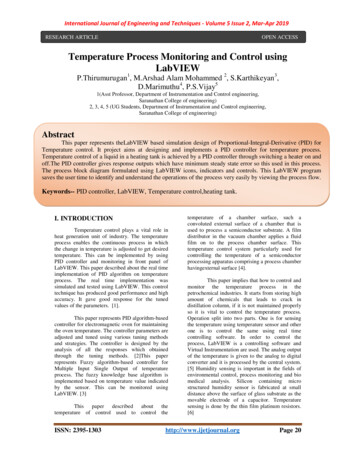
International Journal of Engineering and Techniques - Volume 5 Issue 2, Mar-Apr 2019empirical modelling.the mathematical modellingequations relating the input and the output formed.Empirical methods use data gathered fromexperimentalsetuptodefinethemathematicalmodel of a system.In this paper,empirical method used for the temperature process.The transfer function for the process model isobtained from step response. Step data implies thatthe process is manual mode and initially at steadystate. The transfer functions of the process modelsare required only for the simulation studies of thecontroller design.in this paper, we are commonlyused model to describe the dynamics of theindustrial temperature process is general first orderplus time delay process (FOPTD) and the FOPTDmodel structure is given asG(S ) Ke ( tds )Ts 1VI. SCHEMATIC DIAGRAM (3)Where, td- Time delay,k-process gain.Mathematical modelling can be used tounderstand the process, to optimize process designand hence operating conditions, to design controlstrategies for the process,to train operatingpersonel, model based action andhelps inachieving uniformitivity and in the disturbancerejection of all which translate into a better processeconomics.V. CONTROLLER TUNINGThe Controller can be tuned to get theoptimum values for P, I and D. The generalapproaches for tuning have some criteria like onequarter decay ratio, minimum settling time,minimum overshoot error and so on. The mostpopular method for empirical tuning is calledProcess Reaction Curve, developed by Cohen andCoon. From process reaction curve, the varioustuning method such as Cohen and Coon, Zieglerand Nicholas Method are used to find optimumvalue of parameters like P, I and D.ISSN: 2395-1303Fig.4Schematic diagramThis Fig 4 represents the generalschematic diagram of the temperature controlsystem. The water at ground level sump is pumpedto top level reservoir. The electrical pump isenergized with AC supply of 230volt and 50Hertzfrequency. The liquid flow to the heating tank isregulated by a rotameter in terms of litres per hour(LPH). The input water supply tothe process tank isregulate by a gate valve. The temerature of theprocess liquid is increased by a heater coil which isregulated and controlled by solid state relay whichmay act as final control element. The temperaturemay be acquied using a sensor like RTD orthermistor through a data acquision module (DAQ).The controller actuates the relay so as to maitainthe setpoint and overshoot.VII.RESULT AND DISCUSSIONSimulation for temperature control system forthe liquid in the tank is performed by using PIDcontroller in LabVIEW is given below.http://www.ijetjournal.orgPage 23
International Journal of Engineering and Techniques - Volume 5 Issue 2, Mar-Apr 2019VIII. CONCLUSIONThe main drawback is to control thetemperature process effectively. Since thetemperature process is highly non-linear, it is verydifficult to maintain the set point of the systemwithout any offset. However it can be simulatedeasily using SCADA, NI LabVIEW and MATLAB.Due to its wide range of control abilities, here weuse LabVIEW due to its wide range of controlabilities. Since relay is used as an actuator, theactual response may vary with simulation results.The controller output increases with the processvariable so as to reach. However, different valuesof Proportional-Integral-Derivative controller fromdifferent tuning techniques give better and expectedresponse.REFERENCES[1] Hai-bo LIN, “A Kind of IntelligentTemperature Controller Use PID Algorithm toRealize”, IEEE, 2011.Fig.5Response of the Heating Tank[2] Salim, Sunil Kumar, Jyoti Ohri, “LabVIEWBased DC Motor and Temperature Control UsingPID Controller”, International Journal of AdvancedResearch in Computer Science and SoftwareEngineering, Volume 3, Issue 5, May , “ Fuzzy Based Control Using Lab viewFor Temperature Process”, International Journal ofAdvanced Computer Research, Volume-2 Number4 Issue-6 December-2012.[4] Arnold kohlendko, ke ling lee, maya shendon,efrain qualies, “Temperature control system forsemiconductor process chamber”, united statespatent, 2007.[5] Chia-YenLee Gwo-BinLee, “MEMS-basedHumidity Sensors with Integrated TemperatureSensors for SignalDrift Compensation”, IEEE,2013.Fig.6 Response of Controller OutputThe Fig 5 shows the output response ofthe heater tank and Fig 6 represents the controeroutput. Here we have the setpoint is given as 450C.The actual process take around 60 seconds to reachthe setpoint and stay with the value untill setpointchange or PID value change happened. Here boththe process variable and controller output will besimilar in case of simulation. But in the case of realtime implementation, the controller range andresponse curve varies.ISSN: 2395-1303[6]S Kohout, J Roos and H Keller.“Automatedoperation of ahomemade torque magnetometerusing LabVIEW”.[7] Abhishek Malik and sauvik das gupta“Modelling of mems based temperaturesensortemperature control in a petrochemical industryusing LabVIEW”, International Conference onComputer and Automation Engineering, 2012.[8] B. W. Bequette, “Process Control: Modelling,Design and Simulation”,Prentice Hall, 2003http://www.ijetjournal.orgPage 24
It project aims at designing and implements a PID controller for temperature process. Temperature control of a liquid in a heating tank is achieved by a PID controller through switching a heater on and . Keywords-- PID controller, LabVIEW, Temperature control,heating tank. International Journal of Engineering and Techniques - Volume 5 Issue 2 .