Transcription
American International Journal of Contemporary ResearchVol. 2 No. 12; December 2012The Company's Policy, Firm Performance, and Firm Value: An Empirical Researchon Indonesia Stock ExchangeBambang SudiyatnoLecturerFaculty of EconomicsUniversitas Stikubank SemarangIndonesiaElen PuspitasariLecturerFaculty of EconomicsUniversitas Stikubank SemarangIndonesiaAndi KartikaLecturerFaculty of EconomicsUniversitas Stikubank SemarangIndonesiaAbstractThis study examined the role of company performance in determining the direction of the relationship between thecompany's policies to value the company. The goal is to identify where the role of company performance as avariable that is affected by the company's policies and influence the value of the company. Tests carried out instages to test the effect of the company's policies on corporate performance and corporate value, and examine theeffect of company performance on firm value. The study was conducted in Indonesia Stock Exchange (IDX) witha sample of manufacturing firms listed on the IDX in 2008 to 2010 with the purpose of sampling method.The results showed that financial leverage has a significant negative effect on the significance level of less than1% of the company performance, and a significant positive effect on the level of significance of 5% of the value ofthe company. Incentive managers have a positive effect, but not significant to company performance, and asignificant positive effect on the significance level of less than 1% of the value of the company. Capitalexpenditure has a significant positive effect on the level of significance is less than 1% of the companyperformance, and a negative effect, but no significant effect on firm value. The company's performance haspositive and significant at the significance level of less than 1% of the value of the company.Keywords: Financial Leverage, Manager Incentives, Capital Expenditure, Corporate Policy, CompanyPerformance, and Corporate Value.1. IntroductionThe business world will always require management to be creative in an effort to improve their performance, theyshould have the ability and can take advantage of any opportunities to improve company performance. It isimportant to improve the company performance is to create strategies, techniques and business tools areappropriate and suitable for the company. Accounting statements provide different measurements to measure thefirm performance, such as net income (NI), return on assets (ROA) or return on equity (ROE). The firmperformance as a barometer of the success of the company will be seen as a benchmark for investors to investtheir funds.30
Centre for Promoting Ideas, USAwww.aijcrnet.comHigh the firm performance will push the company's stock market price increases, as investors will respondpositively as a signal to invest funds. As a representation of the firm value, the rising stock market prices show thefirm value is also increasing. Therefore, the firm value are the factors that will determine the firm value throughstock price increases.This study assumes that investors are rational, so it is a fundamental aspect of the assessment (basic valuation)primary. This is because the value of the stock reflects the firm value, not only the intrinsic value of a moment,but more important is the expectation of the company's ability to increase the value of future prosperity. Thisstudy emphasizes the fundamental factors that are often seen as a micro-important factor that determines the priceof the stock.A variety of research in financial management has been widely performed and contributed useful financial theoryto science and management policies, such as the capital structure theory (Modigliani and Miller, 1958 and 1963)and agency theory (Jensen and Meckling, 1976). Theories are built from an empirical research that has been doneto address phenomena that occur and develop in business activities. Company's business activities as an object onwhich to base the problems that arise in business activity, plays a role as the base object of empirical research toproduce theories that are then used as the basic foundation of the business in making decisions for their business.Therefore, the activities within the company which is the implementation of company policies play an importantrole in the survival of the company. The objective of the company's policies are generally aimed at thedevelopment of the company by increasing the firm performance and the firm value.2. Literature ReviewResearch on corporate policies related to capital structure or financial leverage, manager incentives, and capitalexpenditure have been carried out. Aquino, R (2010), in a study conducted on companies listed and not listed onthe Philippine find that financial leverage has positive and significant impact on profitability (ROA). Magpayo,CL (2011), who conducted a study of 1,000 companies in the Philippine in the period in 2009, found that financialleverage has a negative and significant impact on ROA. The results Magpayo, CL (2010) is not in accordancewith the study by Li, Donglin (2004) and Aquino R (2010).Research conducted Anuchitworawong (2000) after the crisis in Thailand, and Guo (2006), found that leveragehas a negative and significant effect on ROA. Rayan, K (2008) found financial leverage has a negative andsignificant effect on firm value. Salehi, M (2009) who conducted research in Iran, also found that financialleverage has a negative impact on corporate performance, ROA (firm performance). While Bhatti, et al (2010),found that high levels of leverage that will create a high systematic risk and high volatility in stock prices.Several previous studies on the relationship between compensation and company performance has been carriedout empirically. Murphy (1985), found that compensation has a positive impact on performance. Kerr and Kren(1992), found that cash compensation had a significant influence on ROA and stock returns. Schulz and Tubbs(2006), found that the Stock Option has a positive and significant impact on ROA.According to Gill, et al (2008), compensation management (CEO compensation) can take the form of cashcompensation, stock compensation, and fringe benefits. Murphy (1998), found a positive relationship betweenperformance of companies with cash compensation manager (CEO cash compensation). Liao, et al (2009) in hisresearch found that there are indications of a positive market reaction to the announcement of stock bonuses.Likewise Eddy Junarsin (2011), found that management compensation has positive and significant impact onROA at significance level of less than 10%.Managerial stock-based incentives believed to be a powerful tool for the shareholders can motivate managers(CEO) to work hard to increase the company's profits in the long run (Giancarlo S, 2000). Share-based incentiveplan is a long-term incentive plan for management (Abowd, JM., and Kaplan, DS (1999). These include sharesgranted to the Manager under the assumption that the manager will be shareholders of the company and will act asshareholders (Gill, et al (2008). Granted stock options to the manager (CEO) as a bonus based on theirperformance and is the largest component of total compensation for managers over the last decade (Gill, et al(2008). According Bebchuck, L (2005), there are indications that equity-based compensation has increasedrapidly in both companies on the economic conditions of the past and present.31
American International Journal of Contemporary ResearchVol. 2 No. 12; December 2012Equity-based compensation can reduce agency problems and agency costs through a direct relationship betweenwelfare management and company performance. Therefore, the award of stock options to motivate managementto take action to improve the company's stock price, which in turn, maximize shareholder value or the value of thecompany.A close relationship between corporate performance and stock compensation has been found (Abowd JM and DSKaplan, 1999). Stock ownership seems likely to act as a substitute for CEO compensation, because it takes lessincentive compensation to maximize the value of the shares (Cordeiro JJ, and Veliyath R, 2003). According toMurphy (1998), stock options also indicate a direct relationship between the award given to the management andthe appreciation of the share price, since the implementation of the option payments increased in line with risingstock prices. Thus, stock option compensation plan for managers can be considered as the best compensation planas this will support the company's long-term performance.Capital expenditure related to investment policy, where the policy is part of the financial policies that havesignificance to make the value of the company increases. This policy is usually done when the company expandedthe business by adding production capacity, modernization or building factories and capital budgeting changes.Woolridge and Snow (1990), has been treated as capital expenditure expansion of production capacity, plantmodernization and changes in capital expenditure as capital expenditure.McConnell and Muscarella (1985) empirical study has been initiated to examine the relationship between capitalexpenditure announcement stock price. They found that the announcement of an increase (decrease) in capitalexpenditure is planned to have a positive (negative) with a significant increase in stock returns. This is notconsistent with the hypothesis that managers act in the best interests of the shareholders, to maximize the marketvalue of their companies through capital expenditure decisions.Several studies related to the market reaction to the announcement of capital expenditure has been carried out,among others, by Woolridge and Snow (1990), Chen and Ho (1997), Chung, et al (1998), Burton's (1999),Brailsford and Yeoh (2004) Chen (2006, 2008), Akbar, et al (2008), and Lynn, et al (2011). The results of thesestudies produced different findings, so it is not consistent, the market reaction varies in response toannouncements of capital expenditure.Woolridge and Snow (1990), found a significant positive abnormal return at the level of 0.71% of the overallinvestment announcement. They are categorized into several types of investment announcements; joint ventures,R & project, diversify markets / products, and capital expenditure. Significant positive market reaction and longterm investments, the investment is more than 3 years. Difference with previous studies, Chen and Ho (1997)examine the market response to announcements of capital expenditure according to two characteristics of thecompany, namely free cash flow and investment opportunities. The results showed only companies that have highinvestment opportunities reacted positively to the announcement of a significant capital expenditure, abnormalreturn of about 1%. Chung, et al (1998), found significant positive returns to firms that q-ratio is high on the dayof the announcement, the abnormal return is less than 1%. The results of Chung, et al (1998) is inconsistent withthe findings of Chen and Ho (1997).Burton's (1999), in particular capital expenditure announcements split into three main categories, such as jointventure, immediate cash-generating expenditures (ICG), and non-immediate cash-generating expenditures(NICG). The results revealed significantly to joint venture investments, but not for immediate cash-generatingexpenditures (ICG), and non-immediate cash-generating expenditures (NICG), abnormal return of 1.5%.Li, Donglin (2004), in his study found that investment (PPE) is positively associated with ROA at a significancelevel of less than 5%. Brailsford and Yeoh (2004), examined the effect of free cash flow and growth opportunitiesin the Australian capital market of 170 capital expenditure announcements. The results are consistent withprevious theory that firms with high growth opportunities will have a higher market reaction following the releaseof capital expenditure announcements. Unlike before, then they do Randomization approach by classifying thecompany announced in a four-cash flow ratio based on the ratio of selected growth opportunities. Their findingssupport the cash flow hypothesis and findings are not consistent with the findings of Chen and Ho (1997) andChung, et al (1998).32
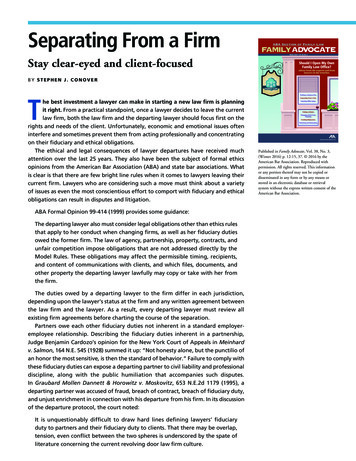
Centre for Promoting Ideas, USAwww.aijcrnet.comAl Farouque, et al (2005), found a statistically investments tend to have a positive, although not significantinfluence on corporate performance (ROA). Chen (2006), conducted research on the stock market response to the246 companies that announced capital investment over the period 1989-1999. The results showed there was asignificant and positive reaction of the stock market after the release of capital investment announcements, theabnormal return of about 1%. In 2008, Chen again test the market reaction to the 794 companies that announcedits new product strategy. In contrast to previous studies, Chen (2008) use industry characteristics and productcharacteristics as control variables. The results are consistent with previous studies that there is a significantpositive reaction of the capital markets on the company that released the announcement of capital investment.Akbar, et al (2008), improving research by observing the UK stock market reaction to capital expenditureannouncements. The results of the study support the findings of McConnell and Muscarella (1985) and Chan, et al(1995) with abnormal return of 0.27% at a significance level of 1%. Announcement of capital expenditure isclassified into four categories which include investment in plant and equipment, development, retail stores andothers. Furthermore, Lynn, et al (2011). conducting research in Malaysian capital market. The results of theresearch showed that the Malaysian stock market reaction to the release of significant positive news capex (capitalexpenditure).The results Carlson and Bathala (1997), Makaryawati (2002), Ulupui (2007), and Bambang Sudiyatno (2010)found that the ROA has positive and significant effect on firm value. While research conducted by Suranta andPratana (2004) found that the ROA has a negative and significant effect on firm value.3. Methodology of ResearchThis research uses an action research method, the first stage of a review of the empirical models that have beendone before. Based on the results of previous studies, and then formulate a model of the influence of thecompany's policy on corporate performance. Then executed implementation (action) hierarchical modeldevelopment by placing the variable connecting of company policy in affecting the value of the company.Variable connecting or interface it is the company's performance, because the performance of the company is theresult of the implementation of company policies, so that these variables can be developed for a dual connectingvariables (intervening).Population and sample in this study is manufacturing companies that have been listed on the Indonesia StockExchange. The sampling method used purposive sampling, using a certain criteria set previously. The data usedare secondary data in the form of time series data and cross section period of 2008 until 2010 were taken from theIndonesia Stock Exchange (IDX) - ICMD 2011. The method of analysis as a test of the hypothesis usingregression analysis with three models regression equation as follows:KinperNilperNilper a11 b11Levkeu b12Inma b13Capex e1 a21 b21Levkeu b22Inma b23Capex e2 a31 b31Kinper e3Where:Kinper Firm PerformanceLevkeu Financial LeverageInma Managerial IncentivesCapex Capital ExpenditureNilper Firm Valuea11, a21 dan a31 Constantab11, b12, b13, b21, b22, b23, b31 Coeffisien of RegresssionFirm performance in this study proxied by the variable Return on Assets (ROA). Company policy proxied byfinancial leverage with the indicator variable The Debt to Total Assets Ratio (DTA), managerial incentives withdummy variables, capital expenditure was measured using indicator variables Property Plant and Equipment(PPE), and firm value proxied by Tobin’s Q.33
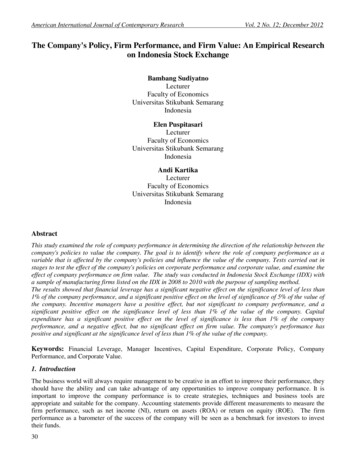
American International Journal of Contemporary ResearchVol. 2 No. 12; December 2012Empirical model of this study are:Independent VariableDependent VariableCorporatePolicy:FirmPerformance: Debt Ratio StockBonus PPE ROAFirmPerformance:Firm Value:Firm Value: Tobin’s Q Tobin’s Q ROA4. Interpretation of Descriptive ResultsDescriptive statistics Table 1 in the appendix shows the 110 companies sampled in accordance with the criteria asthe sample in this study. The mean value of the company amounted to 2.10, with a range of values between theminimum value (0.28) and maximum value (15.00) of 14.72. While the company's performance mean 0.1270,with a range between a minimum value (0.0008) and maximum value (0.4067) of 14.72. This shows that therange of the market capitalization and profits generated by the manufacturing industry companies on the StockExchange is quite high.Skewness value ratio (Zskewness) of the three regression models is less than 2.00, thus, the regression model hasno problem with residual normality, which means the data are normally distributed. Multicollinearity andautocorrelation test results of the three regression models show the model is free from the problemsmulticollinearity and autocorrelation. While heteroscedasticity test, heteroscedasticity occurs in model 2 arelocated in variable incentive manager and model 3 is the variable firm performance (ROA).Correlation test using Pearson's Rank Correlation in Table 2 in the appendix shows that the value of the companyindicated a moderate positive correlation with the performance of the company and has a low positive relationshipwith financial leverage, manager incentives and capital expenditure. While the company's performance indicates amoderate positive correlation with the value of the company and has a low positive relationship with the managerincentives and capital expenditure as well as having a weak negative relationship with financial leverage.Table 3 in the appendix is a summary of the multiple regression analysis. All statistical values VIF model 1,model 2 and model 3 are smaller than 10, so there is no multi-collinearity among the independent variables. Valueof Durbin-Watson Test Statistic located between du and 4-du or greater than 1.5 and less than 3 thus does nothappen auto-correlation in the regression model.The results of testing the model, the ANOVA test (F) and the coefficient of determination indicates that the teststatistic F value is greater than 5 with sig-F or less than 1 percent of ρ (ρ 0.001) for all three regression models.Thus, it means all the independent variables in the model 1, model 2, and model 3 can explain the independentvariable significantly at a significance level of less than 1%. Statistical value indicated coefficient ofdetermination of the magnitude Adj R-square for model 1 is 0.394 or 39.4%, model 2 is equal to 0.175 or 17.5%,and model 3 is equal to 0.663 or 66.3%.In model 1, the value of the beta coefficient is negative financial leverage suggests that the effect of financialleverage on corporate performance is negative or opposite directions.34
Centre for Promoting Ideas, USAwww.aijcrnet.comBeta coefficient of manager incentives and capital expenditure is positive shows that the influence of managerincentives and capital expenditure on corporate performance is positive or unidirectional. In model 2, the value ofthe beta coefficient of financial leverage and incentives manager is positive indicates that the effect of financialleverage and incentive managers on firm value is positive or unidirectional. While the beta coefficient of capitalexpenditure is negative indicates that the effect of capital expenditure on firm value is negative or oppositedirections. In model 3 beta coefficient of performance of the company is positive indicates that the effect of firmperformance on firm value is positive or unidirectional.Based on the above analysis, it can explain the meaning of these statistics and the value of the sign of the beta(βo) of each independent variable on the three models.Model Equation 1The results of statistical tests demonstrate the value of beta coefficient -0.175 and sig-t 0.000 shows thatfinancial leverage has a negative and significant effect on corporate performance (ROA). If the debts of thecompany increases, the performance of the company (ROA) will decline. The decline in Return on Assets (ROA)by increasing debt can occur because the rate of return (ROR) resulting from the additional capital using debt islower than the cost of debt. Thus, the profits resulting from the use of debt will not be able to cover the cost ofcapital.The results of this analysis illustrates that the implementation of the policy is not maximized the use of debtcarried by the company. Management can still improve further the use of debt to be able to generate a returngreater than the cost of capital. The inability of the company to maximize the use of debt due in 2008, theIndonesian economy in crisis as the impact of the financial crisis in the United States. This leads many companiesare declining performance as a result of the crisis.Debt is one of the funding sources that are widely used by companies to strengthen the company's capital in orderto increase their profits. The effectiveness of the use of debt to increase their profits for each company is different,and highly dependent on the ability of management to manage the debt. Ability of management to manage thedebt to increase their profits, describing the quality of governance management. Good corporate governance willbe able to manage the debt to increase their profits (Maher and Andersson, 1999).The results of this study provide empirical understanding of the management, that during the period 2008 to 2010most manufacturing companies on the Stock Exchange has not produced the maximum profit. This means that theresulting rate of return is lower than the cost of capital. If so, then the use of debt or financial leverage willdecrease the performance of the company. So there are still opportunities for management to improve the rate ofreturn from its operations. The results of this study support the argument of the Pecking Order Theory (POT) thatthe use of debt can lower the performance of the company.The results of this study support previous research conducted by Anuchitworawong (2000) at the time after thecrisis in Thailand, and Guo (2006), who find leverage has a negative and significant effect on ROA. Thesimilarity of results is due to the condition of the capital markets in Indonesia, which is not much different fromthe conditions of the capital markets in Thailand and Taiwan, especially after the crisis. These results are also inaccordance with the findings of Salehi, M (2009) who conducted research in Iran, and found that financialleverage has a negative impact on firm performance, ROA.Dividend policy proxied by the manager incentive stock indicators bonuses to managers, with the intention thatmanagement is working to its full potential for the benefit of owners, thus reducing the conflict of interestbetween the manager and the owners. Based on the results of testing the beta coefficients were statistically sig0.014 and t 0.186 indicates that the incentives managers have a positive effect and no significant on the firmperformance.The results of this study provide empirical understanding of the management, that during the period 2008 to 2010,the distribution of bonus shares to the managers at manufacturing companies on the Stock Exchange has noimpact on their performance increases. Effect of bonus shares does not mean (significant) to companyperformance.35
American International Journal of Contemporary ResearchVol. 2 No. 12; December 2012These results are not in accordance with agency theory (Jensen and Meckling 1976) which states that as agents,managers mandated powers to run the company completely. In order for managers to work well, the managers arecompensated in the form of salaries and bonuses beyond salary, such bonus shares.Despite having a positive effect, the results of this study are not in accordance with the findings of Schulz andTubbs (2006) who found that the Stock Option has a positive and significant impact on ROA, and alsoincompatible with the study Guo (2006). These results are statistically also incompatible with Guo (2006) whofound a negative effect of the Stock Bonus ROA.Investment policies are proxied by capital expenditure with an indicator of changes in Plant, Property, andEquipment (PPE). The test results showed statistically significant beta coefficient 0.069 and sig-t 0.006indicates that capital expenditure has a positive and significant impact on firm performance (ROA).The results of this study provide empirical understanding of the management, that during the period 2008 to 2010capital expenditure (capital expenditure) manufacturing companies on the Stock Exchange has a significantimpact on firm performance (ROA). The results were similar also happened in Bangladesh which is a result ofresearch Al Farouque, et al (2005) who found that statistically tend to have a positive investment, although theeffect was not significant on corporate performance (ROA). Thus, the results are consistent with the arguments ofthe theory of investment.Model Equation 2The test results are statistically the value of the beta coefficient is 0.220 and sig-t 0.0053 shows that financialleverage has a positive and significant effect on firm value. The results of this study provide empiricalunderstanding of the management, that during the period 2008 to 2010 manufacturing firms listed on the StockExchange and use debt to enhance shareholder value. The use of debt to be perceived as a positive signal by theperpetrators of the stock market as a mechanism for supervision of the supervisor to management. Moreover, theresults of previous tests showed that the use of debt has not reached the limit, so it still can be improved to meetthe expectations of the shareholders. The use of debt can reduce opportunistic behavior of managers, according tothe argument on free cash flow theory, especially in companies that have high cash flow.The results of this study does not support and do not in accordance with the study of Rayan, K (2008), who foundfinancial leverage has a negative and significant effect on firm value. However, the results of this study supportthe research of Bhatti, et al (2010), who found that high levels of leverage creates market risk (systematic) is high,and cause high volatility in stock prices. The high market risk and stock price volatility of stock returns indicatesincreased as the share price rises, and thus, the value of the company will also rise. The results are consistent withthe trade-off theory or balanching theory which states that before achieving maximum capital structure, the use ofdebt will increase the value of the company.Statistically testing the incentive manager generating value of beta coefficient 0.424 and sig-t 0.000, suggestingthat the incentives managers have a positive and significant effect on firm value. The results of these tests provideempirical understanding of the management, that during the period 2008 to 2010, the stock bonus ever undertakenby manufacturing firms in exchange effect on firm value. Thus, the provision of bonus shares as the informationis positive response by the perpetrators of the stock exchange, so influential directly enhance shareholder value.The results of this study support the statements made by Murphy (1998), ie stock option indicates a direct linkbetween the award given to the management and the appreciation of the share price. This study is also inaccordance with the opinion Bebchuck, L (2005), which states that the award of stock options (stock option) tomotivate management to take action to improve the company's stock price, and maximize shareholder value or thevalue of the company. These results are also consistent with studies of Liao, et al (2009) who found indications ofa positive market reaction to the announcement of stock bonuses.Statistical testing of capital expenditure, resulting beta coefficient -0.118 and sig-t 0.295 indicates that capitalexpenditure has a negative and significant effect on firm value. The results of this study provide empiricalunderstanding of the management, that during the period 2008 to 2010, capital expenditure (capital expenditure)companies listed on the Stock Exchange in general have little effect and tend to be negative on firm value.36
Centre for Promoting Ideas, USAwww.aijcrnet.comManagement policy for the cost of capital as an effort to improve the business has not responded positively bymarket actors. This policy is a long-term policy, so that its impact will be felt in a few years to come. Theperpetrators of the stock is still awaiting the impact of the policy on the company's cash flow.The results of this study are not in accordance with the study of McConnell and Muscarella (1985) who found thatthe announcement of an increase (decrease) in capital budgeting related to positive (negative) with a significantincrease in stock returns. The results are also not consistent with research from Woolridge and Snow (1990), Chenand Ho (1997), Brailsford and Yeoh (2004), Chan, et al (1995), Chen (2006, 2008), Akbar, et al (2008), andLynn, et al (2011). However, the results of the study are consistent with studies of Burton's (1999), immediatecash-generating expenditures (ICG), and non-immediate cash-generating expenditures (NICG).Model Equation 3The results of statistical tests on the performance of companies producing beta coefficient of 0.816 and sig-t 0.000 which shows that corporate performance (ROA) has a positive and significant impact on firm value(Tobin.s Q). The results of this study provide empirical understanding o
This study examined the role of company performance in determining the direction of the relationship between the company's policies to value the company. The goal is to identify where the role of company performance as a variable that is affected by the company's policies and influence the value of the company. Tests carried out in