Transcription
INCLUSION OF TROPICAL STORMSFOR THE COMBINED TOTAL STORM TIDE FREQUENCY RESTUDYFOR SARASOTA COUNTY, FLORIDASponsored byFlorida Department of Environmental Protection,Bureau of Beaches and Coastal SystemsSubmitted byBeaches and Shores Resource CenterInstitute of Science and Public AffairsFlorida State UniversityMay 2011
Table of Contents1.0Background . 12.1Introduction and Data Source . 12.2Storm Frequency and Direction . 12.3Radius to Maximum Winds and Central Pressure Deficit . 22.4Forward Speed . 52.5Track Position . 53.1Simulation of a n-Year Sequence of Storm Associated Storm Tides . 73.2Simulation . 93.3Computation of Return Periods . 104.0 Results . 11REFERENCES . 13APPENDIX A . 14APPENDIX B . 17
List of FiguresFigurePage1Cumulative Probability Distribution of Storm Track Direction, θN2Cumulative Probability Distribution of Radius to Maximum Winds, R, for Landfallingand Exiting Storms33Cumulative Probability Distribution of Radius to Maximum Winds, R, for AlongshoreStorms34Cumulative Probability Distribution of Central Pressure Deficit, p for Landfalling andAlongshore Storms45Cumulative Probability Distribution of Central Pressure Deficit, p for Exiting Storms6Cumulative Probability Distribution of Storm Translation Speed, VF57Cumulative Probability Distribution of Landfalling Distance, YF, for LandfallingAnd Exiting Storms6Cumulative Probability Distribution of Offshore Distance, XL, for AlongshoreStorms69Flow Chart for Two-Dimensional Storm Tide Simulations810Combined Total Storm Tide Elevation Versus Return Period for Study Area1182
List of TablesTableIPageCombined Total Storm Tide Values for Various Return Periods12
1.0BackgroundIn accordance with the objectives and rationale of the Florida Coastal Construction ControlLine, the establishment of the line is based on the damage potential of 100 year return periodhurricanes. A report entitled “Combined Total Storm Tide Frequency for Sarasota County, Florida”(Reference (1)) was submitted to FDEP in October, 1988. This study is requested by the FDEP toinclude the most updated tropical storms and hurricanes in the storm surge simulations. Since themethodology and procedures used for this study are the same as for the report mentioned above,only the storm statistics and the results are presented in this report.2.1Introduction and Data SourceThe statistical parameters are based on historical storm data as presented in References (2)and (3). In brief, the empirical cumulative probability distributions are plotted for each of theparameters of interest and are then approximated by a series of straight line segments for computerapplication. All of the parameters are considered to be independent. The following subsectionsdescribe the statistical characteristics of the individual parameters of interest.2.2Storm Frequency and DirectionThe storms causing appreciable storm tides in the vicinity of the Sarasota County shoreline areclassified as "landfalling", “exiting” or "alongshore" storms. Reasonably good data are availabledescribing the characteristics of the storms impacting the area from 1900 to 2009. For purposes ofthis report, the data contained in References (2) and (3) that fall within a 300 n. mi. segment of thecoast comprising the study area are used. The storm direction is defined here as the azimuth fromwhich the storm is translating at the time of landfall, or, if an alongshore storm, when in closeproximity to the site.For purposes of this study, landfalling and exiting storms are considered to be of possiblesignificance if they made landfall within a 300 n. mi. segment of the coast comprising the studyarea. This segment is extended 150 n. mi. north and 150 n. mi. south from the midpoint of theSarasota County shoreline. Accordingly, there were 53 landfalling, 20 exiting and 9 alongshorestorms occurring in the years 1900 through 2009. The table in Appendix A lists the storms used inthis study.1
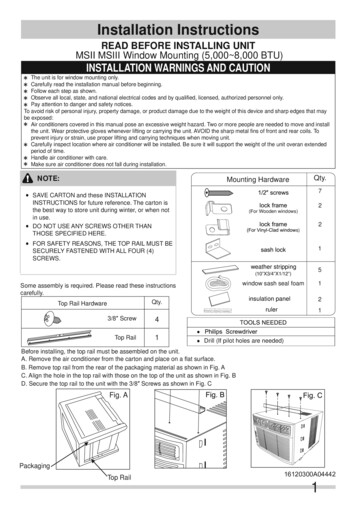
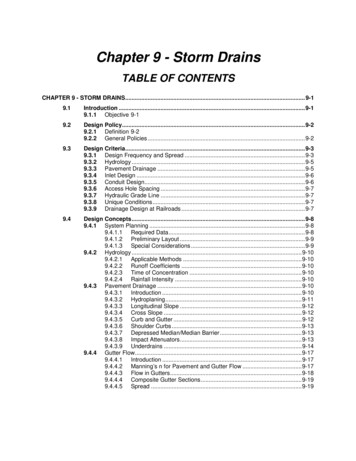
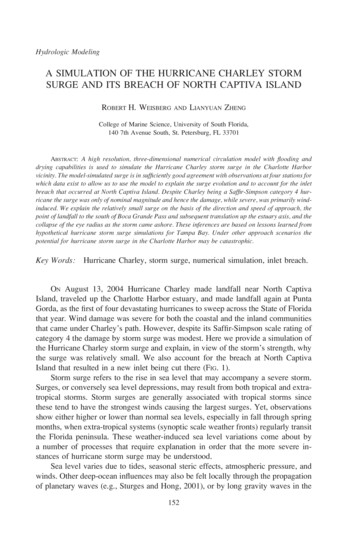
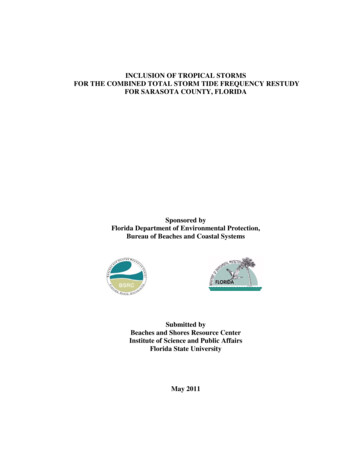
Based on historical data, it is expected that within a 1,000 year period a total of 745 stormswill occur within the 300 n. mi. segment of the coast comprising the study area. Of the 745 storms,481 will be landfalling, 182 exiting and 82 alongshore storms.For purposes of computer use, the cumulative probability distribution of storm track direction(θN) is presented in Figure 1.SARASOTA COUNTYAlongshoreP(θN), Probability that track direction is less than 195,0.38)(171.5,0.35)0.25(131.5,0.24)(102, 0.11)(10, 0.0)(60,0.012)00306090120150180210240270300θN (Direction from which Storm Originates )Figure 1 Cumulative Probability Distribution of Storm Track Direction, θN2.3Radius to Maximum Winds and Central Pressure DeficitThe cumulative probability distribution of radius to maximum winds for landfalling andexiting storms is presented in Figures 2. Figure 3 presents the same for alongshore storms. Thecumulative probability distributions of pressure deficit for landfalling and alongshore storms ispresented in Figure 4. Figure 5 presents the same for exiting storms.2
SARASOTA COUNTY - Landfalling / Exiting(45, 1.00)Probability that Radius to Maximum Winds isless than R1.000.75(20,0.6)0.500.25(15,0.24)(5, 0.0)0.005101520253035Radius to Maximum Winds, R (n.mi.)4045Figure 2 Cumulative Probability Distribution of Radius to the Maximum Wind, R,for Landfalling and Exiting StormsSARASOTA COUNTY - Alongshore(25, 1.00)Probability that Radius to Maximum Winds isless than R1.000.750.500.25(10, 0.00)0.002025Radius to Maximum Winds, R (n.mi.)Figure 3 Cumulative Probability Distribution of Radius to the Maximum Wind, R,for Alongshore Storms3
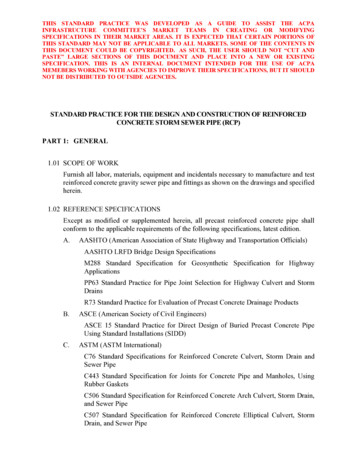
P( p), Probability that Central Pressure Deficit is Greaterthan pSARASOTA COUNTY Landfalling / .50.25(-0.1, 0.0)00-0.3-0.6-0.9-1.2-1.5Central Pressure Deficit, p (in. Hg.)-1.8-2.1Figure 4 Cumulative Probability Distribution of Central Pressure Deficit, p forLandfalling and Alongshore stormsP( p), Probability that Central Pressure Deficit is Greaterthan pSARASOTA COUNTY - Exiting(-1.9,1.00)1(-1.4,0.79)(-1.8, 0.85)0.750.5(-0.37, 0.4)0.25(-0.1, 0.0)00-0.4-0.8-1.2-1.6Central Pressure Deficit, p (in. Hg.)-2Figure 5 Cumulative Probability Distribution of Central Pressure Deficit, pfor Exiting storms4
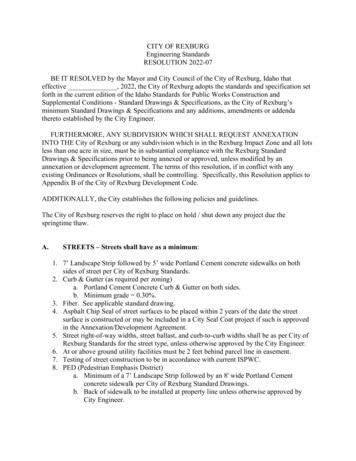
2.4Forward SpeedThe cumulative probability distribution of the forward speed of translation for landfalling,exiting and alongshore storms is presented in Figure 6.P(VF), Probability that Storm Translation Speed is lessthan VFSARASOTA COUNTY( 34,1.00)1.00(21.2, 0.89)0.75(12, 0.51)0.500.25(6.8, 0.06)(2, 0.0)0.002610141822263034Storm Translation Speed, VF (knots)Figure 6 Cumulative Probability Distribution of Translation Speed , VF2.5Track PositionFor the landfalling and exiting storms, the track position is determined by the y coordinate, YF,representing the landfalling or exiting point.Figure 7 presents the cumulative probabilitydistribution for the actual landfalling and exiting position, YF, for landfalling and exiting storms.Figure 8 presents the cumulative probability distribution for the actual offshore distance, XL, foralongshore storms.5
P(YF), Probability that Landfaling Distance is less than YFSARASOTA COUNTY - Landfalling / Exiting(150, 1.00)10.75(0, 0.58)(-25, 0.55)0.50.250-150(-150, 0.00)-100-50050100150Landfalling Distance, YF (n.mi.)Figure 7 Cumulative Probability Distribution of Landfalling Distance, YF,for Landfalling and Exiting StormsP(XL), Probability that Offshore Distance is less than XLSARASOTA COUNTY - Alongshore(75, 1.00)1.000.75(37,0.66)0.500.25(0, 0.00)0.0001530456075Offshore Distance, XL (n.mi.)Figure 8 Cumulative Probability Distribution of Offshore Distance, XL,for Alongshore Storms6
3.1Simulation of a n-Year Sequence of Storm Associated Storm TidesWith the statistical characteristics of historical storms available and the two-dimensionalmodel calibrated as described in the preceding section, the simulation shown in Figure 9 is carriedout.The first phase of the simulation comprises the selection of the storm characteristics in accordance with the historical data. In each storm, this involves the following:1) Quantifying p, R, VF, θN and storm track in accordance with the historical probabilities.2) For these characteristics, a random astronomical tide from the storm season is generatedas a boundary condition to the two-dimensional numerical model and the model is run todetermine the storm surge at the site of interest. This storm surge with dynamic wave setup is then adjusted in accordance with the factors obtained from the two-dimensionalmodel calibration runs for the landward grid at each time step to yield the combined totalstorm tide.3)Determining whether enough storms have been simulated for the n-year simulation.4)After the required number of storms and associated storm tides have been simulated, thepeak water levels for each storm are ranked and the return period, TR, is calculated,according toTR 1000/Mwhere M is the rank of the combined total storm tide level. (For example, since thesimulation was carried out for a 1,000 year period, the highest combined total tide levelwould have a return period of 1,000 years, the tenth highest water level would have areturn period of 100 years, etc.). Finally, by presenting these results on semi-log paper,it is possible to interpolate return periods of 5, 10, 15, 20, 25, 30 and 50 years.7
Figure 9 Flow Chart for Two-Dimensional Storm Tide Simulations8
3.2SimulationTo summarize information presented earlier, this phase includes the simulation of theoccurrence of 1,000 years of storms along a shoreline segment of 300 n. mi. The simulated stormsare given directional distributions according to Figure 5. In an average 1,000 year period, therewould be a total of 745 storms.Selection of Storm Parameters - Each of the five idealized storm parameters, [Radius toMaximum Winds, R; Central Pressure, po (or Central Pressure Deficit, p); Track Direction, θN;System Forward Speed, VF; and Track Position] is determined randomly in accordance with theassociated cumulative probability distribution functions. The procedure is described below for thetrack direction, θN, and is similar for all other variables.The approximate piece-wise linear cumulative probability distribution function for trackdirection, θN, is shown in Figure 5. The nature of this function is such that the predominantdirections are those where the function rises steeply. To randomly select a track direction inaccordance with the distribution function, the computer first generates a random number between0 and 1 and then selects the θN corresponding to that cumulative probability. The other fourparameters are determined similarly with a separate and independent random number beinggenerated for each parameter and the appropriate cumulative probability distribution used.Calculation of Storm Surge with the Effect of Astronomical Tide - A particular storm can be"phased" such that the maximum resulting storm surge is increased or decreased by astronomicaltidal fluctuations. Considering the predicted ocean astronomical tidal fluctuations at Captiva Islandfrom June 1 to November 30, 1984 to be representative of those occurring during the storm seasonand assuming the phasing of storm occurrence and astronomical tides to be independent, thecombination of these tidal components is carried out in the following manner.With the storm parameters established, a starting time for the storm is selected randomlybetween June 1 and November 30, 1984. The corresponding astronomical tide at the starting timeis generated and varies with time thereafter according to the input astronomical tide data. Thecalculation of the storm surge history by the calibrated two-dimensional model is thus phased withthe astronomical tide to yield the combined storm surge and astronomical tide water level historyat the site of interest.9
3.3Computation of Return PeriodsWith a sufficient number (745) of maximum combined total storm tides simulated to representa typical 1,000 year time interval, the tides associated with various return periods of interest aredetermined. The 745 maximum combined total storm tides are ranked in descending order with thelargest occurring first. The return period, TR, of the ranked tides is thenTR 1000 / Min whichTR Return period in years between expected exceedances of the associatedmaximum storm tideM Rank of maximum storm tideAs an example, for M 745 (associated with the lowest water level) the return period would be:TR745 1000 / 745 1.34 yearswhich indicates that the smallest storm tide could be expected to be exceeded approximately onceevery 2 years. As a second example, the return period for M 20 isTR20 1000/20 50 yearsThe ranked maximum combined total storm tides and associated return periods can be plottedand the combined total storm tide associated with any return period determined. Finally, it is notedthat it is possible to run the simulation procedure any number of times to determine the stability(constancy) of any combined total storm tide associated with a given return period. It is expectedthat for a 1,000 year simulation, the storm tides associated with the longer ( 250 year) returnperiods would not be well-defined by one simulation and would exhibit variation from simulationto simulation. However, the storm tides associated with the lower return periods (TR 100 years)should be well-defined by a 1,000 year simulation and hence are not expected to vary significantlyfor various simulations.10
4.0 ResultsFive 1,000-year simulations for Sarasota County were carried out employing the computermethods and storm statistics presented in the preceding sections. The combined total storm tidesabove NGVD and the associated return periods are plotted on semi-log paper in Figure 10. Eachdata point represents the average value of five simulations and a curve drawn through the datapoints is adopted to represent the tide-frequency relationship.SARASOTA COUNTY12.0011.00North Profile10.00Middle ProfileSouth ProfileCombined Total Storm Tide 5101520253050Return Period, TR (years)Figure 10 Combined Total Storm Tide Elevation Versus Return Period for Study Area11
Table I below gives the combined total storm tide values and corresponding return periods forSarasota County.Table ICombined Total Storm Tide Levels (ft.) for Various Return PeriodsReturnPeriod,TR 3.14.23.1*Includes contributions of: wind stress, barometric pressure, dynamic wave set-up andastronomical tide.12
REFERENCES1.Dean, R. G., Chiu, T. Y. and Wang, S. Y., “Combined Total Storm Tide Frequency forSarasota County, Florida,” Beaches and Shores Resource Center, Florida State University,August 1988.2.U. S. Department of Commerce, National Oceanic and Atmospheric Administration, "StormClimatology for the Atlantic and Gulf Coasts of the United States," NOAA Technical ReportNWS 38, April 1987.3.U. S. Department of Commerce, National Oceanic and Atmospheric Administration, "StormBest Track Files (HURDAT), 1851 – 2009," http://www.nhc.noaa.gov.13
APPENDIX ASUMMARY OF HISTORICAL STORMS AFFECTINGSARASOTA COUNTY14
LEYFRANCESKATRINAWILMAθNYF(degrees) .49.46.626.812.628.918.410.57.311.56.2 ELLLALEALELLLEELLEALEELALLLLALEE
/15/2008NameθNYF(degrees) .516.79.828.79.7 ling Storms 53 ; Alongshore Storms 9 ; Exiting Storms 201Values are estimated prior to LLLLLLLLLLALELLLLELL
APPENDIX BCOMPUTED 15 AND 25 YEAR HYDROGRAPHS FORSARASOTA COUNTY17
Sarasota County15-Year Hydrograph76Elevation 03336Time (hours)Sarasota County25-Year Hydrograph87Elevation (feet-NAVD88)6543210-1-20369121518Time (hours)1821
Line, the establishment of the line is based on the damage potential of 100 year return period hurricanes. A report entitled " Combined Total Storm Tide Frequency for Sarasota County, Florida" . (Direction from which Storm Originates ) SARASOTA COUNTY (10, 0.0) (280,1.00) (102, 0.11) Exiting Alongshore (195,0.38) (131.5,0.24) Landfalling .