Transcription
BP 4Q11 Results and 2012 StrategyScript and slidesBP 4Q11 & 2012 Strategy presentationBob Dudley: Group Chief ExecutiveSECRET2011 Results andStrategy Presentation2011 Results andStrategy Presentation7 February 20127 February 20121Good afternoon everyone and thank you for joining us today. Welcome to BP’s 2011Results and Strategy presentation. We are very pleased to have you with us,whether in person, over the phone or on the web.For those here in our new venue at Canada Square, in east London, you will haveseen behind me our safety evacuation guidelines. There are more details in thesafety briefing card handed to you at reception. We’re not planning to test the alarmsystem today, so if you hear it, please proceed as advised by these instructions.May I also ask you to turn off your mobile or cell phones at this point.With me on stage I have Brian Gilvary, whom I am very pleased to introduce as BP’snew Chief Financial Officer, and Iain Conn, our Chief Executive of Refining &Marketing.In the audience we have our Chairman, Carl-Henric Svanberg and members of ourExecutive Team who will host the break-outs after this session and join us for Q&Alater this afternoon.1
BP 4Q11 Results and 2012 StrategyScript and slidesCautionary statementForward-looking statements - cautionary statementThis presentation, including the video presentation regarding Project 20K, and the associated slides and discussion contain forward-looking statements, particularly those regarding: expectations regarding financialmomentum in 2013 and 2014; BP’s outlook on global energy trends to 2030; expected increases in investment in exploration and upstream drilling and production; anticipated improvements and increases, and thesources and timing thereof, in pre-tax returns, operating cash flow and margins, including generating around 50% more annually in operating cash flow by 2014 versus 2011 at US 100/bbl; divestm ent plans,including the anticipated timing for completion of and final proceeds from the disposition of certain BP assets; the expected level of planned turnarounds and related production outages expectations and plans forincreased investment, increased distributions to shareholders; the restoration of high value production; the expected level of planned turnarounds; expectations regarding our new operating model; expectations ofa challenging marketing environment in 2012 for fuels, lubricants and petrochemicals; the quarterly dividend payment; the strength of the balance sheet; the expected increase in exploration activity; expectationsfor drilling and rig activity generally and specifically in the Gulf of Mexico; the level of performance improvement in Refining and Marketing; expected full-year 2012 organic capital expenditure and increased capitalspend for the future; the timing and composition of major projects including expected start up, completion, level of production and margins; the expected timing and level of final investment decisions theexpected timing and level of appraisal activity; the timing for completion of the Whiting refinery upgrade, other refining upgrades and logistics optimization; the expected level of production in the first quarter of2012 and in full-year 2012 the magnitude and timing of remaining remediation costs related to the Deepwater Horizon oil spill; the factors that could affect the magnitude of BP’s ultimate exposure and the cost toBP in relation to the spill and any potential mitigation resulting from BP’s partners or others involved in the spill; the potential liabilities resulting from pending and future legal proceedings and potentialinvestigations and civil or criminal actions that US state and/or local governments could seek to take against BP as a result of the spill; the timing of claims and litigation outcomes and of payment of legal costs;timing and quantum of contributions to and payments from the 20 billion Trust Fund; expectations regarding the reduction of net debt and the net debt ratio; the expected levels of underlying and reportedproduction in 2012, and the impact of disposals thereon; the expected level of depreciation, depletion and amortization in 2012; expectations for the level and volatility of quarterly losses in Other businesses andcorporate; the expected full-year effective tax rate for 2012; plans to continue to seek opportunities and prospects in BP’s areas of strength, such as deepwater, gas value chains and giant fields; plans tostrengthen BP’s position in unconventionals; the expected production potential of certain existing unconventional oil assets; the timing of the deployment of BP’s new single work management system; thesources and timing of volume growth and earnings momentum in Lubricants and Petrochemicals; expected future levels of resource recovery in giant fields; expectations about the future significance ofdeepwater drilling for BP; BP’s intentions to invest in and develop certain deepwater technology and systems in connection with Project 20K, and the expected level of investment in connection therewith; theexpected level of investments by TNK-BP; TNK-BP’s expected organic production growth; TNK-BP’s plans to manage production decline in certain fields; the timing and composition of major projects of TNK-BP;TNK-BP’s expansion plans; BP’s plans to report TNK-BP as a separate segment in BP’s financial accounts; the expected future level of investment in Alternative Energy; and the expected profitability and level offuture cash flow of certain Alternative Energy assets. By their nature, forward-looking statements involve risk and uncertainty because they relate to events and depend on circumstances that will or may occur inthe future. Actual results may differ from those expressed in such statements, depending on a variety of factors including the timing of bringing new fields onstream; the timing of certain disposals; future levelsof industry product supply; demand and pricing; OPEC quota restrictions; PSA effects; operational problems; general economic conditions; political stability and economic growth in relevant areas of the world;changes in laws and governmental regulations; changes in taxation or regulation; regulatory or legal actions including the types of enforcement action pursued and the nature of remedies sought; the actions ofprosecutors, regulatory authorities, the Gulf Coast Claims Facility and the courts; the actions of all parties to the Deepwater Horizon oil spill-related litigation at various phases of the litigation; the impact on ourreputation following the Deepwater Horizon oil spill; exchange rate fluctuations; development and use of new technology; the success or otherwise of partnering; the successful completion of certain disposals;the actions of competitors, trading partners, creditors, rating agencies and others; natural disasters and adverse weather conditions; changes in public expectations and other changes to business conditions; warsand acts of terrorism or sabotage; and other factors discussed under “Risk factors” in our Annual Report and Form 20-F 2010 as filed with the US Securities and Exchange Commission (SEC).Reconciliations to GAAP-This presentation also contains financial information which is not presented in accordance with generally accepted accounting principles (GAAP). A quantitative reconciliation of thisinformation to the most directly comparable financial measure calculated and presented in accordance with GAAP can be found on our website at www.bp.com.Statement of Assumptions - The operating cash flow projection for 2014 stated on slides 8, 10, 11, 33, 38, 58, 61, 62 and 63 reflects our expectation that all required payments into the 20 billion US Trust Fundwill have been completed prior to 2014. The projection does not reflect any cash flows relating to other liabilities, contingent liabilities, settlements or contingent assets arising from the Deepwater Horizon oil spillwhich may or may not arise at that time. As disclosed in the Stock Exchange Announcement, we are not today able to reliably estimate the amount or timing of a number of contingent liabilities.Cautionary note to US investors - We use certain terms in this presentation, such as “resources”, “non-proved resources” and references to projections in relation to such that the SEC’s rules prohibit us fromincluding in our filings with the SEC. U.S. investors are urged to consider closely the disclosures in our Form 20-F, SEC File No. 1-06262. This form is available on our website at www.bp.com. You can also obtainthis form from the SEC by calling 1-800-SEC-0330 or by logging on to their website at www.sec.gov. Tables and projections in this presentation are BP projections unless otherwise stated.February 20122Before we start, I’d like to draw your attention to our cautionary statement – pleaseread carefully.During today’s presentation, we will reference estimates, plans and expectationsthat are forward-looking statements. Actual outcomes could differ materially due tofactors we note on this slide and in our regulatory filings. Please refer to our AnnualReport and Accounts, 20-F and fourth-quarter Stock Exchange Announcement formore details. These documents are available on our website.2
BP 4Q11 Results and 2012 StrategyScript and slidesBob DudleyGroup Chief ExecutivePlaying to our strengths3Today we are going to return to the plans we laid out to you in October. Our 10-pointplan to grow value.We aim to leave you with an even clearer view of the path ahead.2011 was a successful year of recovery, consolidation and change and we reachedan operational turning point in October.2012 will be a year of milestones as we build on those foundations.And as we move through 2013 and 2014 we expect to see the financial momentumbuilding as we complete payments into the Trust Fund and as our operations start toshow the benefits of our actions.Our 10-point plan provides the roadmap – how we will play to our strengths and besafer, stronger, simpler and more standardised. How value will be driven by growthin both underlying volume and margin – from a portfolio of the right size to generatethe operating cash flow to both reinvest in our project pipeline as well as rewardshareholders as we have announced today with a 14% increase in our quarterlydividend. We believe this will help us to see the true value of the companyrecognised.3
BP 4Q11 Results and 2012 StrategyScript and slidesMoving BP forwardPlaying to our strengthsBob Dudley4Q 2011 resultsBrian GilvaryProgress in the USUpstreamTNK-BPAlternative EnergyBob DudleyRefining and MarketingIain ConnSummaryBob DudleyBreak-outsUpstream - Longer term investments play to our strengthsUpstream - Operating model: improving execution capabilityRefining & Marketing - Delivering a world class downstream businessConclusions and Q&ABob Dudley and Executive Team4So let me outline today’s agenda.I’ll start with an overview and Brian will then take us through the 2011 results indetail.I will then report on progress in the US before outlining our plans for the upstream,including showing you a video of a new initiative in the technology sphere that willbe important for our industry. I will then briefly touch on TNK-BP and AlternativeEnergy, before Iain covers plans for the downstream.After a brief summary the first part of our webcast will end and we’ll break so thatthose here at the venue can re-group for three break-out sessions to be held inrotation. These cover specific sources of value growth that we want to tell youmore about: Mike Daly and Andy Hopwood will cover our plans for long-terminvestment in the upstream. Bernard Looney and Bob Fryar will discuss ourupstream operating model and major projects. And Iain Conn and his team willexplain how we are moving our downstream business forward. The presentationmaterials for these break-outs will be posted on our website during the break forthose not here with us today.At 4.45pm, London time, or GMT, we will gather back here and restart the webcastfor concluding remarks and discussion.We expect to be finished by around 5.30pm, London time.4
BP 4Q11 Results and 2012 StrategyScript and slides2011: A year of consolidationSafety – Trust – Value GrowthSafety Safety and Operational Risk organisation in action Upstream re-organized to strengthen consistency and capabilityTrust Meeting our commitments in the Gulf of Mexico Resumed drilling in the Gulf of Mexico - with enhanced standardsValue Growth Resumed dividend payments 55 new exploration licences awarded in 9 countries 19th year of reported reserves replacement 100%(1) Operational turning point Portfolio strengthened- Planned divestments of 38bn- Acquisitions in Brazil and India Refining & Marketing record earnings(1)Reserves replacement as reported on a combined basis of subsidiaries and equity accounted entities (including TNK-BP), excludingacquisitions and divestments. See Stock Exchange Announcement for further important information on basis for calculation.5So I want to start by briefly looking back at what we achieved in 2011. As you know,we set out three priorities this time last year – safety; rebuilding trust; and growingvalue. I believe we made good progress on all three.We set up a new safety and operational risk organization and reorganized ourupstream into three global divisions of exploration, developments and production –which allows us to strengthen consistency and capability. We will be showing youmore of the activities of the divisions in the break-outs.I believe trust is built by doing what you say you will do and we have continued tomeet our obligations to the Gulf of Mexico community. We are back to drilling wellsin the Gulf, applying our voluntary standards that go beyond regulatory requirements.And looking to value growth there has also been great progress.In 2011 we resumed dividend payments.Our organic reported reserves replacement was above 100% againGlobally BP was awarded 55 new exploration licences in nine countries last year –making it 84 over the last year and a half. We believe this resulted in more netacreage than accessed by any of our peers in 2011 and it is a powerful indicator ofhow confidence has been restored in BP to work around the world after the eventsof 2010.In October we reached a turning point in our operations, already evidenced in theincrease in production volumes that you have seen us report today for the 4thquarter.We have made substantial progress with our divestment programme which we willcome back to in more detail, and completed transactions that expanded the portfolioin the strategically important geographies of India and Brazil.And our downstream business achieved a record year for earnings5
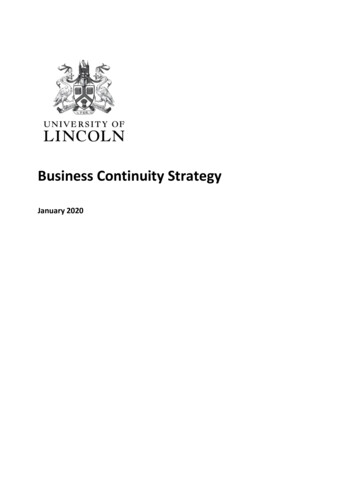
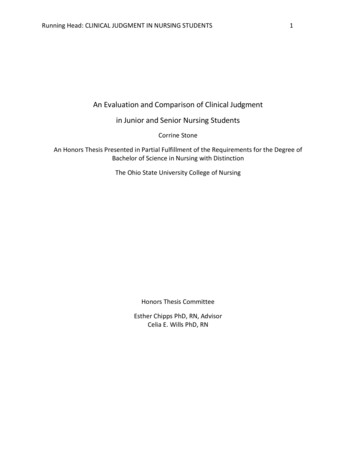
BP 4Q11 Results and 2012 StrategyScript and slidesKey global energy trends to 2030Continued strong growth in demand- Concentrated in non-OECD Oil, gas and coal expected to deliver 80% ofneeds by 2030 and to have similar shares of globaldemand- Gas is the fastest growing fuel; 2% per year- Oil continues to dominate transport fuel Renewables growing from 2% to 6% of globalenergy supply; more than 8% per yearEnergy contributions to global growth2.52.0% per annum RenewablesHydro1.5NuclearCoal1.0Gas North America has the potential to become energyself sufficient by 20300.5 Industry needs to continue to develop newfrontiers and apply technology and learning0.0Oil1970199019902010201020306Projections from BP Energy Outlook 2030So that was the story of 2011, but before we look ahead let’s just remind ourselvesof some important context.There are a number of clear trends in the energy world as we highlighted in ourrecent 2030 Energy Outlook.We expect aggregate energy demand to rise by up to 40% by 2030, nearly all of itfrom emerging economies.By 2030, we expect oil, gas and coal to have similar shares of global demand. Weexpect gas to grow at around 2% per year, double the rate of oil. But we expect oilto continue to dominate transport fuel.Renewables are expected to grow the fastest of all at around 8% per year but evenso we estimate only 6% of the 2030 energy mix will be supplied by renewables.We also see that North America has the potential to become energy self sufficientby 2030. This is driven by the shale gas revolution, but also by growth in biofuels anddomestic production from deepwater, shale and heavy oil.I believe our strategy is aligned to these trends and positions BP well for the future.We will continue to invest in Deepwater, Gas and Renewables. We are investing ingrowing markets, for instance India and Brazil, as well as in North America andelsewhere. And we are using our global reach to leverage technology and learningwherever we see the greatest opportunities.6
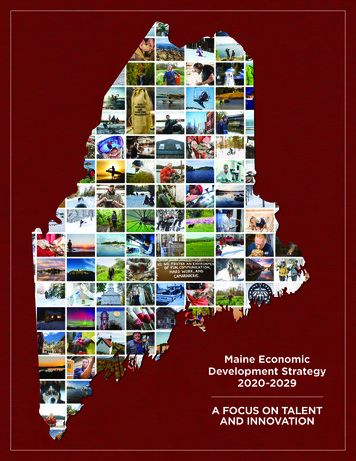
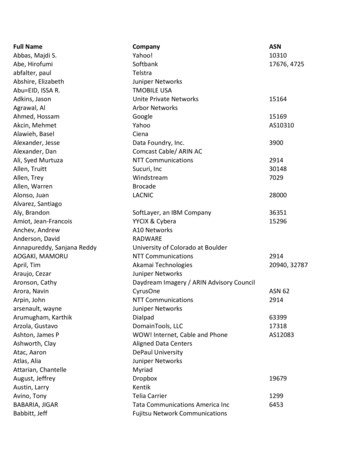
BP 4Q11 Results and 2012 StrategyScript and slidesEnvironmentBrent oil /bbl(1)Natural gas /mmbtu(1)Refining Marker Margin /bbl(2)2816030Henry Hub14024120Japan/Korea marker252020100168015126010840542002005 2006 2007 2008 2009 2010 2011 2012(1)(2)020052006 20072008 2009 201020112012020052006 2007 2008 20092010 2011 2012Source: Thomson Reuters Datastream, 12 January 2012BP Refining Marker Margin based on BP's portfolio7Against such trends, the oil price environment has been uncertain and volatile andgas prices continue to reflect regional supply/demand dynamics with spot pricing inthe US remaining heavily disconnected from oil prices and more aligned in Europeand Asia.In 2011, refining margins improved for a second consecutive year as demand for oilproducts continued to grow, driven by the non-OECD markets.The outlook remains difficult to predict. It requires us to be very clear about ourstrategy and only participate where we can compete no matter what theenvironment holds in store.I believe BP can do this. We have the scale, the focus, the distinctive tradingcapability and the access to growth markets. Which brings me to our 10-point plan.7
BP 4Q11 Results and 2012 StrategyScript and slidesMoving BP Forward10 - point planWhat you can expectWhat you can measure1.Relentless focus on safety and managingrisk6.Active portfolio management to continue2.Play to our strengths7.3.Stronger and more focusedNew upstream projects onstream with unitoperating cash margins double the 2011average(1)4.Simpler and more standardized8.5.More visibility and transparency to valueGenerate around 50% more annually inoperating cash flow by 2014 versus 2011at 100/bbl(2)9.Half of incremental operating cash forre-investment, half for other purposesincluding distributions10. Strong balance sheet(1) Assuming a constant 100/bbl oil price and excluding TNK-BP(2) See Statement of Assumptions under Cautionary Statement8In October, I put forward five points to expect and five to measure.I said we would focus relentlessly on safety, play to our strengths, and be stronger,more focused, simpler and more standardized. We promised to create morevisibility and transparency to value.In terms of measures, you will see continuing active portfolio management. InOctober, we announced an intention to pursue a further 15 billion of divestments,making a four-year total of 45 billion by the end of 2013. With the subsequenttermination of our previously announced divestment of Pan American Energy thetotal is now 38 billion.Meanwhile we expect to see new projects coming onstream with operating cashmargins around double the 2011 upstream average by 2014 – that’s at 100 perbarrel and excluding TNK-BP.You can expect us to generate an increase of around 50% in additional operatingcash flow by 2014 compared to 2011 - approximately half from ending Gulf ofMexico Trust Fund payments and around half from operations.We plan to use around half that extra cash for re-investment and half for otherpurposes including shareholder distributions. And all of this will be underpinned by astrong balance sheet.You will see evidence of how we are already delivering on these commitments astoday’s presentation unfolds.8
BP 4Q11 Results and 2012 StrategyScript and slidesPlaying to our strengths Leading explorer Distinctive upstream portfolio focussedin three growth engines-Deepwater-Gas value chains-Giant fields World class downstream Technology development Strong relationships9Our roadmap for long term value creation plays to our strengths.In the upstream we have a great track record in exploration - deep expertise infinding oil and gas. We have three distinct engines for growth where you can expectto see us focus our long term investment – deepwater; gas value chains and giantfields.We have a world class set of downstream businesses focused on fuels, lubricantsand petrochemicals.We have several world leading technologies, from advanced seismic imaging tolubricant formulations and proprietary processes for petrochemical manufacture.And we also have long experience of building and maintaining relationships. Wesaw the importance of this in the aftermath of the Gulf of Mexico oil spill as manygovernments, regulators, customers and suppliers around the world have stood byus and worked with us through this difficult phase.9
BP 4Q11 Results and 2012 StrategyScript and slidesGrowing valueBuilding momentum2012: Year of milestones2013 / 2014: Financial momentum 12 exploration wells 15-25 exploration wells per annum Start-up of 6 upstream major projects Start-up of 9 upstream major projects Gulf of Mexico production recovering 8 rigs expected to be operating in theGulf of Mexico Divestment program to continue Refining & Marketing to complete 2bn performance improvement vs2009 Payments into the Gulf of Mexico oilspill Trust Fund end in 4Q12 Capex increasing to 22bn(1)Assuming a constant 100/bbl oil price andexcluding TNK-BP Divestments since start of 2010 expected toreach 38bn by end 2013 Whiting upgrade expected onstream in 2H 2013 Unit operating cash margins from new upstreamprojects by 2014 expected to be double the 2011average(1) By 2014 generating around 50% more annuallyin operating cash flow versus 2011 at 100/bbl(2) Distributions expected to increase in line withimproving circumstances of the firm(2)See Statement of Assumptions in Cautionary Statement10As we set out in October in our 10-point plan, there are clear near term measures ofhow we will grow value.2012 will be a year when we see increasing investment and delivery of many keymilestones.The year will be marked out by an increase in exploration wells from six in 2011 to12 in 2012, six new project start-ups and eight rigs at work on BP-operated fields inthe Gulf of Mexico. We expect capital investment to grow to around 22 billion andto progress our programme of planned divestments.In Refining & Marketing we plan to complete delivery of 2 billion in underlyingperformance improvement versus 2009.And we will complete our payments into the Gulf of Mexico Trust Fund in the 4thquarter.Then in 2013 and 2014, as investment continues, we also expect to see greaterfinancial momentum coming through in our operations.A further nine new projects will start up and average operating cash margins fromnew projects in 2014 will have doubled relative to the 2011 portfolio. The upgradedWhiting refinery is planned to come onstream. And divestments are expected tohave reached 38 billion. All of this such that by 2014 we will see the expected risein operating cash flow.10
BP 4Q11 Results and 2012 StrategyScript and slidesGrowing value2013-14: financial momentumAround 50% growth in operating cash flow by 2014 at 100/bbl (1) Key enablers:- Restoration of high value production- Growth from new projects- Whiting refinery upgrade coming onstream- Completion of contributions to the US Trust FundOperating cash2011 operatingcash at oil priceof 111/bbl(1)Gulf of Mexicooil spill relatedobligationsOperationalrestoration andgrowthDivestedoperationsandenvironment2014 operatingcash estimateat oil price of 100/bbl11See Statement of Assumptions under Cautionary StatementLooking at it in terms of a simple bridge we start with operating cash flow in 2011 of 22 billion.The growth comes from four key drivers.The completion of payments to the US Trust Fund accounts for roughly half of theexpected increaseThen we have the restoration of high value production and growth from our newprojects.This is partially offset by divestments and the environmental assumptions we havefactored in.Added all together we get an increase in operating cash flow in 2014 of around 50percent, at an assumed 100 oil price.Today’s presentation aims to give you more confidence in our ability to deliver onthis outcome.But before we do this I want to touch on some of the more critical enablers of our10-point plan, those related to safety, to technology and to people and organization.11
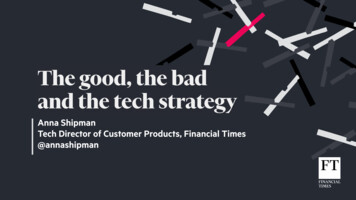
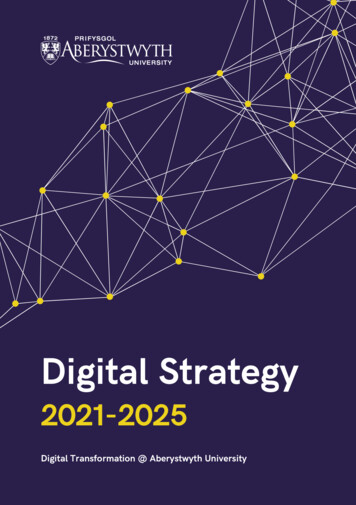
BP 4Q11 Results and 2012 StrategyScript and slidesSafety performance .60.40.20.0Loss of Primary Containment Incidents200820092010 14% reduction in number of Losses ofPrimary Containment Incidents from 2010to 2011 Recordable Injury Frequency(per 200,000 hours)2011Recordable Injury Frequency-Setting aside the Deep Water Horizonresponse, performance remains atbenchmark levels1999 2000 2001 2002 2003 2004 2005 2006 2007 2008 2009 2010 2011Group excluding response contributionDeepwater Horizon response contributionAPI US benchmarkInternational Association of Oil & Gas Producers benchmark12First safety.Here are some figures to show how we are performing.We measure even the smallest release of hydrocarbons and track them carefully.We call them loss of primary containment. In terms of process safety, the numberof incidents in which there has been a loss of primary containment has fallen onceagain. That is positive, but of course even one incident is too many.Also on this chart you can see the progress we are making in improving personalsafety, measured through the Recordable Injury Frequency rate. Aside from theexceptional activities of the Deepwater Horizon response, steady progress has beenmade over the last decade.We have also continued to implement the recommendations of the BP investigationinto the 2010 incident – the Bly Report. Examples include the strengthening of thetechnical authority's role in cementing and zonal isolation and establishing keyperformance indicators for well integrity, well control and rig safety criticalequipment. We continue to make progress against the other recommendations.12
BP 4Q11 Results and 2012 StrategyScript and slidesSafety and operational risk – strategic prioritiesLeadership & cultureOperating culture supports safe, compliant and reliable operationsOrganization, competence & contractorsGrowing deep capability and managing contractor activitiesOperating risk assessment & managementBP businesses comprehensively understand their safety and operational risks and arecontinually in action to control or eliminate themSystematic operatingSystematic management and continuous improvementResults, checks & balancesSelf verification and independent assurance confirm BP’s conduct of operatingDelivered through our global Operating Management System13Beyond these markers of progress, we have also done a lot of work on the way weorganize ourselves with respect to safety and risk management.These are the five strategic priorities for our agenda in managing safety andoperational risk. All of them are delivered through our Operating ManagementSystem or OMS, which is the standard system we use to drive systematicmanagement and continuous improvement. The Safety and Operational Riskfunction provides independent assurance, audit and oversight to ensure the systemis designed and operating correctly and works in partnership with line managementto ensure we are focusing on the right priorities.To give just two examples; leadership determines the safety culture of the firm –and our action plan here includes requiring leaders to spend time in the field,observing and inspecting. Organization, on the other hand, includes definingcompetencies required in safety critical roles and assessing individuals and jobcandidates against them.There will be more on how we are applying OMS during the break-outs.13
BP 4Q11 Results and 2012 StrategyScript and slidesTechnologyEnsuring safe, reliable operations is our top priority Focused at the point of competition Leveraged investment through partnerships 16 major technology programmesResource extractionAccess Subsurface understanding Standardized engineeringsolutions UnconventionalhydrocarbonsConversionEfficiency Chemicals processtechnology Upgrading ocks and conversiontechnologies Lubricants Advanced fuels Biofuels14Technology is another key enabler of the 10-point plan. Critically, it enhances safetyand integrity but it also creates value.We have a focused approach to technology, with 16 major technology programmesselectively targeting points of competition within our industry across the areasshown on this chart. You will see another new one later on a short video clip.In 2011 we have increased our research and development spending to over 600million, leveraging this expenditure through collaboration with others. We alsospend a similar amount applying this know how through field trials, pilots and otherdeployment activities.You may have already seen some of the ways in which technology is working for uson display outside and in a short while we are going to introduce you to a newinitiative that we hope will help us unlock greater potential in our deepwaterportfolio.14
BP 4Q11 Results and 2012 StrategyScript and slidesPeople and organization New organizational structures Building technical and leadership capability- Strengthened common BP values- Over 3,000 new technical staff recruitedRestated values and expected behavioursStronger linkage through reward and performance-Balancing medium and longer termSafety Respect Excellence Courage One Team15Value growth will only be unlocked thr
BP 4Q11 Results and 2012 Strategy Script and slides 1 BP 4Q11 & 2012 Strategy presentation Bob Dudley: Group Chief Executive 1 Good afternoon everyone and thank you for joining us today. Welcome to BP's 2011 Results and Strategy presentation. We are very pleased to have you with us, whether in person, over the phone or on the web.