Transcription
Brown, S.L., & Lin, I.-F., (2012). The gray divorce revolution: rising divorce among middle-aged and older adults, 1990–2010. Journals of Gerontology Series B: Psychological Sciences and SocialSciences, 67(6), 731–741, doi:10.1093/geronb/gbs089. Advance Access publication October 9, 2012The Gray Divorce Revolution: Rising Divorce AmongMiddle-Aged and Older Adults, 1990–2010Susan L. Brown and I-Fen LinDepartment of Sociology, Bowling Green State University, Bowling Green, Ohio.Purpose. Our study documents how the divorce rate among persons aged 50 and older has changed between 1990 and2010 and identifies the sociodemographic correlates of divorce among today’s middle-aged and older adults.Design and Method. We used data from the 1990 U.S. Vital Statistics Report and the 2010 American CommunitySurvey (ACS) to examine the change in the divorce rate over time. ACS data were analyzed to determine the sociodemographic correlates of divorce.Results. The divorce rate among adults aged 50 and older doubled between 1990 and 2010. Roughly 1 in 4 divorces in2010 occurred to persons aged 50 and older. Demographic characteristics, economic resources, and the marital biographywere associated with the risk of divorce in 2010. The rate of divorce was 2.5 times higher for those in remarriages versusfirst marriages, whereas the divorce rate declined as marital duration rose.Implications. The traditional focus of gerontological research on widowhood must be expanded to include divorce asanother form of marital dissolution. Over 600,000 people aged 50 and older got divorced in 2010 but little is known aboutthe predictors and consequences of divorces that occur during middle and later life.Key Words: Cohort—Demographic characteristics—Divorce rate—Economic resources—Marital duration—Marriageorder.The United States has the highest divorce rate in theworld, with roughly 45% of marriages expected to endthrough divorce (Amato, 2010; Cherlin, 2010). Althoughdivorce has been studied extensively among younger adults,the research to date has essentially ignored divorce thatoccurs to adults aged 50 and older (Amato, 2010; Cooney &Dunne, 2001; Sweeney, 2010).This omission is notable considering that the UnitedStates is an aging society. Baby boomers were the firstcohort to divorce and remarry in large numbers duringyoung adulthood. Now, they are aging into their fifties andsixties, and this portends that a growing number of olderadults will experience divorce because remarriages are morelikely than first marriages to end through divorce (Sweeney,2010). Indeed, the proportions ever divorced, currentlydivorced, and married at least twice are highest among individuals aged 50 and older (Kreider & Ellis, 2011).Social gerontologists have called attention to the growing diversity of older adult family living arrangements—including the rise in the proportion currently divorced—andthe poorer economic, social, and health outcomes of olderunmarrieds (Allen, Blieszner, & Roberto, 2000; Cooney &Dunne, 2001; Lin & Brown, 2012). Yet, it is unclear whetherolder adults are at a higher risk of divorce today than in thepast, a trend forecasted by scholars decades ago and morerecently by computer microsimulation models of older adultkinship ties (Berardo, 1982; Hammond & Muller, 1992;Uhlenberg & Myers, 1981; Wachter, 1997). Although therehas been considerable speculation about rising divorce inlater life, there is essentially no empirical evidence.In this article, we establish how the divorce rate amongmiddle-aged and older (i.e., aged 50 and older) adults haschanged between 1990 and 2010 by comparing the 1990age-specific divorce rate data from the U.S. Vital Statisticswith our own estimate of today’s divorce rate using the 2010American Community Survey (ACS). The ACS offers a uniqueopportunity to measure the incidence of divorce because allsample members are asked whether they divorced in the past12 months, which can be used to calculate an annual divorcerate. Additionally, we are able to establish key correlatesof divorce among today’s middle-aged and older adults,including demographic characteristics, economic resources,and the marital biography (i.e., marriage order and maritalduration). Another advantage of our approach is attention tocohort differences through comparisons of middle-aged babyboomers versus older adults from the World War II generation.The Prevalence Versus the Incidence ofDivorceThe marital status composition of older adults has shiftedin recent decades such that a larger proportion is divorcedand a smaller share is widowed. Comparing adults aged 65and older in 1980 and 2008, the share reporting their maritalstatus as divorced doubled among men, rising from 5% to10%. Among women, the percentage currently divorced tripled during this time period, climbing from 4% to 12%. In The Author 2012. Published by Oxford University Press on behalf of The Gerontological Society of America.All rights reserved. For permissions, please e-mail: journals.permissions@oup.com.Received August 18, 2011; Accepted August 30, 2012Decision Editor: Merril Silverstein, PhD731
732BROWN AND LINcontrast, levels of widowhood among older men remainedunchanged and actually fell among women between 1980and 2008 (Manning & Brown, 2011). Thus, the prevalenceof divorce has increased (and the prevalence of widowhoodhas declined) among older adults.The growing prevalence of divorce suggests that thedivorce rate, or the incidence of divorce, may be risingamong older adults. But prevalence and incidence are notsynonymous. Prevalence measures describe the proportion of the population occupying a particular status at agiven point in time. In contrast, incidence measures tellus about the risk of experiencing a new condition or event(i.e., divorce) during a specified period of time. Althougha prevalence measure illustrates how widespread divorce isamong older adults, it obscures when the divorce occurred.Many older adults who are currently divorced actuallyexperienced divorce much earlier in the life course. For thisreason, it is not clear why the prevalence of divorce hasincreased. It is possible that today’s older adults are simply less likely to remarry following divorce and thus theirprevalence in the population is greater now. In this scenario, the incidence or rate of divorce remains unchanged.Alternatively, the growing prevalence of divorce mayreflect an increase in the actual risk of divorce. That is,the incidence of divorce (i.e., the divorce rate) may haveclimbed in recent years. In this study, we shed light on whythe prevalence of divorce among older adults has increasedby documenting how the incidence of divorce has changedover the past two decades.Significance of Later Life DivorceAs early as 30 years ago, researchers argued that divorceamong older adults would be a growing trend (Berardo,1982; Hammond & Muller, 1992). Uhlenberg and Myers(1981) posited several reasons why the divorce rate for olderadults would be likely to climb. First, a growing share ofolder adults is in a higher order marriage, reflecting divorceexperienced at earlier stages of the life course. Remarriagesare more likely to end in divorce than are first marriages.Second, divorce in the United States is a common occurrence, which means older adults will continue to be moreaccepting of divorce in the future as either they or peoplearound them experience divorce (cf. McDermott, Fowler,& Christakis, 2009). Third, rising female labor force participation is also conducive to divorce in that women havethe economic autonomy (e.g., employment, retirement benefits) to support themselves outside of marriage. Finally,lengthening life expectancies decrease the likelihood thatmarriages will end through death and increase the length ofexposure to the risk of divorce (Uhlenberg & Myers, 1981).More recently, Wu and Schimmele (2007) suggestedthat broad cultural shifts in the meanings of marriage anddivorce influence all generations, including older adults.Specifically, the weakening norm of marriage as a lifelonginstitution coupled with a heightened emphasis on individualfulfillment and satisfaction through marriage may contributeto an increase in divorce among older adults, including thosein long-term first marriages. Marriages change and evolveover the life course and thus may no longer meet one’s needsat later life stages. Qualitative research indicates that manyolder couples that divorce simply have grown apart (Bair,2007). Lifelong marriages are increasingly difficult to sustain in an era of individualism and lengthening life expectancies; older adults are more reluctant now to remain inempty shell marriages (Wu & Schimmele, 2007).Despite these theoretical suppositions for a sustained risein divorce among older adults, the empirical research on thistopic is limited, and most studies are quite dated (Berardo,1982; Hammond & Muller, 1992; Uhlenberg, Cooney, &Boyd, 1990; Uhlenberg & Myers, 1981; although see Wu& Penning, 1997). Early research documented empiricallythat divorce was on the rise for older adults during the1980s but did not establish the predictors of divorce in laterlife (Hammond & Muller, 1992; Uhlenberg et al., 1990).Recently, the Association of American Retired Persons(AARP) conducted an internet survey of people aged 40–79who divorced between the ages of 40 and 69, although theirstudy did not include a comparison sample of continuouslymarrieds, so it was not possible to identify correlates ofolder adult divorce (Montenegro, 2004).One study using Canadian data from 1990 suggestsa modest increase in the divorce rate for women in theirforties and fifties during the 1980s, with factors such asmarital duration negatively associated with the odds ofdivorce (Wu & Penning, 1997). However, women in aremarriage were less likely to divorce than those in a firstmarriage, and education was positively associated withdivorce, results that are not consistent with U.S. patterns(cf. Amato, 2010). Either these findings from the Canadiancontext have limited applicability in the United States orthey suggest that correlates of divorce operate differentlyfor older versus younger adults. There is mixed evidencein the U.S. context about whether and how the predictorsof divorce vary by age at divorce, and this literature israther dated and also restricted to a younger age range thanconsidered here (Booth, Johnson, White, & Edwards, 1986;South & Spitze, 1986; Wang & Amato, 2000; White, 1990).It is likely that the precursors to divorce during middleand later life are distinctive given the unique events andexperiences characterizing these life course stages. Duringmiddle and older adulthood, many couples confront emptynests, retirement, or declining health, which can poseconsiderable challenges for marital adjustment (Booth &Johnson, 1994; Davey & Szinovacz, 2004; Hiedemann,Suhomlinova, & O’Rand, 1998). These turning points canprompt spouses to reassess their marriages, ultimately leading them to divorce (Bair, 2007). For example, a marriagethat was satisfactory when both spouses worked and sharedactivities such as child rearing may flounder once the coupleretires and the nest is empty. Growing apart over the marital
THE GRAY DIVORCE REVOLUTIONlife course assumes greater significance with lengtheninglife expectancies (Bair, 2007).Apart from these turning points, there are several keysets of factors related to divorce, including demographiccharacteristics, economic resources, and the marital biography (Amato, 2010). Some of these indicators are expectedto operate uniquely for older adults. Demographic characteristics include cohort, gender, and race. Middle-agedadults face a higher risk of divorce than older adultsbecause divorce declines with age (Amato, 2010). Blacks andHispanics are more likely to divorce than Whites (Sweeney &Phillips, 2004).Economic resources tend to reduce the risk of divorce. Thecollege educated are much less likely to divorce than thosewith lower levels of education (Martin, 2006). Employmentand earnings are also protective against divorce (Amato,2010), but how these operate for older adults who are typically retired and are relying on fixed incomes is unclear.The availability of economic resources could actually facilitate divorce during later life, especially for women (Bair,2007). Financial autonomy allows older women to considerdivorce as a viable alternative to remaining married. Thus,we examine whether gender and economic resources haveinteractive effects on the risk of divorce.Finally, the marital biography, or marriage order and marital duration, shape the likelihood of divorce. Higher ordermarriages are more likely to end through divorce than firstmarriages as those who divorced in the past presumably arewilling to divorce again, whereas some fraction of those infirst marriages is unwilling to ever divorce (Sweeney, 2010).The risk of divorce declines as marital duration increases.Dissatisfied couples are weeded out over time, leaving a disproportionate share of the most stable, well-adjusted couples(Amato, 2010). During later life, remarriages can be plaguedby strained adult stepchildren relationships and conflict overwills, assets, and health care decisions that undermine marital stability. Marital biographies may have differential associations with women’s and men’s risks of divorce as womenare less likely than men to remarry after divorce and womenare more likely to marry older men.The current investigation is designed to examine whetherthe risk of divorce is higher now than it was in the past formiddle-aged and older adults. We anticipate that the rateof divorce among middle-aged and older adults may haveincreased since 1990, particularly for those in midlife as itwas the baby boomers (b. 1946–1964) that came of age during the rapid acceleration of divorce and remarriage duringthe 1970s and early 1980s who are now middle aged. Thisstudy also attends to heterogeneity in the divorce experience of today’s middle-aged and older adults by estimating divorce rates across sociodemographic subgroups andexamining key correlates of divorce. Thus, we provide newempirical evidence on the changing incidence or rate ofdivorce as well as the risk factors associated with divorcefor both middle-aged and older adult cohorts.733MethodsWe conduct original analyses of the 2010 ACS data toestimate the current divorce rate for middle-aged and olderadults, which we compare with existing data from the U.S.Vital Statistics on the divorce rate in 1990 to illustrate howthe risk of divorce has changed over the past two decades.We also use the 2010 ACS to examine sociodemographicsubgroup variation in divorce rates and the correlates ofdivorce, including the roles of demographic characteristics,economic resources, and the marital biography in the risk ofdivorce among middle-aged and older adults.2010 ACSThe ACS is a nationwide annual survey that began witha demonstration phase during 2000–2004 and was fullyimplemented in 2005. It was designed to obtain information formerly gathered through the census long-form sample, including demographic, economic, housing, and socialcharacteristics of the U.S. population (U.S. Census Bureau,2009). Marital history questions have been added to the survey since 2008 in response to the lack of national data onthe incidence of marriage and divorce (Elliott, Simmons,& Lewis, 2010). We considered middle-aged and olderadults both together and separately. The 2010 ACS sampleof 3,061,692 persons included 1,138,468 people aged 50and older, 647,657 people aged 50–64, and 490,811 peopleaged 65 and older.Divorce Rate.—ACS respondents are asked whetherthey experienced a divorce in the past 12 months. To calculate the divorce rate, we divide the number of people whoreported a divorce in the past 12 months by the number atrisk of divorce during the past 12 months. Those at riskof divorce include those who divorced or were widowedin the past 12 months and those who remained married orseparated at the time of the interview. A recent report documents the superiority of the ACS over other data sources(e.g., the National Survey of Family Growth and the Surveyof Income and Program Participation) for estimating thedivorce rate (Ratcliffe, Acs, Dore, & Moskowitz, 2008).Correlates of Divorce.—Demographic characteristics, economic resources, and the marital biography arerelated to divorce and measured in the ACS. Demographiccharacteristics include cohort, gender, and race/ethnicity.Cohort is coded dichotomously to compare middle-aged(i.e., aged 50–64) and older adults (i.e., aged 65 and older,reference category). Gender is coded 1 for women and 0for men (reference category). Race/ethnicity is a series ofdummy variables: Non-Hispanic Black, Hispanic, nonHispanic other (includes multiracial individuals as wellas people who identify as single race—Asian, AmericanIndian or Alaska Native, Native Hawaiian and PacificIslanders, or some other race), and non-Hispanic White
734BROWN AND LIN(reference category). Economic resources encompass education, employment, and income. Education distinguishesamong those with less than a high school degree, a highschool degree (reference category), some college, and acollege degree or more. Employment is a series of dummyvariables, including employed full time (at least 35 hr/week), employed part time (1–34 hr/week), unemployed,and not in the labor force (reference category) in the past12 months. Personal income is a measure of the individual’s income over the past year from all sources and isclassified as follows: less than 10,000, 10,000– 24,999, 25,000– 39,999, 40,000– 55,000, 55,000– 69,999,and 70,000 or more (reference category). These categories reflect the overall distribution of personal income forpersons aged 50 and older. There are two variables thatcapture the marital biography (prior to any divorce). First,a marriage order dummy variable differentiates betweenthose in a first (reference category) versus higher order(i.e., remarriage) marriage. Second, marital duration ofthe current (or dissolved in the past 12 months) marriage iscoded categorically as follows: 0–9, 10–19, 20–29, 30–39,and 40 or more years (reference category).1990 U.S. Vital Statistics ReportThe U.S. Vital Statistics Report includes both the divorcerate and the number of persons who divorced during 1990by 5-year age intervals separately for men and women(Clarke, 1995). The characteristics (including age) ofdivorcing couples come from the divorce-registration area(DRA) sample of 31 states and District of Columbia. Twostates (Ohio and South Dakota) in the DRA sample did notreport the ages of divorcing persons in 1990. Nonetheless,the age-specific divorce rates for men and women reportedin the U.S. Vital Statistics Report are representative of the1990 population (Clarke, 1995). To calculate the divorcerate, we begin by dividing the number of divorced personsby the divorce rate to obtain the number of persons at riskof divorce. Summing the numbers divorced and numbersat risk across age intervals (and gender) as appropriate andthen dividing the numbers divorced by the numbers at riskyields the 1990 divorce rates for persons aged 50 and older,50–64, and 65 and older.Estimating the numbers of persons aged 50 and older,50–64, and 65 and older who divorced at the national levelrequires adjusting the data to reflect the fact that the DRAsample represents 49% of all divorces that occurred in theUnited States in 1990 (Clarke, 1995). We explored twoapproaches. First, we divided the age-specific numbers ofpersons in the DRA sample by 0.49. Second, we multipliedthe 1990 divorce rate by the number of married persons inthe 1990 census to estimate the national number of divorcesfor each of the three age groups (Ruggles et al., 2010). Thesecond approach generated a larger increase in the numberof divorces over time (i.e., between 1990 and 2010) than thefirst method, and thus we report the numbers from the firstmethod for a more conservative estimate.Despite its limitations, the Vital Statistics offers the bestavailable data with which to estimate the national divorcerate in 1990. A state-by-state validation study conducted bythe U.S. Census Bureau staff indicates that marital eventsdata in the ACS and U.S. Vital Statistics (including the DRAsample) are comparable (Elliott et al., 2010). Estimates formore recent years are not possible because the federal government discontinued the collection of vital statistics onmarriages and divorces at the state level in 1996.To ensure that our results are robust, we performed a supplemental analysis by restricting the 2010 ACS data to onlythe DRA sample states for which age at the time of divorcewas reported in 1990. The results from this supplementalanalysis are nearly identical to those based on the entirenation, suggesting that the rise in the divorce rate is not anartifact of including ACS data from all states.Analytic StrategyOur approach is primarily descriptive as we aim to provide trend data on divorce and to identify the factors associated with divorce among today’s middle-aged and olderadults. All results are presented for the total sample andseparately for middle-aged (aged 50–64) and older (aged65 and older) adults to assess whether there is cohort variation. To begin, we calculate the 1990 and 2010 divorcerates (and numbers of divorces) to determine whether therisk of divorce has increased over the past two decades.Additionally, we estimate 2010 divorce rates for varioussubgroups to show how the likelihood of divorce varies bysociodemographic factors (demographic characteristics,economic resources, and the marital biography). Next, wepresent bivariate comparisons of those who divorced versus remained married across these same sets of factors.Finally, we estimate logistic regression models to examinehow demographic characteristics, economic resources, andthe marital biography are related to divorcing in the past12 months (coded 1) versus remaining married (coded0). Individuals who experienced widowhood in the past12 months are included in the remained married categorybecause they were at risk of divorce in the past 12 months.Excluding them from the analysis produced substantivelysimilar findings (results not shown). These models providecorrelational evidence only; divorces took place during thepast 12 months, whereas the sociodemographic characteristics are measured at interview. Factors associated with thelikelihood of divorce, such as employment or income, mayhave changed in response to divorce. Thus, interpretation ofthe findings requires caution. All analyses were conductedusing replicate weighting techniques as recommended bythe U.S. Census Bureau to generate robust standard errorsbecause the ACS involves a complex sampling design (U.S.Census Bureau, 2009). Given the large sample size of the
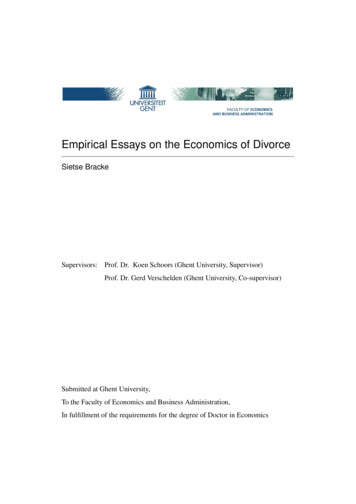
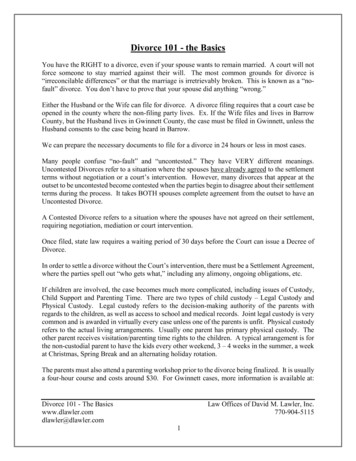
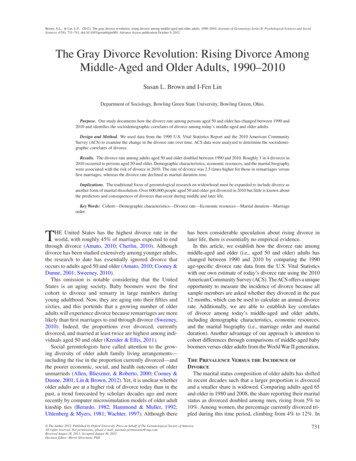
THE GRAY DIVORCE REVOLUTION735Figure 1. Divorce rate and number of persons that experience divorce, for adults aged 50 years and older.ACS, we imposed a stringent threshold for statistical significance: a two-tailed p .01 level.ResultsAs shown in Figure 1, the divorce rate has doubled since1990, rising from 4.9 to 10.1 divorced persons per 1,000married persons. This pattern belies the overall trend inthe U.S. divorce rate during this time period, which wasessentially flat at 19.0 in 1990 and 17.9 in 2010 (resultnot shown). The doubling of the rate of divorce amongmiddle-aged and older adults translates into a substantialincrease in the number of people aged 50 and older whoexperience divorce. In 1990, approximately 206,007 people aged 50 and older got divorced, whereas in 2010 about643,152 got divorced. To contextualize this trend, considerthat fewer than 1 in 10 persons who divorced in 1990 wasaged 50 and older compared with more than 1 in 4 today(result not shown). Furthermore, assuming the divorce rateremains constant over the next two decades—a conservative assumption based on the recent trend—the number ofpersons aged 50 and older who would experience divorce in2030 would rise by one third to more than 828,380 (authors’calculation based on age-specific projected population sizesin 2030 [U.S. Census Bureau, 2004]), reflecting the accelerating growth in the older adult population that will occurover the next 20 years.This pattern holds for middle-aged (50–64) and older (65and older) adults as shown in Figure 2. Both groups exhibitapproximately a doubling in the divorce rate since 1990.Among the middle aged, the divorce rate rose from 6.9 to13.1 divorced persons per 1,000 married persons between1990 and 2010. Similarly, the divorce rate climbed from1.8 to 4.8 among older adults. The difference in magnitudeof the divorce rates for the two age groups means that thenumber of persons divorcing is much higher among middleaged than older adults. In 2010, about 529,842 persons aged50–64 got divorced versus roughly 113,310 persons aged65 and older. Assuming that the respective divorce rates formiddle-aged and older adults remain constant over the nexttwo decades, the numbers of persons whom we estimatewould experience divorce in 2030 would climb by roughly10,000 among the middle-aged and more than 80,000among older adults.Table 1 shows the divorce rates for various subgroupsboth for adults aged 50 and older as well as separately formiddle-aged and older adults. There are significant cohortdifferences in the divorce rates for all of the subgroupsexamined, with middle-aged adults experiencing higherdivorce rates, on average, than their older counterparts. Thedivorce rates are quite similar for women (10.3 divorcedpersons per 1,000 married persons) and men (9.8 divorcedpersons per 1,000 married persons) aged 50 and older. Thereis some racial and ethnic variation in the risk of divorceamong those aged 50 and older, with Whites experiencingthe lowest rate of divorce (9.0 divorced persons per 1,000married persons) and Blacks, the highest (20.5 divorcedpersons per 1,000 married persons). Hispanics are in themiddle (11.3 divorced persons per 1,000 married persons).The divorce rate also differs by economic resources.Those with a college degree experience a considerablysmaller risk of divorce (8.5 divorced persons per 1,000married persons aged 50 and older) compared with thosewith lower levels of education (the divorce rate ranges from9.6–11.5 divorced persons per 1,000 married persons aged50 and older among those with less than a college degree).The rate of divorce is highest among the unemployed (21.2divorced persons per 1,000 married persons), followed bythose who are employed full time (12.4 divorced personsper 1,000 married persons) or part time (10.0 divorced persons per 1,000 married persons). Older adults who are notin the labor force (presumably because they are retired)have the lowest divorce rate (6.9 per 1,000 married persons). The variation in the divorce rate by personal income
736BROWN AND LINFigure 2. Divorce rate and number of persons that experience divorce, for adults aged 50 through 64 years and 65 years and older.is small, ranging from a low of 9.1 divorces per 1,000 married persons among those with incomes less than 10,000to a high of 10.7 divorces per 1,000 married persons amongthose whose personal income is 25,000– 39,999.The risk of divorce varies dramatically by both marriageorder and marital duration. The rate of divorce among thoseaged 50 and older is 2.5 times higher for individuals inremarriages (17.2 divorced persons per 1,000 married persons) than first marriages (6.9 per 1,000 married persons).During middle age, the divorce rate is about 2 times greaterfor remarrieds than first marrieds. During older adulthood,the differential approaches a factor of 4. In terms of maritalduration, the divorce rate among individuals aged 50 andolder is nearly 10 times greater for those married 0–9 years(28.6 divorced persons per 1,000 married persons) versusthose married 40 or more years (3.2 per 1,000 married persons). The rate of divorce declines roughly linearly with rising marital duration.The characteristics of adults who divorce versus remainedmarried are shown in Table 2. Among those aged 50 andolder, the two groups significantly differ across all dimensionsexcept gender. Relative to individuals who remain married,those who divorce are disproportionately non-White (22%and 30%, respectively). They are also less likely to have a college degree—24% of those who divorce have at least a collegedegree versus 29% among those who remain married. Nearlyone third (30%) of those who divorce are not working versusroughly half (44%) among those who remain married. Thosewho divorce are twice as likely to be unemployed as those whoremain married (9% and 4%, respectively). Greater shares ofadults remaining married are in either the lower ( 10,000) orhigher ( 70,000 or more) end of the income distribution compared with those who divorce. The most striking differencesbetween the two groups emerge in their marital biographies.Less than one-half (48%) of those who divorce are in firstmarriages compared with 70% of those who remain married.That is, a majority of those who divorce are in remarriages,whereas most of those who remain married are in first marriages. Not surprisingly then, marital duration is much lower,on average, among those who divorce (44% have been married fewer than 20 years) than those who remain married(59% have been married at least 30 years).Compositional differences are similar for both cohortswith one exception. The sole distinctive pattern emerges forgender among the older cohort with those remaining married disproportionately men (55% vs. 50%).Table 3 shows the odds ratios from the logistic regressionmodels estimating the probability of divorce during the last12 months for all marrieds aged 50 and older as well asseparately for the middle-aged and older cohorts. Amongthose aged 50 and older, the odds that middle-aged adultsdivorce are 1.6 times
itate divorce during later life, especially for women (Bair, 2007). Financial autonomy allows older women to consider divorce as a viable alternative to remaining married. Thus, we examine whether gender and economic resources have interactive effects on the risk of divorce. Finally, the marital biography, or marriage order and mar -