Transcription
Q22018Midyear ReviewSOUTH COAST COMMERCIAL REAL ESTATESUMMARYCOMMERCIAL SALESMarket ChangeCompared to 2017Sales TransactionsDOWNSales VolumeDOWNLease TransactionsUPLease VolumeUPLease RatesDOWNNet AbsorptionNEGATIVEVacancyUPChange values are for all commercial propertytypes since 1/1/2018 .Highlights Commercial sales volumepicked up momentum inQ2; however, inventoryhas expanded to itshighest level since 2012. Goleta to date has seen10 leases for spaceslarger than 10,000 sf, wellabove the recent trend. Retail vacancies arepeaking on SantaBarbara’s State Streetcorridor, and the blocksnear Paseo Nuevoare seeing the fastestexpansion of availablespace. Industrial vacancycontinues to be concentrated in Goleta wherethe rate is above 5%.At the midpoint of 2018, South Coastsales activity has slowed compared toprior years. Both the number of commercial transactions and dollar volume(excluding hotels) have decreasednearly 30% compared to the prior 5-yearaverages. Transaction momentum didpick up in the second quarter, suggesting that the activity during the firstquarter was indeed diminished by theThomas Fire and Montecito mudslide.Additionally, properties currently undercontract have the potential to producea substantial bump in volume in thesecond half of the year.Santa Barbara has been the focus ofmost of the action to date. Two medicalproperties sold in the second quarter,including the 18,200 sf building at 3045De La Vina St, which traded for 9.5million. The mixed-use property at 2801De La Vina St (home to Nick Rail Music)was purchased by a local investor for 3.4million in June.One unheralded area of recent salesactivity is the Lagoon District/LowerEastside area of Santa Barbara. WithHaley and Gutierrez Streets as its arteryand vein, the neighborhood has beenevolving gradually into a sprawlingvariation on the Funk Zone concept,dotted with “adaptive” repurposing ofindustrial property for beer and wine,artisan retail, and office use. The area fromCota Street to US 101 and from Milpas222 E. Carrillo Street, Suite 101Santa Barbara, CA 93101 2018 Hayes Commercial Group805.563.2111HayesCommercial.comStreet to Anacapa Street has produced 21sales valued at 47.3 million over the past18 months. Almost all of those propertieshad either industrial improvements orundeveloped land. Most recently, 519Garden St, 100-102 E Haley St, 719 BondAve, and 314 Edison Ave all sold in thesecond quarter.Activity in Goleta and Carpinteria wassubdued in the first two quarters, withjust three commercial sales in each city.In the second quarter, the City of Goletapurchased the warehouse propertyat 27 S La Patera Ln from Direct ReliefInternational for an undisclosed sum.The Cantwell’s Market building at 2580Lillie Ave in Summerland was purchasedby an owner-user for 5.4 million.Looking at supply, a growing number ofSouth Coast owners have concluded itis time to sell. The number of propertiesfor sale has rocketed upward 54% from ahistoric low at the end of 2017. Propertiesfor sale have increased in all three cities,with the biggest jumps in office andretail. Some of the increase in inventorystems from the slow sales activity towardthe beginning of the year. However, 46 ofthe 63 available properties have come tomarket since the beginning of the year.Retail property for sale in Santa Barbarais at the highest level on record with19 listings available. This mirrors thenational trend, according to a reportby the Boulder Group, in which retailowners seeking to sell ahead of rising cap
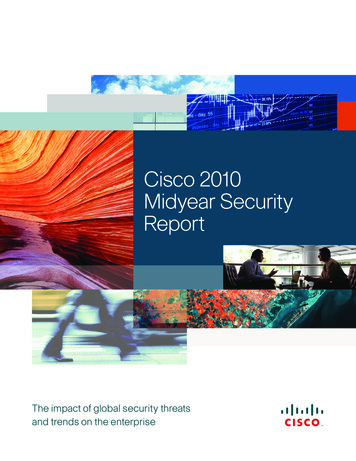
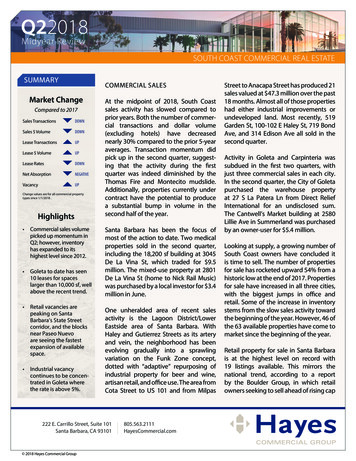
Q22018Page2Midyear ReviewSouth Coast Salesspaces becoming available, rather than a dramatic shiftin trend.In Goleta, the largest new availability is the 105,257 sfbuilding at 71 S Los Carneros Rd in Goleta, which isoccupied by Apeel Technology for another 18 months,under sublease from Allergan. Despite this single largespace coming back on the market, the underlying trendin Goleta is toward contraction. In fact, there were 10leases signed to date for spaces larger than 10,000 sf, farexceeding the pattern of recent years. Only one of theseleases was a renewal: Raytheon exercised its option on121,131 sf at 75 Coromar Dr. The second quarter saw largeleases by Seek Thermal, Resonant, EmployBridge, andToyon Research. We stand by our characterization twoquarters ago that Goleta’s office market is “resurgent.”rates are expanding inventory in major markets. In SantaBarbara, owners on State Street may also be aiming tosell ahead of rising vacancy. There are nine propertiesfor sale along the downtown State Street corridor. Thatretail stretch has already seen five transactions to datethis year: the sales of the Macy’s (701 State St) and Saks(1001 State St) buildings in the first quarter, followed bythree sales on the 1200 block in the second quarter.Will the South Coast’s largest inventory since 2012 leadto rebounding sales volume in the coming quarters? Ourbrokers report that solid investor demand persists for realestate with a clear path to a competitive return, especially given uncertainty in other investment classes, such asstocks and commodities. However, properties that aremore of an unknown quantity will face greater pricingheadwind in conditions of expanded supply. Interestrates are still low in the long view, but their gradual rise issqueezing the margin for risk that has enabled much ofthe sales activity during the past five years.OFFICE LEASINGAvailable office space has increased in all three marketcities since year end, pushing the combined SouthCoast vacancy rate to 9.2%, the highest level on record.However, some of that rise is due to a few very large222 E. Carrillo Street, Suite 101Santa Barbara, CA 93101805.563.2111HayesCommercial.comIn contrast to Goleta, the trend in Santa Barbara pointstoward higher vacancy, which at midyear stands ata historically high rate of 6.2%. Both square feet andthe number of spaces available in Santa Barbara haveexpanded more than 60% over the past three years. TheUCSB Economic Forecast Project’s May report for SantaBarbara County cites a 12% decrease in professionaland business services sector employment during thepast three years. Since much of Santa Barbara’s officeproperty is used by professional and business services,this shift in employment may be sapping demand foroffice space. To date in 2018, absorption has decreased18% compared to last year. In the second quarter, the19,738 sf building at 3820 State St came to the market,which was the final straw thatpushed the vacancy rate toOFFICEan unprecedented level.Increasedvacancyisevidently pressing SantaBarbara landlords to greaterpricing concessions. Sincethe beginning of 2017,the average discount thatlandlords conceded to securea new tenant increased 230basis points, compared toVacancy7.7%Available SpaceUPGross AbsorptionUPAsking RatesUPAchieved RatesDOWNSummary for the entire South Coast.Change indicators are since 1/1/2018.
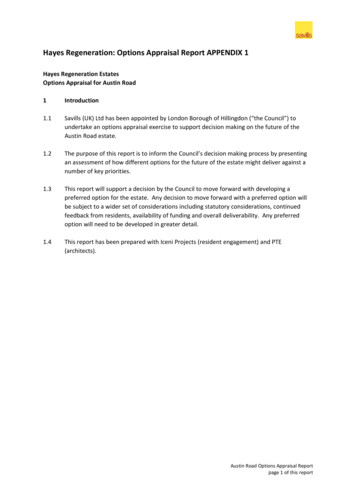
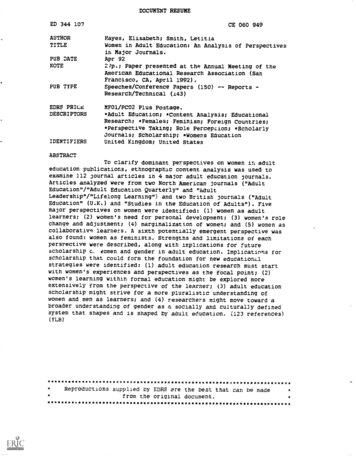
Q22018Page3Midyear Reviewleases completed from 2013 to 2016. On the other hand,Santa Barbara’s high vacancy has not affected dealvolume; the first half of 2018 produced 56 lease transactions, which is right on par with the past five years.In Carpinteria, five of the six leases to date werecompleted in the second quarter, including StarrIndemnity & Liability’s lease of 10,395 sf at 1001 MarkAve. Vacancy has rebounded significantly since Procore’sleasing spree ended in 2016, but the current rate of 5.2%is still relatively low by historical standards.than during the peak of thelast recession. The vacancyrate on State has been onan upward trend since a lowpoint of 3.0% in Q1 2015,while the US retail sectorand retail elsewhere in SantaBarbara have producedrelatively stable vacancyover the same period.RETAILVacancy3.0%Available SpaceDOWNGross AbsorptionUPAsking RatesDOWNAchieved RatesDOWNSummary for the entire South Coast.Change indicators are since 1/1/2018.Vacancy RateIn our analysis, we dividedRETAIL LEASINGthe corridor into four segments and found that thePaseo Nuevo area (600 to 900 blocks) has been disproState Street has seen a disconcerting sequence of portionately impacted by the rise in vacancy. Since Q1departing tenants in the past six months, including 2015, this four-block stretch has added available spacesAaron Brothers, Verizon, Chipotle, Pinkberry, Staples, at twice the rate of the adjacent segments on either side.and Peet’s Coffee. The plight and future of State Street Obviously, as home to the Macy’s building this segmentcontinues to be a prominent topic of attention and also bears the vast majority of State Street’s availableconcern, and in an effort to inform the discussion, Hayes square footage. Yet, even excluding the Macy’s building,Commercial recently completed our most thorough the vacancy rate for these blocks is 11% and has risensurvey to date of the State Street corridor from the at double the rate of the neighboring segments overwaterfront to Sola Street. In a nutshell, our research the past three years. It’s not clear what has happenedconfirms that there are more spaces available now during the past three years that would explain thisphenomenon,butState Street Retail Vacancy (00 to 1300 Blocks)these blocks have thehighest concentrationof national retailers andIncluding Macy’sthe highest rents alongthe corridor. Whateverthe reason, it certainlyexacerbates the imageof State Street’s declineUS Retailwhen prime blocksadjacent to a regionalmall have the steepestvacancy growth.State StreetRest of Santa Barbara2008200920102011201220132014Source: Hayes Commercial Group, US Retail data from REIS, Inc222 E. Carrillo Street, Suite 101Santa Barbara, CA 18Not all of the news isgrim, though. Leasesare being signed, andState Street continues toavoid stagnation despitehigh vacancy. Along the
Q22018Page4Midyear Reviewdowntown corridor, 10 leases have been completedto date, including the renewal by Apple at 928 StateSt. Montecito restaurateurs are bringing variations onexisting concepts to State Street as the operators of TreLune will launch Due Lune in 3,660 sf at 1 State St, andTrattorie Mollie’s sister restaurant is already open at1218 State St. The beleaguered 6,750 sf corner space at400 State St was leased by Habitat Home and Garden.In Goleta, the big story is Kmart’s closing in October,to be replaced by Target following upgrades to thecenter. This change will further establish the Hollisterand Storke area as the center of gravity for Goletaretail. The effects on the rest of Goleta are alreadyevident. There is four times more retail space availableeast of the airport than west of the airport towardStorke Road. For example, Calle Real Center has beenstruggling to attract and retain tenants; despite twoleases completed this year, there remain seven spacescurrently available comprising 18% of the property. Thedifference in pricing is also telling: landlords are askinga 42% premium per square foot west of the airportcompared to the eastern part of the city. This echoesthe phenomenon in most American suburbs in whichstrip malls and grocery-anchored centers located near“big box” centers have a harder time retaining customertraffic. To keep this in perspective, though, Goleta’svacancy rate is still remarkably low at 1.9%, comparedto the national average of 10.2%.Goleta’s industrial vacancyINDUSTRIALhas nearly doubled sincea year ago and currentlyVacancy2.7%stands at a rate of 5.2%, thehighest level since 2012. Available SpaceUPAside from Curvature’sDOWNshort-termrenewalof Gross Absorption57,600 sf at 70 Cremona Dr, Asking RatesUPthere were only five indusUPtrial leases by midyear, all Achieved Ratessmaller spaces totalingSummary for the entire South Coast.Change indicators are since 1/1/2018.10,871 sf. Vacancies createdby Channel Technologies,Direct Relief International, FLIR, and others have resultedin an unusual number of large industrial spaces on themarket. Smaller spaces are leasing, but tenants lookingfor large spaces are few.INDUSTRIAL LEASINGIn Santa Barbara the number of lease transactions todate is trending 30% above the prior 5-year average.However, most of the leases have been for smallerspaces. Standing desk accessory company FluidStanceleased 3,277 sf at 121 E Mason St in the Funk Zone. Therewere two renewals of approximately 12,000 sf each at 1N Calle Cesar Chavez by Town & Country Event Rentalsand US Air Conditioning Distributors. There are onlysix spaces available, comprising a wispy vacancy rateof 0.35%. Asking rates vary substantially depending onlocation; not surprisingly, the Funk Zone is the high-rentarea of town, where landlords are asking a premium ofabout 50 cents per square foot per month.On the industrial scene, Santa Barbara and Carpinteriaare continuing the trajectory of very low vacancy, whileGoleta’s vacancy is on the rise due to emerging largeavailabilities. There is ample demand from smallertenants, but larger spaces are proving harder to lease.Based on tenant requirements currently in the market,we expect this bifurcation of demand to continue in thenear future.In Carpinteria, there are only three spaces available, allwith asking rates comparable to what is being askedfor office space in that city. The 24,030 sf building at6384 Via Real was brought to the market in the secondquarter, as Northrop Grumman plans to vacate by theend of the year. There were no leases signed in thesecond quarter and just two in the first, one of whichwas a renewal.To receive future Hayes Commercial Group reports electronically, please visit HayesCommercial.com and subscribe.222 E. Carrillo Street, Suite 101Santa Barbara, CA 93101805.563.2111HayesCommercial.com
8Midyear Review6.11% 2.36 2.36 2.26 2.266.10% 2.43 2.43 2.36 2.364.96% 2.59 2.59 2.37 2.374.06% 2.85 2.85 2.56 2.564.37% 2.93 2.93 2.65 2.6520166.11% 2.376.10% 2.564.96% 2.654.06% 2.654.37% 2.664.38%4.38% 2.96 2.96 2.65 2.652Q175.41%5.41% 3.03 3.03 2.66 2.662011 2.592012 2.852013 2.932014 2.962015 3.03201620112Q172012201320142015OFFICE LEASING 3.00Available 2.50Santa Barbara312,775 2.00443,578GoletaCarpinteria32,702789,055Vacancy RateAsking Rate 2.36 1.00Change*6%Asking Rate8%8%Change*Achieved RateChange*7.2% 2.50 2.50151,358-20.2% 3.276% 4.2%6% 2.711.3%11.3%4%114.4% 1.96 1.942.8% 1.98- 0.06361,835-14.9% 1.50Totals8% 3.00 3.00GrossChange*Absorption8.3% 2.00 2.0016,92626.8%530,11942.6% 1.50 1.50Achieved RateVacancy RateAsking Rate 2.472%2.4% 2.162%Achieved Rate-6.0%Vacancy RateAsking RateAchieved Rate16.56% 1.702011 2.2610.71% 1.6920110% 1.57 * Since 1/1/2018. Averagerate totalsare weightedby 1.58square footage.12.62% 1.61 1.972012 2.3610.01% 1.6120122015 201620102011 2012 2013 20142Q17 1.5912.12% 1.62 1.682013 2.379.50% 1.73 1.722013 1.00 1.000%0%12.12% 1.76 2.05 2.5610.22% 1.74 1.6820142010 172016 2Q17201420116.11%20126.10% 2.4320134.96% 2.5920144.06% 2.8520154.37% 2.9320164.38% 2.96 2.6520175.80% 3.14 2.682Q186.22% 3.27 2.71Office Vacancy vs. Achieved & Asking Rates 2.65 1.75 1.7720151.74% 1.67 1.7211.95% 1.82AchievedRate 1.8720162.34% 2.29 2.0010.41%2015Asking Rate201620172Q188.78% 1.92 1.8820176.07% 1.97 2.119.77% 1.96 1.942Q185.16% 1.78 1.98Asking RateVacancy Rate Asking ncyRate RateSanta BarbaraVacancyVacancyRate RateCarpinteriaGoleta13% 2.5020% 3.006% 1.7511% 2.0015% 2.504% 1.509% 1.5010% 2.002% 1.257% 1.005%0% 1.005% 0.50 1.502011 2012 2013 2014 2015 2016 2017 2Q18Asking Rate2011 2012 2013 2014 2015 2016 2017 2Q18Achieved RateVacancy Rate2018 Office Leases of NoteAsking RateVacancy Rate psf GR 2.00Vacancy8% psf GR 3.50Vacancy psf GR 1.782%1.8%4%-10.0%4%2011 2012 2013 2014 2015 2016 2017 2Q18Asking RateAchieved RateVacancy RateVacancy RateVacancyMarketPage50%Achieved RateVacancy RateLargest Available Spaces71 S Los Carneros Rd, Goleta112,480 sf Allergan building70 Castilian Dr, Goleta86,246 sf in Castilian Tech Ctr650 Ward Dr, Goleta30,000 sf Office/R&D6300 Hollister Ave, Goleta30,863 sf – Seek Thermal175 Cremona Dr, Goleta27,037 sf – Resonant5385 Hollister Ave, Goleta21,504 sf Pacific Tech Center5540 Ekwill St, Goleta20,829 sf in Santa Barbara Tech Center3820 State St, Santa Barbara19,738 sf in EmployBridge building6398 Cindy Ln, Carpinteria19,063 sf in Office & Warehouse1020 State St, Santa Barbara19,000 sf in Brownstein building3660 State St, Santa Barbara11,930 sf – Wells Fargo Advisors222 E. Carrillo Street, Suite 101Santa Barbara, CA 931011001 Mark Ave, Carpinteria10,395 sf – Starr Indemnity & Liability805.563.2111HayesCommercial.com530 Chapala St, Santa Barbara18,792 sf Sonos sublease
8Midyear Review6.11% 2.36 2.36 2.26 2.266.10% 2.43 2.43 2.36 2.364.96% 2.59 2.59 2.37 2.374.06% 2.85 2.85 2.56 2.564.37% 2.93 2.93 2.65 2.6520166.11% 2.376.10% 2.564.96% 2.654.06% 2.654.37% 2.664.38%4.38% 2.96 2.96 2.65 2.652Q175.41%5.41% 3.03 3.03 2.66 2.662011 2.592012 2.852013 2.932014 2.962015 3.03201620112Q172012201320142015RETAIL LEASING 3.00Available 2.50Santa BarbaraChange*6%Asking Rate8%8%Change*Achieved RateChange*-13.4% 2.50 2.5065,8789.6% 4.566% -1.3%6% 3.97-1.2%4%285.9% 3.07 2.57-17.7% 1.75-32.3%341,817 ncy RateAsking Rate 3.93 1.0053,943-2.3% 2.00 2.002,193 1.50Totals8% 3.00 3.00GrossChange*Absorption-12.6% 3.302%122,01458.8% 1.50 1.50Achieved RateVacancy RateAsking Rate 4.212%-0.6% 3.312%Achieved Rate-13.0%Vacancy RateAsking RateAchieved Rate3.65% 2.512011 2.613.14% 2.4620110% 2.53 * Since 1/1/2018. Averagerate totalsare weightedby square footage.4.45% 2.762012 3.272.07% 2.7220122015 201620102011 2012 2013 20142Q17 3.053.18% 2.752013 3.271.39% 2.91 2.262013 1.00 1.000%0%1.26% 2.40 3.601.71% 2.97 2.6420142010 172016 2Q17201420112.77%20121.98% 3.9020132.10% 3.9620141.83% 4.1120152.08% 4.2020161.86% 4.36 4.2020173.76% 4.61 4.022Q183.25% 4.56 3.97Retail Vacancy vs. Achieved & Asking Rates 3.78 3.46 2.5220152.82% 2.842.28% 3.22AchievedRate 3.6120161.44%1.66%2015Asking Rate201620172Q18 3.65 2.812.20% 2.97 3.1220177.42% 3.11 2.581.92% 3.07 2.572Q187.25% 3.30 1.75Asking RateVacancy Rate Asking RateSanta acancyRate RateGoleta 3.754.5% 3.75VacancyVacancyRate RateCarpinteria14%4.0% 3.5012% 4.503.5% 3.253.5% 3.2510% 4.003.0% 3.003.0% 3.008% 3.502.5% 2.752.5% 2.756% 3.002.0% 2.502.0% 2.504% 2.501.5% 2.251.5% 2.252%1.0% 2.001.0% 2.00 2.002011 2012 2013 2014 2015 2016 2017 2Q18Asking Rate2011 2012 2013 2014 2015 2016 2017 2Q18Achieved RateVacancy Rate2017 Retail Leases of NoteAsking RateVacancy Rate psf GR 3.50Vacancy4.0% psf GR 5.00Vacancy psf GR-19.7%3.2%4% 5.9%4%2011 2012 2013 2014 2015 2016 2017 2Q180%Asking RateAchieved RateVacancy RateVacancyMarketPage6Vacancy RateVacancy RateNotable Available Spaces701 State St, Santa Barbara135,000 sf former Macy’sLa Cumbre Plaza, Santa Barbara29,738 sf various spacesCalle Real Center, Goleta21,137 sf various spaces7035 Marketplace Dr, Goleta30,147 sf – HomeGoods928 State St, Santa Barbara18,743 sf – Apple, Inc187 S Turnpike Rd, Santa Barbara19,739 sf in Turnpike Shopping Center410 State St, Santa Barbara17,000 sf former Staples32 W Carrillo St10,026 sf former Greyhound site29 N Milpas St, Santa Barbara10,008 sf former Trader Joe’s185 S Patterson Ave, Goleta9,548 sf in Patterson Center400 State St, Santa Barbara6,750 sf – Habitat Home and Garden222 E. Carrillo Street, Suite 101Santa Barbara, CA 931011 State St, Santa Barbara3,660 sf – Due Lune805.563.2111HayesCommercial.com11 Anacapa St, Santa Barbara7,500 sf in Funk Zone
8Midyear Review6.11% 2.36 2.36 2.26 2.266.10% 2.43 2.43 2.36 2.364.96% 2.59 2.59 2.37 2.374.06% 2.85 2.85 2.56 2.564.37% 2.93 2.93 2.65 2.6520166.11% 2.376.10% 2.564.96% 2.654.06% 2.654.37% 2.664.38%4.38% 2.96 2.96 2.65 2.652Q175.41%5.41% 3.03 3.03 2.66 2.662011 2.592012 2.852013 2.932014 2.962015 3.03201620112Q172012201320142015INDUSTRIAL LEASING 3.00Available 2.50Santa Barbara16,741 2.00217,027GoletaCarpinteria46,730280,498Vacancy RateAsking Rate 1.28 1.00Change*6%Asking Rate8%8%Change*Achieved RateChange*24.0% 2.50 2.5047,899-39.6% 2.286%-10.0%6% 1.8424.8%56.9%4%-25.1% 1.65 1.6313.4% 1.3514.9%68,471133.7% 2.00 2.0014,909 1.50Totals8% 3.00 3.00GrossChange*Absorption63.2%-59.9%131,279-36.8% 1.50 1.50Achieved RateVacancy RateAsking Rate 1.712%5.0% 1.682%Achieved Rate19.3%Vacancy RateAsking RateAchieved Rate2011 1.247.41% 1.0720114.83% 0.960% 1.08 * Since 1/1/2018. Averagerate totalsare weightedby 0.96square footage.4.04% 0.94 0.952012 1.195.29% 1.2020122015 201620102011 2012 2013 20142Q17 1.202.59% 0.97 1.002013 1.332.42% 1.33 1.152013 1.00 1.000%0%2.90% 1.13 1.08 1.452.35% 1.37 1.2920142010 172016 2Q17201420111.70%20120.93% 1.1420130.56% 1.3720140.40% 1.5620150.29% 2.0320160.43% 1.95 1.7120170.28% 2.54 1.482Q180.35% 2.28 1.84Industrial Vacancy vs. Achieved & Asking Rates 1.66 1.33 1.2320152.17% 0.83 1.142.09% 1.60AchievedRate 1.2520163.04% 0.85 1.131.50% 1.40 1.173.51% 1.77 1.352.96%2015Asking Rate201620172Q183.27% 1.57 1.4420175.12% 1.65 1.632Q18Asking RateVacancy Rate Asking ncyRate RateSanta BarbaraVacancyVacancyRate RateCarpinteriaGoleta12% 2.0018% 2.002.5% 1.7510% 1.7515% 1.752.0% 1.508% 1.5012% 1.501.5% 1.256% 1.259% 1.251.0% 1.004% 1.006% 1.000.5% 0.752% 0.753% 0.750% 0.500% 0.502011 2012 2013 2014 2015 2016 2017 2Q18Asking Rate2011 2012 2013 2014 2015 2016 2017 2Q18Achieved RateVacancy Rate2017 Industrial Leases of NoteAsking RateVacancy Rate psf GR 2.00Vacancy3.0% psf GR 2.25Vacancy psf GR 1.772%5.1%4%26.2%4%2011 2012 2013 2014 2015 2016 2017 2Q18Asking RateAchieved RateVacancy RateVacancy RateVacancyMarketPage70%Achieved RateVacancy RateLargest Available Spaces340 Storke Rd, Goleta29,300 sf sublease30 S Calle Cesar Chavez, Santa Barbara25,570 sf sublease859 Ward Dr, Goleta24,412 sf80 Coromar Dr, Goleta57,600 sf – Curvature525 Maple Ave, Goleta13,509 sf – DSY Education Corp6384 Via Real, Carpinteria24,030 sf30 S La Patera Ln, Goleta23,000 sf153 Castilian Dr, Goleta22,001 sf5756 Thornwood Dr, Goleta20,794 sf550 Linden Ave, Carpinteria20,000 sf1 N Calle Cesar Chavez, Santa Barbara11,845 sf – US Air Conditioning222 E. Carrillo Street, Suite 101Santa Barbara, CA 931016485 Calle Real, Goleta4,395 sf – Szkutak Wine Ventures805.563.2111HayesCommercial.com879 Ward Dr, Goleta18,253 sf
Q22018Page8Midyear ReviewCOMMERCIAL SALES2017 Commercial Sales of NoteHighest Priced Properties For Sale7414-7418 Hollister AveGoleta Office 162,174 sf 33,500,000600 Pine AveGoleta Office/R&D 83,479 sf 22,950,0001001 State St, Santa Barbara 18,500,000Cabrillo Business ParkGoleta Land 490,050 sf 21,508,112701 State St, Santa Barbara 12,000,0001486 E Valley RdMontecito Retail 6,357 sf 18,395,333900 State St, Santa BarbaraSanta Barbara Retail 38,015 sf 17,700,0001001 Coast Village Rd, Montecito 7,700,000559 San Ysidro Rd, MontecitoMontecito Office 9,626 sf 12,750,0002580 Lillie Ave, Summerland 5,400,000Experience. Integrity. Trust.SINCE 1993Greg . 01131126Caitlin . 01893341Christos lic. 01342996Dan Moll805-898-4380dan@hayescommercial.comlic. 00885073222 E. Carrillo Street, Suite 101Santa Barbara, CA 93101Francois DeJohn805-898-4365fran@hayescommercial.comlic. 01144570Greg Moss805-898-4382gmoss@hayescommercial.comlic. 01069933805.563.2111HayesCommercial.comStephen Hayes805-898-4370steve@hayescommercial.comlic. 00827640Liam Murphy805-898-4385liam@hayescommercial.comlic. 01439777Kristopher Roth805-898-4361Michael Martz805-898-4363michael@hayescommercial.comlic. 01391838kris@hayescommercial.comlic. 01482732Dylan Ward805-898-4392dylan@hayescommercial.comlic. 01472452
purchased the warehouse property at 27 S La Patera Ln from Direct Relief . UCSB Economic Forecast Project's May report for Santa . Source: Hayes Commercial Group, US Retail data from REIS, Inc. Page 4 Q22018 Midyear Review E arr treet San bar A 805.563.2111 HayesCommercial.com