Transcription
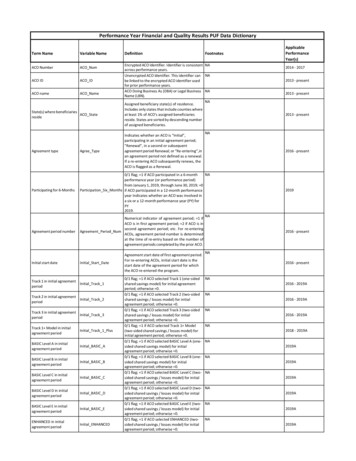
Performance Year Financial and Quality Results PUF Data DictionaryTerm NameVariable NameACO NumberACO NumACO IDACO IDACO nameACO NameState(s) where beneficiariesACO StateresideAgreement typeParticipating for 6-MonthsAgreement period numberInitial start dateAgree TypeDefinitionFootnotesEncrypted ACO Identifier. Identifier is consistent NAacross performance years.Unencrypted ACO Identifier. This identifier can NAbe linked to the encrypted ACO identifier usedfor prior performance years.ACO Doing Business As (DBA) or Legal Business NAName (LBN).NAAssigned beneficiary state(s) of residence.Includes only states that include counties whereat least 1% of ACO's assigned beneficiariesreside. States are sorted by descending numberof assigned beneficiaries.Indicates whether an ACO is “Initial”,participating in an initial agreement period;”Renewal”, in a second or subsequentagreement period Renewal; or “Re-entering”,inan agreement period not defined as a renewal.If a re-entering ACO subsequently renews, theACO is flagged as a Renewal.Initial Start DateTrack 1 in initial agreementInitial Track 1periodTrack 2 in initial agreementInitial Track 2periodTrack 3 in initial agreementInitial Track 3periodTrack 1 Model in initialagreement periodInitial Track 1 PlusBASIC Level A in initialagreement periodInitial BASIC ABASIC Level B in initialagreement periodInitial BASIC BBASIC Level C in initialagreement periodInitial BASIC CBASIC Level D in initialagreement periodInitial BASIC DBASIC Level E in initialagreement periodInitial BASIC EENHANCED in initialagreement periodInitial ENHANCED0/1 flag; 1 if ACO selected Track 1 (one-sidedshared savings model) for initial agreementperiod; otherwise 0.0/1 flag; 1 if ACO selected Track 2 (two-sidedshared savings / losses model) for initialagreement period; otherwise 0.0/1 flag; 1 if ACO selected Track 3 (two-sidedshared savings / losses model) for initialagreement period; otherwise 0.0/1 flag; 1 if ACO selected Track 1 Model(two-sided shared savings / losses model) forinitial agreement period; otherwise 0.0/1 flag; 1 if ACO selected BASIC Level A (onesided shared savings model) for initialagreement period; otherwise 0.0/1 flag; 1 if ACO selected BASIC Level B (onesided shared savings model) for initialagreement period; otherwise 0.0/1 flag; 1 if ACO selected BASIC Level C (twosided shared savings / losses model) for initialagreement period; otherwise 0.0/1 flag; 1 if ACO selected BASIC Level D (twosided shared savings / losses model) for initialagreement period; otherwise 0.0/1 flag; 1 if ACO selected BASIC Level E (twosided shared savings / losses model) for initialagreement period; otherwise 0.0/1 flag; 1 if ACO selected ENHANCED (twosided shared savings / losses model) for initialagreement period; otherwise 0.2014 - 20172013 - present2013 - present2013 - presentNA2016 - presentNA0/1 flag; 1 if ACO participated in a 6-monthperformance year (or performance period)from January 1, 2019, through June 30, 2019; 0Participation Six Months if ACO participated in a 12-month performanceyear Indicates whether an ACO was involved ina six or a 12-month performance year (PY) forPY2019.NANumerical indicator of agreement period; 1 ifACO is in first agreement period; 2 if ACO is insecond agreement period; etc. For re-enteringAgreement Period NumACOs, agreement period number is determinedat the time of re-entry based on the number ofagreement periods completed by the prior ACO.Agreement start date of first agreement period.For re-entering ACOs, initial start date is thestart date of the agreement period for whichthe ACO re-entered the program.ApplicablePerformanceYear(s)20192016 - presentNA2016 - presentNANANANANANANANANANA2016 - 2019A2016 - 2019A2016 - 2019A2018 - 2019A2019A2019A2019A2019A2019A2019A
Current start dateCurrent Start DateTrack 1 in currentperformance yearCurrent Track 1Track 2 in currentperformance yearCurrent Track 2Track 3 in currentperformance yearCurrent Track 3Track 1 Model in currentperformance yearCurrent Track 1 PlusBASIC Level A in currentperformance yearCurrent BASIC ABASIC Level B in currentperformance yearCurrent BASIC BBASIC Level C in currentperformance yearCurrent BASIC CBASIC Level D in currentperformance yearCurrent BASIC DBASIC Level E in currentperformance yearCurrent BASIC EENHANCED in currentperformance yearCurrent ENHANCEDAgreement start date of current agreementperiod. This will be the start date of the secondor subsequent start date for ACOs classified as aRenewal. This will be the start date of thecurrent agreement period for ACOs classified asre-entering.0/1 flag; 1 if ACO selected Track 1 (one-sidedshared savings model) for current performanceyear; otherwise 0.0/1 flag; 1 if ACO selected Track 2 (two-sidedshared savings / losses model) for currentperformance year; otherwise 0.0/1 flag; 1 if ACO selected Track 3 (two-sidedshared savings / losses model) for currentperformance year; otherwise 0.0/1 flag; 1 if ACO selected Track 1 Model(two-sided shared savings / losses model) forcurrent performance year; otherwise 0.0/1 flag; 1 if ACO selected BASIC Level A (onesided shared savings model) for currentperformance year; otherwise 0.0/1 flag; 1 if ACO selected BASIC Level B (onesided shared savings model) for currentperformance year; otherwise 0.0/1 flag; 1 if ACO selected BASIC Level C (twosided shared savings / losses model) for currentperformance year; otherwise 0.0/1 flag; 1 if ACO selected BASIC Level D (twosided shared savings / losses model) for currentperformance year; otherwise 0.0/1 flag; 1 if ACO selected BASIC Level E (twosided shared savings / losses model) for currentperformance year; otherwise 0.0/1 flag; 1 if ACO selected ENHANCED (twosided shared savings / losses model) for currentperformance year; otherwise 0.Risk ModelRisk ModelIndicates participation in a one-sided sharedsavings model or a two-sided sharedsavings/losses model for the performance year.Participate(d) in AdvancePayment ModelAdv Pay0/1 flag; 1 if ACO participates or participated inAdvance Payment Model; otherwise 0.Participate(d) in ACOInvestment ModelAIM0/1 flag; 1 if ACO participates or participated inACO Investment Model (AIM); otherwise 0.Participate in Skilled NursingSNF WaiverFacility (SNF) 3-Day RuleWaiverTotal Assigned Beneficiaries N ABSavings RateSav rateMinimum Savings Rate (%)MinSavPercBenchmark MinusExpendituresBnchmkMinExp0/1 flag; 1 if ACO participates in SNF 3-daywaiver; otherwise 0.NA2013 - presentNANANANANANANANANANA2013 - present2013 - present2016 - present2018 - present2019A - present2019A - present2019A - present2019A - present2019A - present2019A - presentNA2019 - presentNANANANumber of assigned beneficiaries, performance NAyear.Total Benchmark Expenditures Minus Assigned NABeneficiary Expenditures as a percent of TotalBenchmark Expenditures.NAIf ACO is in a one-sided model, the MinimumSavings Rate is determined on a sliding scalebased on the number of assigned beneficiaries.If ACO is in a two-sided model, the MinimumSavings Rate (MSR) / Minimum Loss Rate (MLR)selected by the ACO at the time of applicationto a two-sided model applies for the duration ofthe ACO’s agreement period. For such ACOs,the MSR and MLR can be set to: zero percent;symmetrical MSR/MLR in a 0.5 percentincrement between 0.5-2.0 percent; orsymmetrical MSR/MLR determined on a slidingscale based on the number of assignedbeneficiaries.Total Benchmark Expenditures Minus Assigned NABeneficiary Expenditures. If positive, representstotal savings. If negative, represents totallosses.2013 - present2016 - present2018 - present2013 - present2013 - present2013 - present2013 - present
Generated TotalSavings/LossesGenSaveLossExtreme and UncontrollableCircumstance Adjustment - DisAdjFinancialEarned Shared SavingsPayments/Owed LossesEarnSaveLossGenerated savings: Total savings (measured as NABenchmark Minus Expenditures, from first tolast dollar) for ACOs whose savings rate equaledor exceeded their MSR. This amount does notaccount for the application of the ACO’s finalsharing rate based on quality performance,reduction due to sequestration, application ofperformance payment limit, or repayment ofadvance payments. Generated losses: Totallosses (measured as Benchmark Minus AssignedExpenditures, from first to last dollar) for ACOsin two-sided models whose losses rate equaledor exceeded their MLR. This amount does notaccount for the application of the ACO’s finalsharing rate based on quality performance orthe loss sharing limit. Note that in the PY 2018,2019, and 2019A files, Generated losses wascalculated as: Total losses (measured asBenchmark Minus Assigned Expenditures, fromfirst to last dollar) for ACOs in two-sided modelswhose losses rate equaled or exceeded theirMLR and the negative of the MSR (for ACOs inone-sided models).If ACO is in one-sided model, blank (–). If ACO isin two-sided model with losses outside theirMLR, equal to shared losses after applying theloss sharing limit, multiplied by percentage ofbeneficiaries in counties affected by an Extremeand Uncontrollable Circumstance and share ofyear affected by an Extreme and UncontrollableCircumstance.Total earned shared savings: The ACO’s share ofsavings for ACOs whose savings rate equaled orexceeded their MSR, and who were eligible fora performance payment because they met theprogram’s quality performance standard. Thisamount accounts for the application of theACO’s final sharing rate based on qualityperformance (based on ACO track), as well asthe reduction in performance payment due tosequestration and application of theperformance payment limit. This amount doesnot account for repayment of advancepayments.2013 - presentNA2017 - presentNA2013 - presentTotal earned shared losses: The ACO’s share oflosses for ACOs in two-sided tracks whoselosses rate equaled or exceeded their MLR,which is the negative of the MSR chosen. Thisamount accounts for the application of theACO’s final loss sharing rate based on qualityperformance (based on ACO track) the losssharing limit and the Extreme andUncontrollable Circumstance adjustment.Extreme and UncontrollableDisAffQualCircumstance Affected Quality0/1 flag; 1 if at least 20% of assignedbeneficiaries (based on Q3 assignment for theperformance year) reside in a county affectedby an Extreme and Uncontrollable Circumstanceor ACO legal entity is located in such a county.Otherwise equal to 0. In 2019 and 2020, allACOs receive value of 1 due to the public healthemergency for COVID-19.NA2018 - present
Met the QualityPerformance StandardQuality ScoreMet QPS0/1 flag; 1 if ACO met the quality performancestandard; otherwise 0. An ACO must meet thequality performance standard to be eligible toshare in any savings generated. Any ACO thatdid not completely report quality data did notmeet the quality performance standard unlessthe ACO was determined to be impacted by anExtreme and Uncontrollable Circumstance. Thequality performance standard for ACOs in theirfirst performance year is based on completeand accurate reporting of all required qualitymeasures. ACOs beyond the first performanceyear of their first agreement period must alsomeet minimum attainment (which is the 30thpercentile benchmark for pay-for-performancemeasures and complete reporting for pay-forreporting measures) on at least one measure ineach domain. For ACOs determined to havebeen affected by an Extreme andUncontrollable Circumstance, the ACO willautomatically meet the quality performancestandard.QualScoreQuality score: In Performance Year 1 of anACO’s first agreement period, the quality scoreis 100% if all measures were completelyreported and less than 100% if one or moremeasures were not completely reported.Beyond Performance Year 1 of an ACO’s firstagreement period, the quality score will bedetermined not only by whether all measureswere completely reported but also on theirperformance against established benchmarksand on quality improvement. For ACOsdetermined to have been affected by anExtreme and Uncontrollable Circumstance, thequality score is the higher of the ACO'scalculated initial quality score or the nationalmean quality score across all Shared SavingsProgram ACOs who met the qualityperformance standard before application of theExtreme and Uncontrollable Circumstancespolicy.Extreme and UncontrollableCircumstance-Adjustment- RecvdMeanQuality0/1 flag; 1 if ACO was affected by an Extremeand Uncontrollable Circumstance and had aquality score equal to the national mean qualityscore across all Shared Savings Program ACOs. 0 if ACO was either not affected by an Extremeand Uncontrollable Circumstance or wasaffected by an Extreme and UncontrollableCircumstance and did not receive the meanquality score.NA2016 - presentNA2016 - presentNA2018 - present
Per Capita Prior SavingsAdjustment (Prorated)Prior Sav AdjPer Capita Prior Savings Adjustment (Prorated): NAThis applies only to ACOs with 2012 or 2013start dates that renewed for a secondagreement period in 2016; value is blank for allother ACOs. If average per capita savings(simple average of Total Historical Benchmarkminus Total Expenditures, not to exceed theperformance payment limit for the ACO's track,divided by assigned beneficiary person years foreach performance year in the first agreementperiod) in the first agreement period is greaterthan zero, then multiply average per capitasavings by average final sharing rate from firstagreement period (simple average of FinalSharing Rate based on quality performance foreach performance year in first agreementperiod). The additional per capita amount willbe applied to the ACOs rebased historicalbenchmark for a number of assignedbeneficiaries (expressed as person years) not toexceed the average number of assignedbeneficiaries (expressed as person years) underthe ACO’s first agreement period.Regional Trend and UpdateRegTrndUpdtFactors0/1 flag; 1 if benchmark trend and updatefactors are based on regional expenditures;otherwise 0.Positive RegionalAdjustmentPosRegAdj0/1 flag; 1 if ACO received a positive regionaladjustment to its historical benchmark(meaning ACO had lower spending than itsregion); otherwise 0 indicating ACO received anegative regional adjustment to its historicalbenchmark (meaning the ACO had higherspending than its region). This applies only toACOs that renewed for a second agreementperiod in 2017, 2018, or 2019, and to ACOs thatentered an agreement period beginning on orafter July 1, 2019; value is blank for all otherACOs.UpdatedBnchmkBenchmark expenditures are risk-adjusted inthe historical benchmark period andperformance period to account for changes inthe ACO's assigned populations over time.Updated benchmark also includes the projectedabsolute amount of growth in national percapita expenditures for Parts A and B servicesunder the original fee-for-service program (forACOs in a first agreement period from PY 1 - PY2019 and for ACOs that entered a secondagreement period in 2016), a regional updatefactor (for ACOs that entered a secondagreement period in 2017, 2018, or 2019), or ablended national-regional update factor (for allACOs that entered an agreement periodbeginning on or after July 1, 2019).HistBnchmkSingle per capita historical benchmark valuereflecting ACO’s applicable benchmarkingmethodology. For ACOs that entered a firstagreement in 2018 or prior years, thebenchmark is calculated using nationalassignable fee-for-service (FFS) expendituretrend factors. For ACOs that entered a secondagreement period in 2017, 2018 or January2019, the benchmark iscalculated using regionalassignable FFS expenditure trend factors andincorporates a regional adjustment. For ACOsthat entered an agreement period on or afterJuly 2019, the benchmark is calculated using ablend of national and regional assignable FFSexpenditure trend factors and incorporates aregional adjustment subject to a cap.Updated benchmarkexpendituresHistorical benchmarkNA2016 - 20192017 - presentNA2017 - presentNA2013 - presentNA2013 - present
Total benchmarkexpendituresABtotBnchmkTotal expendituresABtotExpAdvance payment amountAdv Pay AmtAdvance paymentrecoupmentAdv Pay RecoupQuality sharing rateQualPerfShareFinal sharing rateFinalShareRateRevenue-based loss sharingRevLossLimitlimitIndicates whether a high orRev Exp Catlow revenue ACOPer capita benchmark (UpdatedBnchmk)multiplied by total person years (N AB Year).Per capita performance year expenditures(Per Capita Exp TOTAL) multiplied by totalperson years (N AB Year).Maximum amount of advance payment/AIMavailable for recoupment at the time offinancial reconciliation.Amount of advance payment/AIM actuallyrecouped at the time of financial reconciliation.Populated for advance payment/AIM ACOs thatshared savings and is no greater than themaximum amount owed.NANANAAnnualized, truncated, weighted mean totalPer capita AGED/NON-DUALPer Capita Exp ALL AGNexpenditures per AGED/NON-DUAL assignedexpenditures in benchmarkD BY1beneficiary person years in benchmark year 1.year 1Per capita ESRDAnnualized, truncated, weighted mean totalPer Capita Exp ALL ESRexpenditures in benchmarkexpenditures per ESRD assigned beneficiaryD BY2year 2person years in benchmark year 2.2013 - present2013 - present2013 - present2013 - present2018 - presentNA2018 - presentPer capita ESRDAnnualized, truncated, weighted mean totalNAPer Capita Exp ALL ESRexpenditures in benchmarkexpenditures per End-Stage Renal Disease (ESRD)D BY1year 1assigned beneficiary person years in benchmarkyear 1.NAAnnualized, truncated, weighted mean totalPer capita DISABLEDPer Capita Exp ALL DISexpenditures per DISABLED assignedexpenditures in benchmarkBY1beneficiary person years in benchmark year 1.year 1Per capita AGED/DUALAnnualized, truncated, weighted mean totalPer Capita Exp ALL AGDexpenditures in benchmarkexpenditures per AGED/DUAL assignedU BY1year 1beneficiary person years in benchmark year 1.2013 - presentNAMaximum percentage of savings an ACO canNAshare based on the ACO’s track, beforeaccounting for quality performance. Set to 40%for BASIC Track Levels A and B, 50% for Track 1,Track 1 Model and BASIC Track Levels C, D,and E, 60% for Track 2, and 75% for Track3/ENHANCED Track.Quality performance sharing rateNA(QualPerfShare) multiplied by quality score(QualScore). The percentage of savings an ACOshares if the ACO is eligible for shared savings.Will equal zero if ACO failed to meet qualityperformance standard.NA0/1 flag; 1 if ACO is subject to a revenue-basedloss sharing limit; Otherwise 0. A Track 1 Model is subject to a revenue-based losssharing limit if none of the following criteria aremet: the ACO includes an ACO participant thatis an inpatient prospective payment system(IPPS) hospital, cancer center, or a rural hospitalwith more than 100 beds, or is owned oroperated by, in whole or in part, such a hospitalor by an organization that owns or operatessuch a hospital. If any of these criteria are met,the Track 1 Model ACO is subject to abenchmark-based loss sharing limit. ACOs inBASIC Track Level C, Level D, and Level E aresubject to a revenue-based loss sharing limit.If ACO participant total Medicare Parts A and BFFS revenue for the performance year is lessthan 35% of the total Medicare Parts A and BFFS expenditures for the ACO’s assignedbeneficiaries for the performance year, “LowRevenue”. If ACO participant total MedicareParts A and B FFS revenue for the performanceyear is 35% or more of the total Medicare PartsA and B FFS expenditures for the ACO’sassigned beneficiaries for the performanceyear, “High Revenue”.2013 - present2013 - present2013 - presentNA2013 - presentNA2013 - presentNA2013 - present
Annualized, truncated, weighted mean totalPer capita DISABLEDPer Capita Exp ALL DISexpenditures per DISABLED assignedexpenditures in benchmarkBY2beneficiary person years in benchmark year 2.year 2Annualized, truncated, weighted mean totalPer capita AGED/DUALPer Capita Exp ALL AGDexpenditures per AGED/DUAL assignedexpenditures in benchmarkU BY2beneficiary person years in benchmark year 2.year 2Annualized, truncated, weighted mean totalPer capita AGED/NON-DUALPer Capita Exp ALL AGNexpenditures per AGED/NON-DUAL assignedexpenditures in benchmarkD BY2beneficiary person years in benchmark year 2.year 2Per capita ESRDAnnualized, truncated, weighted mean totalPer Capita Exp ALL ESRexpenditures in benchmarkexpenditures per ESRD assigned beneficiaryD BY3year 3person years in benchmark year 3.Annualized, truncated, weighted mean totalPer capita DISABLEDPer Capita Exp ALL DISexpenditures per DISABLED assignedexpenditures in benchmarkBY3beneficiary person years in benchmark year 3.year 3Annualized, truncated, weighted mean totalPer capita AGED/DUALPer Capita Exp ALL AGDexpenditures per AGED/DUAL assignedexpenditures in benchmarkU BY3beneficiary person years in benchmark year 3.year 3Annualized, truncated, weighted mean totalPer capita AGED/NON-DUALPer Capita Exp ALL AGNexpenditures per AGED/NON-DUAL assignedexpenditures in benchmarkD BY3beneficiary person years in benchmark year 3.year 3Per capita ESRDexpenditures inperformance yearAnnualized, truncated, weighted mean totalPer Capita Exp ALL ESRexpenditures per ESRD assigned beneficiaryD PYperson years in the performance year.Annualized, truncated, weighted mean totalPer capita DISABLEDPer Capita Exp ALL DIS expenditures per DISABLED assignedexpenditures inPYbeneficiary person years in the performanceperformance yearyear.Annualized, truncated, weighted mean totalPer capita AGED/DUALPer Capita Exp ALL AGD expenditures per AGED/DUAL assignedexpenditures inU PYbeneficiary person years in the performanceperformance yearyear.Annualized, truncated, weighted mean totalPer capita AGED/NON-DUALPer Capita Exp ALL AGN expenditures per AGED/NON-DUAL assignedexpenditures inD PYbeneficiary person years in the performanceperformance yearyear.Annualized, truncated, weighted mean totalPer capita ALL expenditures Per Capita Exp TOTAL Pexpenditures per assigned beneficiary personin performance yearYyears in the performance year.Average ESRD HCC riskscore in benchmark year 1CMS HCC RiskScore ESR Final, mean prospective CMS- HierarchicalD BY1Condition Category (HCC) risk score forESRDenrollment type in benchmark year 1.Average DISABLED HCC risk CMS HCC RiskScore DIS Final, mean prospective CMS-HCC risk score forscore in benchmark year 1 BY1DISABLED enrollment type in benchmark year 1.Average AGED/DUAL HCCrisk score in benchmarkyear 1Average AGED/NON-DUALHCC risk score in benchmarkyear 1Average ESRD HCC riskscore in benchmark year 2Average ESRD HCC riskscore in benchmark year 32013 - presentNA2013 - presentNA2013 - presentNA2013 - presentNA2013 - presentNA2013 - presentNA2013 - presentNA2013 - presentNA2013 - presentNA2013 - presentNANANAFinal, mean prospective CMS-HCC risk score for NAAGED/DUAL enrollment type in benchmark year1.Final, mean prospective CMS-HCC risk score for NACMS HCC RiskScore AGAGED/NON-DUAL enrollment type inND BY1benchmark year 1.NACMS HCC RiskScore ESR Final, mean prospective CMS-HCC risk score forD BY2ESRD enrollment type in benchmark year 2.NAFinal, mean prospective CMS-HCC risk score for NAAGED/DUAL enrollment type in benchmark year2.Final, mean prospective CMS-HCC risk score for NACMS HCC RiskScore AGAGED/NON-DUAL enrollment type inND BY2benchmark year 2.NACMS HCC RiskScore ESR Final, mean prospective CMS-HCC risk score forD BY3ESRD enrollment type in benchmark year 3.CMS HCC RiskScore AGDU BY2Average DISABLED HCC risk CMS HCC RiskScore DIS Final, mean prospective CMS-HCC risk score forscore in benchmark year 3 BY3DISABLED enrollment type in benchmark year 3.2013 - presentNACMS HCC RiskScore AGDU BY1Average DISABLED HCC risk CMS HCC RiskScore DIS Final, mean prospective CMS-HCC risk score forscore in benchmark year 2 BY2DISABLED enrollment type in benchmark year 2.Average AGED/DUAL HCCrisk score in benchmarkyear 2Average AGED/NON-DUALHCC risk score in benchmarkyear 2NANA2013 - present2013 - present2013 - present2013 - present2013 - present2013 - present2013 - present2013 - present2013 - present2013 - present2013 - present
Average AGED/DUAL HCCrisk score in benchmarkyear 3Average AGED/NON-DUALHCC risk score in benchmarkyear 3Average ESRD HCC riskscore in performance yearFinal, mean prospective CMS-HCC risk score for NAAGED/DUAL enrollment type in benchmark year3.Final, mean prospective CMS-HCC risk score for NACMS HCC RiskScore AGAGED/NON-DUAL enrollment type inND BY3benchmark year 3.NACMS HCC RiskScore ESR Final, mean prospective CMS-HCC risk score forD PYESRD enrollment type in the performance year.CMS HCC RiskScore AGDU BY3Final, mean prospective CMS-HCC risk score for NAAverage DISABLED HCC risk CMS HCC RiskScore DISDISABLED enrollment type in the performancescore in performance year PYyear.Final, mean prospective CMS-HCC risk score for NAAverage AGED/DUAL HCCCMS HCC RiskScore AGAGED/DUAL enrollment type in therisk score in performanceDU PYperformance year.yearFinal, mean prospective CMS-HCC risk score for NAAverage AGED/NON-DUALCMS HCC RiskScore AGAGED/NON-DUAL enrollment type in theHCC risk score inND PYperformance year.performance yearNANumber of assigned beneficiaries with ESRDenrollment type in benchmark year 3 adjustedESRD person years inN AB Year ESRD BY3for the total number of months that eachbenchmark year 3beneficiary was classified as ESRD; Number ofESRD person-months divided by 12.DISABLED person years inbenchmark year 3AGED/DUAL person yearsin benchmark year 3AGED/NON-DUAL personyears in benchmark year 3Number of assigned beneficiaries withNADISABLED enrollment type in benchmark year 3adjusted for the total number of months thatN AB Year DIS BY3each beneficiary was classified as DISABLED;Number of DISABLED person-months divided by12.Number of assigned beneficiaries withNAAGED/DUAL enrollment type in benchmark yearN AB Year AGED Dual 3 adjusted for the total number of months thatBY3each beneficiary was classified as AGED/DUAL;Number of AGED/DUAL person-months dividedby 12.NANumber of assigned beneficiaries withAGED/NON-DUAL enrollment type inN AB Year AGED NonD benchmark year 3 adjusted for the total numberual BY3of months that each beneficiary was classifiedas AGED/NON-DUAL; Number of AGED/NONDUAL person-months divided by 12.Total person years inperformance yearN AB Year PYESRD person years inperformance yearN AB Year ESRD PYNumber of assigned beneficiaries in theNAperformance year adjusted downwards forbeneficiaries with less than a full 12 months ofeligibility; Number of person-months divided by12.NANumber of assigned beneficiaries with ESRDenrollment type in the performance yearadjusted for the total number of months thateach beneficiary was classified as ESRD;Number of ESRD person-months divided by 12.Number of assigned beneficiaries withNADISABLED enrollment type in the performanceDISABLED person years inyear adjusted for the total number of monthsN AB Year DIS PYperformance yearthat each beneficiary was classified asDISABLED; Number of DISABLED person-monthsdivided by 12.Number of assigned beneficiaries withNAAGED/DUAL enrollment type in theAGED/DUAL person-- years N AB Year AGED Dual performance year adjusted for the total numberin performance yearPYof months that each beneficiary was classifiedas AGED/DUAL; Number of AGED/DUAL personmonths divided by 12.NANumber of assigned beneficiaries withAGED/NON-DUAL enrollment type in theAGED/NON-DUAL personN AB Year AGED NonD performance year adjusted for the total numberof months that each beneficiary was classifiedyears in performance year ual PYas AGED/NON-DUAL; Number of AGED/NONDUAL person-months divided by 12.2013 - present2013 - present2013 - present2013 - present2013 - present2013 - present2013 - present2013 - present2013 - present2013 - present2013 - present2013 - present2013 - present2013 - present2013 - present
Total assigned beneficiaries,N Ben Age 0 64age 0-64Total number of assigned beneficiaries, age 064 in the calendar year (CY); age calculated asof February 1 of the calendar year. Based onmostcurrent date of birth in Medicare records.Total assigned beneficiaries,N Ben Age 65 74age 65-74Total number of assigned beneficiaries, age 6574 in the calendar year; age calculated as ofFebruary 1 of the calendar year. Based on mostcurrent date of birth in Medicare records.Total assigned beneficiaries,N Ben Age 75 84age 75-84Total number of assigned beneficiaries, age 7584 in the calendar year; age calculated as ofFebruary 1 of the calendar year. Based on mostcurrent date of birth in Medicare records.Total assigned beneficiaries,N Ben Age 85plusage 85 Total number of assigned beneficiaries, age 85 in the calendar year age calculated as ofFebruary 1 of the calendar year. Based on mostcurrent date of birth in Medicare records.Total assigned beneficiaries,N Ben FemalefemaleTotal number of assigned beneficiaries, female(Gender 2) in the calendar year. Based on mostcurrent gender in Medicare records.Total assigned beneficiaries,N Ben MalemaleTotal assigned beneficiaries,N Ben Race WhiteNon-Hispanic WhiteTotal assigned beneficiaries,N Ben Race BlackBlackTotal assigned beneficiaries,N Ben Race AsianAsianTotal assigned beneficiaries,N Ben Race HispHispanicTotal assigned beneficiaries,N Ben Race NativeNorth American NativeTotal assigned beneficiaries,N Ben Race OtherOtherTotal Inpatient expenditures CapAnn INP AllTotal number of assigned beneficiaries, male(Gender 1) in the calendar year. Based on mostcurrent gender in Medicare records.Total number of assigned beneficiaries, NonHispanic White (Race 1) in the calendar year.Based on most current race in Medicarerecords.Total number of assigned beneficiaries, Black(Race 2) in the calendar year. Based on mostcurrent race in Medicare records.Total number of assigned beneficiaries, Asian(Race 4) in the calendar year. Based on mostcurrent race in Medicare records.Total number of assigned beneficiaries, Hispanic(Race 5) in the calendar year. Based on mostcurrent
agreement period Renewal; or "Re-entering",in an agreement period not defined as a renewal. If a re-entering ACO subsequently renews, the ACO is flagged as a Renewal. NA : 2016 - present . Participatingfor 6-Months . Participation_Six_Months . 0/1 flag; 1 if ACO participated in a 6 -month performance year (or performance period)