Transcription
1Atomic Absorption Spectrometry (AAS)R. García and A. P. BáezCentro de Ciencias de la Atmósfera, Universidad Nacional Autónoma de México,Ciudad Universitaria, Mexico CityMexico1. IntroductionAtomic Absorption Spectrometry (AAS) is a technique for measuring quantities of chemicalelements present in environmental samples by measuring the absorbed radiation by thechemical element of interest. This is done by reading the spectra produced when the sampleis excited by radiation. The atoms absorb ultraviolet or visible light and make transitions tohigher energy levels. Atomic absorption methods measure the amount of energy in the formof photons of light that are absorbed by the sample. A detector measures the wavelengths oflight transmitted by the sample, and compares them to the wavelengths which originallypassed through the sample. A signal processor then integrates the changes in wavelengthabsorbed, which appear in the readout as peaks of energy absorption at discretewavelengths. The energy required for an electron to leave an atom is known as ionizationenergy and is specific to each chemical element. When an electron moves from one energylevel to another within the atom, a photon is emitted with energy E. Atoms of an elementemit a characteristic spectral line. Every atom has its own distinct pattern of wavelengths atwhich it will absorb energy, due to the unique configuration of electrons in its outer shell.This enables the qualitative analysis of a sample. The concentration is calculated based onthe Beer-Lambert law. Absorbance is directly proportional to the concentration of theanalyte absorbed for the existing set of conditions. The concentration is usually determinedfrom a calibration curve, obtained using standards of known concentration. However,applying the Beer-Lambert law directly in AAS is difficult due to: variations in atomizationefficiency from the sample matrix, non-uniformity of concentration and path length ofanalyte atoms (in graphite furnace AA).The chemical methods used are based on matter interactions, i.e. chemical reactions. For along period of time these methods were essentially empirical, involving, in most cases, greatexperimental skills. In analytical chemistry, AAS is a technique used mostly for determiningthe concentration of a particular metal element within a sample. AAS can be used to analyzethe concentration of over 62 different metals in a solution.Although AAS dates to the nineteenth century, the modern form of this technique waslargely developed during the 1950s by Alan Walsh and a team of Australian chemistsworking at the CSIRO (Commonwealth Science and Industry Research Organization)Division of Chemical Physics in Melbourne, Australia. Typically, the technique makes use ofa flame to atomize the sample, but other atomizers, such as a graphite furnace, are also used.Three steps are involved in turning a liquid sample into an atomic gas:www.intechopen.com
2Atomic Absorption Spectroscopy1. Desolvation – the liquid solvent is evaporated, and the dry sample remains;2. Vaporization – the solid sample vaporizes to a gas; and3. Volatilization – the compounds that compose the sample are broken into free atoms.To measure how much of a given element is present in a sample, one must first establish abasis for comparison using known quantities of that element to produce a calibration curve.To generate this curve, a specific wavelength is selected, and the detector is set to measureonly the energy transmitted at that wavelength. As the concentration of the target atom inthe sample increases, the absorption will also increase proportionally. A series of samplescontaining known concentrations of the compound of interest are analyzed, and thecorresponding absorbance, which is the inverse percentage of light transmitted, is recorded.The measured absorption at each concentration is then plotted, so that a straight line canthen be drawn between the resulting points. From this line, the concentration of thesubstance under investigation is extrapolated from the substance’s absorbance. The use ofspecial light sources and the selection of specific wavelengths allow for the quantitativedetermination of individual components in a multielement mixture.2. Basic principleThe selectivity in AAS is very important, since each element has a different set of energylevels and gives rise to very narrow absorption lines. Hence, the selection of themonochromator is vital to obtain a linear calibration curve (Beers' Law), the bandwidth ofthe absorbing species must be broader than that of the light source; which is difficult toachieve with ordinary monochromators. The monochromator is a very important part of anAA spectrometer because it is used to separate the thousands of lines generated by all of theelements in a sample.Without a good monochromator, detection limits are severely compromised. Amonochromator is used to select the specific wavelength of light that is absorbed by thesample and to exclude other wavelengths. The selection of the specific wavelength of lightallows for the determination of the specific element of interest when it is in the presence ofother elements. The light selected by the monochromator is directed onto a detector,typically a photomultiplier tube, whose function is to convert the light signal into anelectrical signal proportional to the light intensity. The challenge of requiring the bandwidthof the absorbing species to be broader than that of the light source is solved with radiationsources with very narrow lines.The study of trace metals in wet and dry precipitation has increased in recent decadesbecause trace metals have adverse environmental and human health effects. Some metals,such as Pb, Cd and Hg, accumulate in the biosphere and can be toxic to living systems.Anthropogenic activities have substantially increased trace metal concentrations in theatmosphere. In addition, acid precipitation promotes the dissolution of many trace metals,which enhances their bioavailability. In recent decades, heavy metal concentrations haveincreased not only in the atmosphere but also in pluvial precipitation. Metals, such as Pb,Cd, As, and Hg, are known to accumulate in the biosphere and to be dangerous for livingorganisms, even at very low levels. Many human activities play a major role in global andregional trace element budgets. Additionally, when present above certain concentrationlevels, trace metals are potentially toxic to marine and terrestrial life. Thus, biogeochemicalperturbations are a matter of crucial interest in science.The atmospheric input of metals exhibits strong temporal and spatial variability due to shortatmospheric residence times and meteorological factors. As in oceanic chemistry, the impact ofwww.intechopen.com
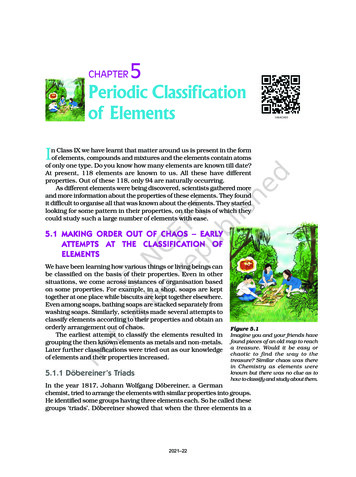
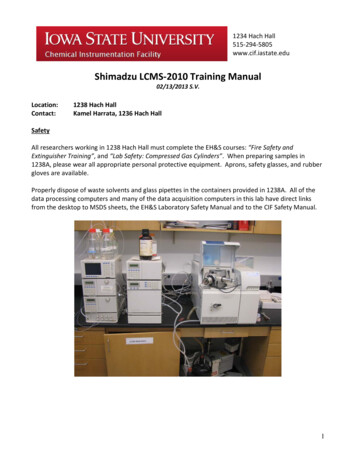
Atomic Absorption Spectrometry (AAS)3trace metals in atmospheric deposition cannot be determined from a simple consideration ofglobal mass balance; rather, accurate data on net air or sea fluxes for specific regions are needed.Particles in urban areas represent one of the most significant atmospheric pollution problems,and are responsible for decreased visibility and other effects on public health, particularlywhen their aerodynamic diameters are smaller than 10 µm, because these small particles canpenetrate deep into the human respiratory tract. There have been many studies measuringconcentrations of toxic metals such as Ag, As, Cd, Cr, Cu, Hg, Ni, Pb in rainwater and theirdeposition into surface waters and on soils. Natural sources of aerosols include terrestrial dust,marine aerosols, volcanic emissions and forest fires. Anthropogenic particles, on the otherhand, are created by industrial processes, fossil fuel combustion, automobile mufflers, wornengine parts, and corrosion of metallic parts. The presence of metals in atmospheric particlesare directly associated with health risks of these metals. Anthropogenic sources havesubstantially increased trace metal concentrations in atmospheric deposition.The instrument used for atomic absorption spectrometry can have either of two atomizers.One attachment is a flame burner, which uses acetylene and air fuels. The secondattachment consists of a graphite furnace that is used for trace metal analysis. Figure 1depicts a diagram of an atomic absorption spectrometer.Fig. 1. The spectral, or wavelength, range captures the dispersion of the grating across thelinear array.Flame and furnace spectroscopy has been used for years for the analysis of metals. Todaythese procedures are used more than ever in materials and environmental applications. Thisis due to the need for lower detection limits and for trace analysis in a wide range ofsamples. Because of the scientific advances of Inductively Coupled Plasma Optical Emissionwww.intechopen.com
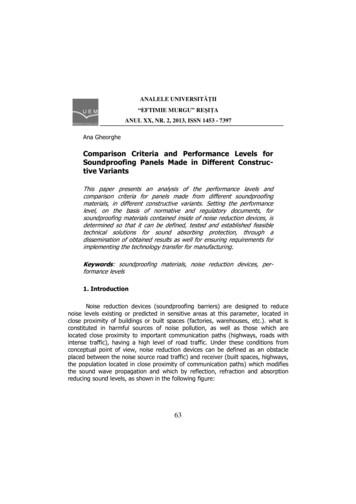
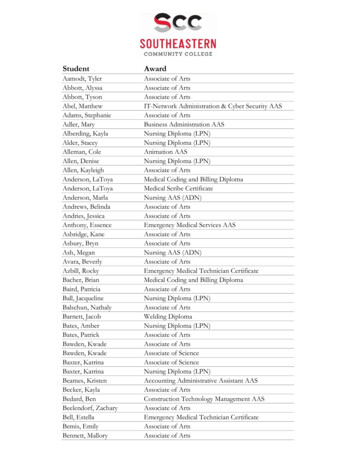
4Atomic Absorption SpectroscopySpectroscopy (ICP-OES), Inductively Coupled Plasma Mass Spectrometry (ICP-MS), haveleft Atomic Absorption (AA) behind. This technique, however, is excellent and has a largerspecificity that ICP does not have. Figure 2 shows a diagram of an atomic absorptionspectrometer with a graphite furnace.Fig. 2. Flame relatively insensitive - incomplete volatilization, short time in beam (Figure 1)In this section, the authors will attempt to demonstrate that AAS is a reliable chemicaltechnique to analyze almost any type of material. The chapter describes the basic principlesof atomic absorption spectroscopy in the analysis of trace metals, such as Ag, As, Cd, Cr, Cu,www.intechopen.com
Atomic Absorption Spectrometry (AAS)5and Hg, in environmental samples. For example, the study of trace metals in wet and dryprecipitation has increased in recent decades because trace metals have adverseenvironmental and human health effects. Anthropogenic activities have substantiallyincreased trace metal concentrations in the atmosphere. In recent decades, heavy metalconcentrations have increased not only in the atmosphere but also in pluvial precipitation.Many human activities play a major role in global and regional trace element budgets.Additionally, when present above certain concentration levels, trace metals are potentiallytoxic to marine and terrestrial life. Thus, biogeochemical perturbations are a matter ofcrucial interest in science.The atmospheric input of metals exhibits strong temporal and spatial variability due to shortatmospheric residence times and meteorological factors. As in oceanic chemistry, the impactof trace metals in atmospheric deposition cannot be determined from a simple considerationof global mass balance; rather, accurate data on net air or sea fluxes for specific regions areneeded.Particles in urban areas represent one of the most significant atmospheric pollutionproblems, and are responsible for decreased visibility and other effects on public health,particularly when their aerodynamic diameters are smaller than 10 µm, because these smallparticles can penetrate deep into the human respiratory tract. There have been many studiesmeasuring concentrations of toxic metals such as Ag, As, Cd, Cr, Cu, Hg, Ni, Pb in rainwaterand their deposition into surface waters and on soils. Natural sources of aerosols includeterrestrial dust, marine aerosols, volcanic emissions and forest fires. Anthropogenicparticles, on the other hand, are created by industrial processes, fossil fuel combustion,automobile mufflers, worn engine parts, and corrosion of metallic parts. The presence ofmetals in atmospheric particles and the associated health risks of these metals.Anthropogenic sources have substantially increased trace metal concentrations inatmospheric deposition. In addition, acid precipitation favors the dissolution of many tracemetals, which enhances their bioavailability. Trace metals from the atmosphere aredeposited by rain, snow and dry fallout. The predominant processes of deposition by rainare rainout and washout (scavenging). Generally, in over 80 % of wet precipitation, heavymetals are dissolved in rainwater and can thus reach and be taken up by the vegetationblanket and soils. Light of a specific wavelength, selected appropriately for the elementbeing analyzed, is given off when the metal is ionized in the flame; the absorption of thislight by the element of interest is proportional to the concentration of that element.Quantification is achieved by preparing standards of the element. AAS intrinsically more sensitive than Atomic Emission Spectrometry (AES) Similar atomization techniques to AES Addition of radiation source High temperature for atomization necessary Flame and electrothermal atomization Very high temperature for excitation not necessary; generally no plasma/arc/spark inAAS3. Flame (AAS)Flame atomic absorption methods are referred to as direct aspiration determinations. Theyare normally completed as single element analyses and are relatively free of interelementwww.intechopen.com
6Atomic Absorption Spectroscopyspectral interferences. For some elements, the temperature or type of flame used is critical. Ifflame and analytical conditions are not properly used, chemical and ionization interferencescan occur. Different flames can be achieved using different mixtures of gases, depending onthe desired temperature and burning velocity. Some elements can only be converted toatoms at high temperatures. Even at high temperatures, if excess oxygen is present, somemetals form oxides that do not redissociate into atoms. To inhibit their formation, conditionsof the flame may be modified to achieve a reducing, nonoxidizing flame. Some aspects arediscussed below: Simplest atomization of gas/solution/solid Laminar flow burner - stable "sheet" of flame Flame atomization best for reproducibility (precision) ( 1%) Relatively insensitive – incomplete volatilization, short time in beamUsually the measurement of metals can be done by an appropriate selection of one of themethods given below. During the analysis of the data, the interference and backgroundshould be considered. Three pattern-matching methods are most often employed:using calibration curves generated by a series of patterns, the method of standardadditions and the internal standard method. The use of calibration curves from a series ofpatterns is possibly the most widely used method. It involves measuring the sample ofinterest in a series of samples of known concentration and all prepared under the sameconditions.1. Calibration Curve Method: Prepare standard solutions of at least three differentconcentrations, measure the absorbance of these standard solutions, and prepare acalibration curve from the values obtained. Then measure the absorbance of the testsolution adjusted in concentration to a measurable range, and determine theconcentration of the element from the calibration curve.2. Standard Addition Method: To equal volumes of more than two different test solutionsare used, then the standard solution is added so that the solutions contain stepwiseincreasing amounts of the element, and add the solvent to make a definite volume.Measure the absorbance for each solution, and plot the concentration of the addedstandard element on the abscissa and the absorbance on the ordinate. Extend thecalibration curve obtained by linking the plotted points, and determine theconcentration of the element from the distance between the origin and the intersectionof the calibration curve on the abscissa. This method is applicable only in the case thatthe calibration curve drawn as directed in (1) above passes through the origin.3. Internal Standard Method: Prepare several solutions containing a constant amount of theinternal standard element. Using these solutions, measure the absorbance of the standardelement and the absorbance of the internal standard element at the analytical wavelengthof each element under the same measuring conditions, and obtain the ratios of eachabsorbance of the standard object element to the absorbance of the internal standardelement. Prepare a calibration curve by plotting the concentrations of the standardelement on the abscissa and the ratios of absorbance on the ordinate. Then prepare the testsolutions, adding the same amount of the internal standard element as in the standardsolution. Proceed under the same conditions as for preparing the calibration curve, obtainthe ratio of the absorbance of the element to that of the internal standard element, anddetermine the concentration of the element from the calibration curve.www.intechopen.com
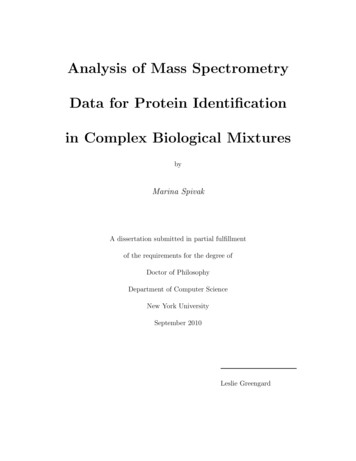
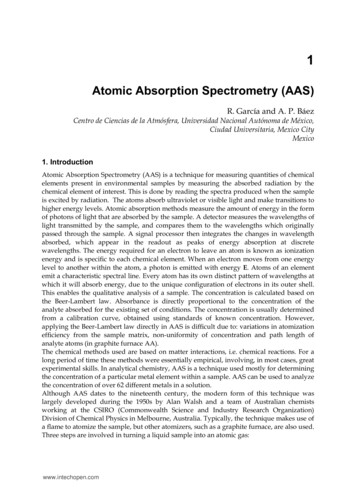
Atomic Absorption Spectrometry (AAS)7The calibration curve is always represented with the response of the instrument on thevertical (y) and concentrations on the horizontal axis (x). The value of C can limit theaccuracy of the measurements for various concentrations; however there are statisticalmethods which can be used. The calibration method is generally used where there is a linearrelationship between the analytical signal (y) and concentration (x), taking precautions toensure that linearity in the experimental response is maintained over a wide range ofconcentrations. In these cases the way to proceed is to obtain the regression line of y on x (ie,the best-fit straight line through the points of the calibration graph, which can be obtained,for example, by the method of least squares) and used to estimate the concentration ofunknown samples by interpolation, as well as to estimate the detection limit of the analyticalprocedure. Atomic absorption spectrometers allow operators to adjust sample temperatures. Somespectrometers are self-calibrating, position lights automatically, or compensate for straylight emissions and various types of spectral interference that bias analytical results.Intrinsically safe (IS) instruments do not release sufficient electrical or thermal energy toignite hazardous atmospheric mixtures. In flame AAS, the measured absorbance dependson the absorptivity of the element in question, the concentration of that element in theflame (and therefore on its solution concentration), and the optical path length throughthe flame. The light from the flame region is collected on the left-side of this particularinstrument. Under certain circumstances, it is desireable to reduce the optical path length.To this end, the burner head can also be rotated about its vertical axis. Different burnerheads (having different slot sizes) are used for acetylene/air and acetylene/nitrous oxideflames, since the latter is a much hotter flame. Flow controls also allow both the total gasflow-rate and fuel-to-oxidant ratio to be varied. Gas flow affects the aspiration rate andaerosol drop-size distribution, while the fuel-oxidant ratio can influence chemicalprocesses in the flame that would otherwise reduce the sensitivity of the measurement.Following you can describe some features of this technique: Primary combustion zone - initial decomposition, molecular fragments, cool Interzonal region – hottest, most atomic fragments, used for emission/fluorescence Secondary combustion zone – cooler, conversion of atoms to stable molecules, oxides element rapidly oxidizes – largest atom near burner element oxidizes poorly – largest atom away from burner most sensitive part of flame for AAS varies with analyte (Figure 3)The measurement procedure is as follows. A small quantity of the extracted sample isinjected into a flame where the ions are reduced to elements and vaporized. The elementspresent in the sample absorb light at specific wavelengths in the visible or the ultravioletspectrum. A light beam with a single specific wavelength for the element being measured isdirected through the flame to be detected by a monochrometer.The light absorbed by the flame containing the extract is compared with the absorption fromknown standards to quantify the elemental concentrations. One of the disadvantages of thismethod is that only one element can be quantified at a time. AAS requires an individualanalysis for each element, and sometimes a large filter or several filters are needed to obtainconcentrations for a large variety of elements. Samples having high concentrations ofelements beyond the linear range of the instrument should be diluted prior to the analysis.Báez et al., 2007 and García et al., 2009 characterized atmospheric aerosols, metals and ionswww.intechopen.com
8Atomic Absorption Spectroscopythat play an important role in the content of chemical species and of many elements inatmospheric ecosystem interfaces. Sodium, K , Ca2 and Mg2 were analyzed with a doublebeam atomic absorption spectrophotometer. Deuterium and hollow cathode lamps (PhotronSuper lamp) were used for background correction and analysis.Calibration standards were prepared under a laminar flux hood, using certified standardsfor each ion (High-Purity Standards traceable from the National Institute of Standards andTechnology, NIST).Fig. 3. Spectrometers element rapidly oxidizes - largest atom near burnerA calibration curve was used to determine the unknown concentration of an element in asolution. The instrument was calibrated using several solutions of known concentrations.The absorbance of each known solution was measured and then a calibration curve ofconcentration vs. absorbance was plotted.The sample solution was fed into the instrument, and the absorbance of the element in thissolution was measured. The unknown concentration of the element was then calculatedfrom the calibration curve. The concentration of the analyte element was considered to bewww.intechopen.com
Atomic Absorption Spectrometry (AAS)9proportional to the ground state atom population in the flame; any factor that affected theground state atom population was classified as interference.Factors that might affected the ability of the instrument to read this parameter were alsoclassified as interference.The different types of interference that were encountered in atomic absorption spectroscopywere:Absorption of source radiation: an element other than the one of interest may absorbthe wavelength being used.Ionization interference: the formation of ions rather than atoms causes lower absorptionof radiation. This problem is overcome by adding ionization suppressors.Self absorption: atoms of the same kind as those that are absorbing radiation will absorbmore at the center of the line than at the edges, thus resulting in a change of shape andintensity of the line.Background absorption of source radiation: This is caused by the presence of a particlefrom incomplete atomization. This problem is overcome by increasing the flametemperature.Rate of aspiration, nebulization, or transport of the sample (e.g. viscosity, surfacetension, vapor pressure , and density) .4. Atomic Absorption Spectroscopy with graphite furnace (GFAA)The GFAA and flame AAS measurement principle is the same. The difference betweenthese two techniques is the way the sample is introduced into the instrument. In GFAAanalysis, an electrothermal graphite furnace is used instead. The sample is heatedstepwise (up to 3000ºC) to dry. The advantage of the graphite furnace is that the detectionlimit is about two orders of magnitude better than that of AAS. The analysis of differentspecies of a given element is important because different oxidation states of the sameelement may present different toxicities and, consequently, different risks. Therefore,sequential extraction procedures for the separation and further analysis of a species havebeen developed for several metals. Sammut et al. (2010) developed a sequential extractionprocedure for separating inorganic species of selenium found in the particulate matter ofemissions in working areas. Essentially, the method is based on sequential dissolutions ofthe sampled matrix. Se(IV) and Se(0) can be independently analyzed by GFAA, whereasonly total selenium can be detected when analyzed by AAS. This research group alsoproposed the analysis of beryllium species using GFAA and ICP-AES because metallicberyllium and beryllium oxide in workplaces are associated with different toxicities.These examples highlight the necessity of improving analytical techniques for measuringnot only the total concentration but also the different species of a metal dispersed incontaminated air.The graphite furnace has several advantages over a flame furnance. First it accepts solutions,slurries, or solid samples. Second, it is a much more efficient atomizer than a flame furnanceand it can directly accept very small absolute quantities of sample. It also provides areducing environment for easily oxidized elements. Samples are placed directly into thegraphite furnace and the furnace is electrically heated in several steps to dry the sample, ashorganic matter, and vaporize the analyte atoms. It accommodates smaller samples but it is adifficult operation, since the high energy that is provided to atomize the sample particleswww.intechopen.com
10Atomic Absorption Spectroscopyinto ground state atoms might also excite the atomized particles into a higher energy level,thus lowering the precision.GFAA has been the most common instrument used for Pb analysis, and in countries wherethis element is a criterion for pollution standards, AAS is generally the technique used in thereference methods to quantify it. Garcia et al., 2008 determined Pb in total suspendedparticles in southwest Mexico City, using a nitric acid digestion–based AAS method. AnAAS method was used in conjunction with voltammetry for Pb and Cd analysis to evaluatea rapid digestion technique using a microwave oven, comparing this with traditionalmethods after establishing the optimal efficiency of digestion in terms of power setting, timeand the use of different acids (Senaratne and Shooter, 2004).For low level determination of volatile elements such as As, Ge, Hg, Sb, and Se, hydridegeneration coupled with AAS provides lower detection limits (milligram–microgram range).The three-step sample preparation for graphite furnaces is as follows:1. Dry - evaporation of solvents (10–100 s)2. Ash - removal of volatile hydroxides, sulfates, carbonates (10–100 s)3. Fire/Atomize - atomization of remaining analyte (1 s)4.1 Specific sample considerationsGFAA has been used primarily for the analysis of low concentrations of metals in watersamples. GFAA can also be used to determine the concentrations of metals in soil, butsample preparation for metals in soil is somewhat extensive and may require the use of amobile laboratory. The more sophisticated GFAA instruments have a number of lamps and,therefore, are capable of simultaneous and automatic analyses of more than one element. Plants: Solid samples must be in liquid form to be aspirated by the instrument.Therefore, solid material must be liquefied by means of some form of extraction ordigestion protocol. Procedures have been devised that make the total amount of anelement in the sample available for assay or that use some particular properties toextract the portion of the element that exists in some chemical forms but not in others.For example, the plant dry ash/double acid extraction method determines the totalelement content of the sample. Soil: For ecological purposes, there is more interest in measuring extractable or labilesoil constituents than in determining total element content. Certain partitions of thetotal soil content of a given element are operationally defined by an extractionprocedure, and arguments are usually offered that suggest that such partitionscorrespond to different levels of biological availability or activity. The HCl/H2SO4double acid extraction method, also referred to as North Carolina and Mehlich-1, iswidely used to determine bioavailable Ca, K, Mg, Mn, P, and Zn in sandy acid soilscharacteristic of the eastern and southeastern United States. Water: Aquatic samples, of course, need no liquefaction step, but researchers must stilldecide which analyte partition (dissolved, suspended, total) is of interest. Varioustreatments for each sample partition are detailed in the U.S. EPA's discussion of thecontent partitioning of water samples.The advantages of using atomic absorption spectroscopy are, in our opinion:Greater sensitivity and detection limits than other methodsDirect analysis of some types of liquid sampleswww.intechopen.com
11Atomic Absorption Spectrometry (AAS)Low spectral interferenceVery small sample sizeFinally, it is worth mentioning that in the last two decades, quantification andcharacterization of different matrices and materials by atomic absorption spectroscopy hasbeen significant. The development of continuous measurement techniques for certainchemical species is important for governments, mainly in areas where the epidemiologicalstudies are still being processed.ElementMeanMinMaxAl1536.497.65 8939.1Cd2.640.09Cr23.7914.08Fe75thGeometric Harmonic Std.25thPercentile 16.621098.627.88 9428.16V16.222.1544.528.4023.419.939.9310.02N 100 (number of samples)Table 1. Descriptive Statistics: Mean, Minimum (Min), Maximum (Max), 25th and 75thpercentiles, Geometric Mean, Harmonic Mean and Standard deviation (Std. Dev.),concentrations of metals in PST collected 2003–20045. ReferencesA. Báez, R. Belmont, R.M. García, H. Padilla, M.C.Torres. (2007). “Chemical composition ofrainwater collected at a southwest site of Mexico City, Mexico”. Rev. AtmosphericResearch. 86: 61-75.www.intechopen.com
12Atomic Absorption SpectroscopySammut, M. L., Noack, Y., Rose, J., Hazemann, J. L., Proux, O., Depoux, M., et al. (2010).Speciation of Cd and Pb in dust emitted from sinter plant. Chemosphere, 78, 445.Senaratne I. and Shooter D. (2004). Elemental compositi of brown haze in Auckland, NewZealand. Atmospheri 3059.R. García, M. C. Torres and A. Báez. (2008). “Determination of trace elements i
The chemical methods used are based on matter interactions, i.e. chemical reactions. For a long period of time these methods were essentially empirical, involving, in most cases, great experimental skills. In analytical chemistry, AAS is a technique used mostly for determining the con