Transcription
Estimation of Aircraft Taxi-out Fuel Burn usingFlight Data Recorder ArchivesHarshad Khadilkar and Hamsa Balakrishnan†Massachusetts Institute of Technology, Cambridge, MA 02139, USAThe taxi-out phase of a flight accounts for a significant fraction of total fuel burn foraircraft. In addition, surface fuel burn is also a major contributor to CO2 emissions in thevicinity of airports. It is therefore desirable to have accurate estimates of fuel consumptionon the ground. This paper builds a model for estimation of on-ground fuel consumptionof an aircraft, given its surface trajectory. Flight Data Recorder archives are used for thispurpose.The taxi-out fuel burn is modeled as a linear function of several factors including thetaxi-out time, number of stops, number of turns, and number of acceleration events. Thestatistical significance of each potential factor is investigated. The parameters of the modelare estimated using least-squares regression. Since these parameters are estimated usingdata from operational aircraft, they provide more accurate estimates of fuel burn thanmethods that use idealized physical models of fuel consumption based on aircraft velocityprofiles, or the baseline fuel consumption estimates provided by the International CivilAviation Organization. Our analysis shows that in addition to the total taxi time, thenumber of acceleration events is a significant factor in determining taxi fuel ernational Civil Aviation OrganizationFlight Data RecorderMaximum TakeOff WeightAmbient absolute temperatureTotal fuel consumed during taxi-outTaxi-out timeNumber of stopsNumber of turnsNumber of acceleration eventsI.IntroductionEstimation of aircraft fuel burn plays an important role in determining the impact of air traffic operationsas well as in estimating the benefits of efficiency-enhancing procedures, and has been a topic of interest to theresearch community for several years.1 Taxi-out fuel consumption is most often determined using the fuelburn indices presented in the International Civil Aviation Organization (ICAO) engine emissions databank.2The ICAO fuel burn indices provide fuel burn rates for only four engine power settings (corresponding to 7%or taxi/idle, 30% or approach, 85% or climb-out, and 100% or takeoff), and are based on estimates provided Graduate Student, Department of Aeronautics and Astronautics, Massachusetts Institute of Technology, Cambridge, MA02139. harshadk@mit.edu.† Assistant Professor, Department of Aeronautics and Astronautics, Massachusetts Institute of Technology, Cambridge, MA02139. hamsa@mit.edu. AIAA Member.1 of 12American Institute of Aeronautics and Astronautics
by engine manufacturers.3 Recently published studies4, 5 have shown that the ICAO estimates can be quitedifferent from the actual fuel burn, when considering the departure flight phase in the terminal area. Theterminal area fuel burn considered in these studies includes the fuel consumed during taxi-out as well asthe initial part of the climb. In contrast, in order to estimate the benefits of surface traffic managementstrategies,6 it is necessary to have accurate estimates of the taxi-out (on-surface) fuel burn. Since fuel flowrates in the airborne flight phase are much higher than during taxi-out, total departure fuel burn may notbe a good indicator of surface fuel burn. On the other hand, a large part of total flight delay is absorbed onthe ground, before departure. To quantify the impact of this delay, it is again necessary to have an estimateof the fuel burn associated with surface trajectories of departing aircraft. Previous studies on this topic7have used the ICAO fuel burn indices (augmented with physical models) to translate the surface trajectoriesinto fuel burn estimates, and therefore may not be representative of operational aircraft. To the best of ourknowledge, this paper is the first attempt to develop models of surface fuel burn using Flight Data Recorderarchives from an actual, operational fleet.A.Problem DescriptionThe high-level objective of this work is build a model that, when given the surface taxi trajectory of a flight(for example, from a surface surveillance system such as the Airport Surface Detection Equipment - ModelX, or ASDE-X), can produce an accurate estimate of its fuel burn. In order to build such a model, we needto estimate fuel consumption from estimates of aircraft position, velocity and acceleration. One method fordoing so is to divide the surface trajectory into different taxi phases (for example, stops, turns, constantvelocity taxi, etc.), to estimate the engine power settings for each of these phases (using physics-based modelsand pilot surveys), interpolate/extrapolate ICAO fuel burn indices to these power settings, and to use theseestimated fuel burn indices to determine the fuel consumption of the trajectory.7However, several factors confound such an estimation using ICAO data alone. Firstly, the ICAO fuelburn estimates provided by engine manufacturers may not reflect the characteristics of the engines in theoperational fleet which are subject to frequent use. Secondly, the engines are staged and tested only at fourpower settings, and in particular, 7% may not be representative of the typical power setting during taxi.Thirdly, pilot behavior is a critical factor in determining the power settings during the different taxi modes:for example, some pilots may not change their power settings when they stop, or when they acceleratefrom a stop, choosing instead to “ride the brakes”. Idealized models of taxiing cannot capture the effectof these intricacies. Finally, several studies have shown a nonlinear dependence of fuel flow rate on enginepower settings, and the relationship at low power settings is not well-understood. Therefore, caution mustbe extended in interpolating or extrapolating fuel burn indices at low power settings (such as near groundidle). In order to overcome these challenges, we adopt a data-driven approach to estimating the fuel burn ofsurface trajectories, using Flight Data Recorder (FDR) archives.II.FDR DatabaseThe Flight Data Recorder (FDR) is a device onboard commercial aircraft that stores the history of severalparameters such as aircraft position, velocity, fuel flow rate, ambient and engine temperature, and so on.FDR archives from over 2300 flights in the year 2004, belonging to an international airline, were used forthe purposes of modeling and validation in this study. The dataset included flights originating from the US,Europe, Asia and Africa. Aircraft types included in the dataset were the Airbus A320 family (A319, A320,A321), the A330 family (with Rolls Royce and General Electric engines) and the A340, the Avro RJ85 andBoeing’s B757, B767 and B777. A full list of aircraft and engine types, along with their Maximum TakeoffWeight (MTOW), is shown in Table 1.A total of 105 parameters were available in the dataset, of which the ones of primary interest to us werethe fuel flow rate, throttle setting, velocity, position (latitude/longitude), ambient temperature, thrust andengine fan speed (N1). It is believed that some of these quantities, such as the thrust, were derived estimatesand not actual measurements.A.Data ProcessingRaw data was run through multiple preprocessing algorithms for the purposes of analysis. These stepsincluded sorting of flights, removal of the post-takeoff phase, filtering of the estimated velocity, and the2 of 12American Institute of Aeronautics and Astronautics
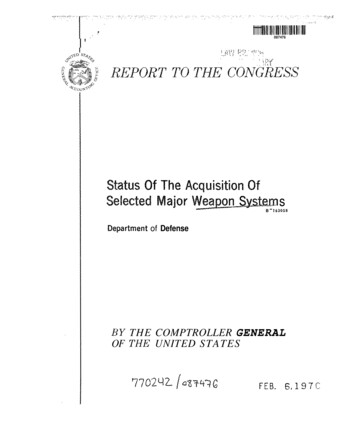
Table 1. Aircraft types and 1-2CF6-80E1A4RR Trent 772B-60RR Trent 553-61LF507-1FRR RB211-535E4P&W 4060GE90Number of Engines2222244222Number of Flights140238174224237260263178285364MTOW 06,600186,900344,550extraction of events of interest such as stops and turns. The velocity as derived from position requiredfiltering due to the relatively low update rate of aircraft position during taxi-out (Table 2).Table 2. Dataset update ratesFlight PhaseTaxiTakeoff/Landing RollClimb/DescentCruiseUpdate Rate5 sec1 sec10 sec150 secFinally, the taxi-out phase was separated by extracting the portion of the surface trajectory after pushbackfrom the gate and before commencement of the takeoff roll. Identification of pushback was carried out usinga combination of fuel-flow rate and speed conditions, and the start of the takeoff roll was determined usinga speed cut-off.III.A.Taxi-out Process CharacterizationBaseline Fuel ConsumptionThe ICAO procedure for estimation of taxi-out fuel burn assumes that taxi operations occur entirely at 7%thrust (power setting), and thus proposes the use of this constant rated thrust fuel flow for all calculations.2It defines the fuel burn index to be the fuel flow rate per engine at 7% thrust. The version of the ICAOdatabase used for this study was from December 2010.8 To compare these numbers to actual data, wecalculated the average fuel flow rate for each available aircraft type in the dataset, by dividing the taxi-outfuel burn by the taxi-out time and the number of engines, and averaging this over all aircraft of a giventype. As seen from Figure 1, the ICAO fuel burn index is not necessarily a reflection of the true per-enginefuel burn rate. The comparison shown in Figure 1 is in agreement with the results from a previous study,5where a comparison of total average fuel flow rate is available. It can be seen that in several cases, the ICAOmethod produces an overestimate of fuel burn. This result is important from the point of view of estimatesthat drive environmental policy, such as the quantification of total CO2 emissions at airports.B.Events of Interest during Taxi-outThe surface trajectory is composed of periods of constant velocity taxi in a straight line, interspersed byevents such as stops and turns. The results of any estimation procedure that incorporates these events willlikely be influenced by their exact definitions. Therefore, the algorithms used to detect the number of turnsand stops during taxi-out, as used in this study, are discussed below.3 of 12American Institute of Aeronautics and Astronautics
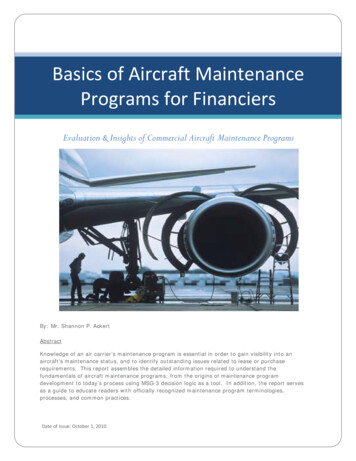
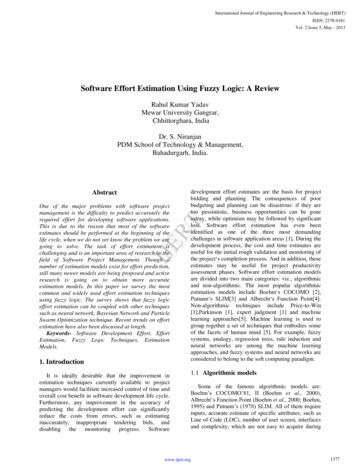
Comparison of fuel burn index0.4Fuel Burn Index (kg/s per engine)0.35Result from FDR dataICAO estimate (Dec 2010)0.30.250.20.150.10.050A319A320A321A330 202 A330 243 A340 500 ARJ85Aircraft typeB757B777Figure 1. Comparison of fuel burn index as calculated from FDR data and that obtained from ICAO.1.Detection of number of turns during taxi-outThe number of turns made by an aircraft taxiing on the ground was expected to affect the fuel burn. Onereason is because the aircraft may slow down during its turn and have to speed up again after completing it,and the other reason might be the use of differential thrust for turning. A ‘turn’ was defined to be a headingchange of at least 30 degrees, that was held over at least 30 seconds. Figure 2 shows the heading variationduring taxi-out for a sample flight. Each time instant was tagged by a binary flag representing detection,or otherwise, of a turn in progress. Each set of contiguous non-zero flags was counted as one turn. Theresults from automatic detection were compared with visual inspection across several flights and were foundto correctly count the number of turns in almost all cases.2.Detection of number of stops during taxi-outThe number of stops made by aircraft was also expected to be a determinant of fuel burn, because of thethrottle adjustments necessary during the stopping and restarting process. Usually, an aircraft has to stopduring a handoff from one ground controller to another, because there is passing traffic on an intersectingtaxiway/runway, or in the runway departure queue. There are two ways in which an aircraft can be broughtto a halt: one way is to apply the brakes while reducing the thrust to idle, and the other is to apply the brakeswhile keeping the thrust constant. There are fuel burn tradeoffs involved with both methods. Reductionof the thrust while stopping reduces fuel consumption if the duration of the stop is long. However, thrusthas to be increased to start taxiing again (breakaway power ), and this is accompanied by a spike in the fuelconsumption. Also, aircraft engines exhibit some time lag while spooling up, leading to slow response timeswhen starting from a standstill. On the other hand, if the aircraft is stopped using only the brakes, fuelflow rate remains high, and can lead to significantly higher total fuel burn if the stop is prolonged. However,there is a performance benefit on restart as previously outlined. Consequently, pilots tend to use one of thetwo methods depending on personal preference and operational considerations. In this study, an aircraft wasdefined to have stopped during its taxi phase if its velocity dropped and stayed below a stop threshold of2.25 m/s for at least 20 seconds, and then subsequently increased above a start threshold of 6.25 m/s. Theresults from the stop detection algorithm are shown in Figures 3 and 4 for two sample cases. Note that eventlogging takes place only if the aircraft is already taxiing, which means that the initial start is not counted.4 of 12American Institute of Aeronautics and Astronautics
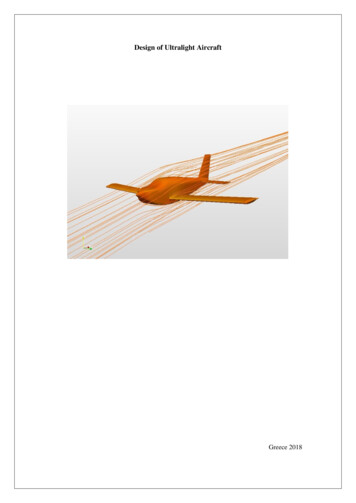
Sample heading history350Heading (degrees)300250200Each of these sets is counted as one turn1501005000100200300400Time from start of flight (sec)500600700Figure 2. Plot of heading history for one flightNumber of events detected: 125Velocity (m/s)2015Velocity’Stop’ threshold’Start’ thresholdInitial start (not counted)Stop10500100200300400Time from start of flight (sec)500600Figure 3. Flight with a single stopIV.Estimation of Taxi-out FuelHaving extracted the different taxi phases, we now investigate two possible linear regression models thatestimate the fuel burn (normalized by square root of ambient absolute temperature) as a function of different5 of 12American Institute of Aeronautics and Astronautics
Number of events detected: 325Velocity (m/s)20Velocity’Stop’ threshold’Start’ threshold15105Stop 100200400Stop 3Stop 2600800Time from start of flight (sec)100012001400Figure 4. Flight with three stopsindependent variables.A.1.Model 1: Taxi time, number of stops and number of turns as independent variablesFormulation: Model 1According to our initial hypothesis, total fuel burn on the ground would be a function of the taxi time,number of stops and number of turns made by the aircraft. It is easy to see that taxi time would be adeterminant of fuel burn. In addition, given that the engines run at constant thrust for a large part of thetaxi-out process, we would expect the effect of taxi time on fuel burn to be linear. Stops were expectedto affect fuel burn because of the breakaway thrust required to start moving once an aircraft was stopped.This should add a relatively fixed fuel penalty per stop, resulting in a linear effect of the number of stopson fuel burn. Similarly, turns would require some adjustment of the power setting, but assuming that theadjustment would be similar for each turn, this effect should also be approximately linear. Finally, we knowfrom available literature9, 10 that engine sfc (specific fuel consumption) is proportional to the square root ofambient temperature. Therefore, we normalized for the effect of ambient temperature experienced by eachflight, by formulating the regression as follows: f a1 b1 · t c1 · ns d1 · ntTamb(1)Here, f is the total fuel consumed, t is the total taxi time, ns is the number of stops, and nt is the number ofturns made by the aircraft during taxi. a1 , b1 , c1 and d1 are the parameters to be estimated. The coefficientb1 will be the baseline fuel consumption rate of that aircraft type during taxi. Note that actual variation oftemperature in the available data was only 17 K, which would not significantly impact the regression results,even if we had not normalized the fuel burn.2.Results: Model 1Table 3 lists the results of the parameter estimates calculated using least-squares regression. The estimatesare accompanied by corresponding statistical p-values. A threshold of 0.1 was assumed for inferring statisticalsignificance of each variable, i.e., variables with p-values below 0.1 are assumed to be statistically significant.The aircraft types for which one or more of the variables are statistically insignificant have been highlighted.6 of 12American Institute of Aeronautics and Astronautics
Table 3. Regression Results: Number of Stops and B757B767B777Constanta1pa1(kg/K0.5 0.240.18-0.220.48-1.710Taxi Timeb1pb1(kg/s-K0.5 0.017500.017800.03380# Stopsc1pc1(kg/K0.5 90.060.7300.190# Turnsd1pd1(kg/K0.5 .990.970.990.990.990.980.95.99St. 1.54Note that some outliers with unusually long taxi times were ignored in the estimation procedure. There areno more than one or two of such points for any single type of aircraft, constituting approximately 0.5% ofall data. Note also that the parameters a1 , c1 and d1 have units of kg/K0.5 , while parameter b1 has units ofkg/s-K0.5 . In fact, b1 should correspond to the (normalized) fuel burn index for the aircraft type, multipliedby the number of engines. A comparison with Figure 1 shows that this is indeed the case. Some importantpoints to note, regarding Table 3, are listed below: p-values for the parameter b1 are uniformly zero, which means that taxi time is certainly a determinantof fuel consumption. This was, of course, expected. It also contributes the most to total fuel consumed. The statistical significance of the number of stops depends on the aircraft type. Some types show adefinite relationship, while others show almost none. The coefficients of the number of turns are very small, even in comparison with the coefficients ofnumber of stops. Given the dominance of taxi time in the regression, the effect of turns on fuel burncan be said to be negligible. The statistical significance of the number of turns also depends on aircraft type. In addition, thesignificance of stops and turns does not appear to be related. ρ is the correlation coefficient between the estimated fuel burn and the actual fuel burn. These valuesare uniformly high. σ is the corresponding standard deviation of the residuals. Note that the reason that some of thesevalues are larger than others is because the aircraft themselves are large (Table 1), which means thatthe total fuel consumed is more as well. The ratio of σ to average total fuel consumed is more or lessthe same for all types of aircraft.3.Variability in statistical significance of stops and turnsThe differences in p-values across aircraft types led us to investigate the stopping process in more detail. Asseen from Figures 5 and 6, a start from having stopped was accompanied by a spike in fuel consumption insome cases, and by none in other cases. This variation was noticed between flights of the same aircraft type,across different aircraft types, and sometimes even between two different stop events on the same flight. Nocommon characteristic was found to explain this difference across aircraft types. Possible factors consideredwere aircraft size, engine manufacturers, locations of operating airports, aircraft weight class and period ofinitial introduction of the aircraft. In addition, when considering the thrust setting profile, we find thatacceleration events after stops that were not accompanied by an increase in the fuel burn rate were notaccompanied by a change in thrust setting either. Therefore, we conclude that the difference in results was7 of 12American Institute of Aeronautics and Astronautics
due to differences in pilot behavior (whether reduction of thrust when stopping was more or less prevalentfor the given aircraft type). A similar argument would hold true for thrust characterization during turns.Since our aim was to model the effect of stops as executed by the average pilot, we chose not to investigatethe specific reasons for this variation.Type of aircraft: A320 (sample flight)Parameter History12Velocity (m/s)1086420Fuel flow rate 03004005006007000.80.60.40.2Throttle setting (%)0Right Engine30Left Engine201000100200Time from start of flight (sec)Figure 5. Simultaneous plot of velocity, fuel consumption rate and engine thrust settings for an Airbus A320:Increase in velocity (after stops) accompanied by spikes in fuel flow rateB.1.Model 2: taxi time and number of acceleration events as independent variablesFormulation: Model 2The model discussed previously produced good estimates of the total fuel burn, as seen from the values ofthe standard deviation of residuals. However, the differences in statistical significance of the explanatoryvariables suggested that other factors might be more important determinants of fuel burn. We thereforedecided to drop the number of stops and number of turns from the regression, and instead add the numberof acceleration events as an independent variable. The logic behind this decision was that fuel flow rateswere seen to increase for aggressive starts from standstill, as opposed to gradual ones. An acceleration eventwas logged if the aircraft accelerated at more than 0.15 m/s2 for at least 10 seconds. In Equation (2), na isthe number of acceleration events. The other variables have the same definition as before. f a2 b2 · t c2 · naTamb8 of 12American Institute of Aeronautics and Astronautics(2)
Type of aircraft: A319 (sample flight)Parameter HistoryVelocity (m/s)15105Throttle Setting (%)Fuel Flow Rate 5020025030035021.510.5030average engine throttle setting20100050100Time from start of flight (sec)Figure 6. Simultaneous plot of velocity, fuel consumption rate and engine thrust settings for an Airbus 319:No change in fuel flow rate during acceleration from some stop events.2.Results: Model 2The results from parameter estimation for Model 2 have been listed in Table 4. It is seen that both independent variables are statistically significant for all aircraft types but one. Even for the Boeing 757, the p-valuefor the number of acceleration events is not very large. Comparing the results with those from Table 3, wecan also see that the correlation coefficients are higher and the standard deviation of residuals is consistentlylower for Model 2. Figures (7)-(8) compare the fuel burn estimates to actual burn for two aircraft types. Itis clear that the prediction accuracy of Model 2 is very good. Figure 9 shows a scatter plot of the residualsfor the Boeing 777. The whiteness of these residuals was tested by calculating the autocorrelation of theresiduals vector within each aircraft type.11, 12 A sample plot of the result is shown in Figure 10. It can beseen that the residuals are white, which means that optimal use of the information in the dataset has beenmade.V.ResultsThe two regression models provide us with several interesting results. The first one is that the totaltaxi time is by far the main driver of fuel consumption. In other words, an accurate estimate of the fuelburn index along with the taxi time can provide a reasonably accurate estimate of the fuel consumption ofa surface trajectory. The analysis also shows that for some of the aircraft types studied, the ICAO enginedatabank overestimates the fuel burn indices.The FDR analysis also suggests that contrary to assumptions made in prior studies,7 stops or turnsby themselves may not necessarily result in an increase in fuel burn rate, and therefore do not contributemuch information beyond additional taxi time. We believe that this can be explained by the variabilityin pilot behavior (since there may not be significant thrust changes accompanying stops or turns), the9 of 12American Institute of Aeronautics and Astronautics
Table 4. Regression Results: Acceleration 5B757B767B777Constanta2pa2(kg/K0.5 0.02Taxi Timeb2pb2(kg/s-K0.5 750.00.01020.00.01730.00.02020.00.03350.0# Acc. Eventsc2pc2(kg/K0.5 160.99650.99180.99280.98610.97950.9985Std. .75Fuel estimation: ARJ85 (All Flights)200180Estimated taxi fuel (kg)160140120100806040200050100150Actual taxi fuel (kg)200Figure 7. Regression for the Avro-RJ 85 using number of acceleration eventsFuel estimation: B777 (All Flights)900800Estimated taxi fuel (kg)70060050040030020010000200400600Actual taxi fuel (kg)800Figure 8. Regression for the Boeing 777 using number of acceleration events10 of 12American Institute of Aeronautics and Astronautics
Residuals plot: B777 (All Flights)40Residuals (kg)200 20 400100200300400500600Actual taxi fuel (kg)700800900Figure 9. Residuals from the estimation of fuel consumption for the B7776Autocorrelation Value10Autocorrelation of residuals: B777 (All Flights)x 1086420 2 400 300 200 1000100200Difference in Index within Residuals Vector300400Figure 10. Autocorrelation of residuals for the B777inherent variability in the thrust settings during taxi (which may be significantly different from the ICAO7% assumption), and the significant dominance of the total taxi time as the driver of taxi fuel burn. However,acceleration events (defined as the aircraft accelerating at more than 0.15 m/s2 for at least 10 seconds) havea small but statistically significant impact on the taxi fuel burn. The inclusion of these effects will providea more accurate estimate of surface fuel consumption, and will also need to be considered in surface trafficoptimization.VI.Conclusions and Future WorkIn this paper, we presented a procedure for the estimation of the taxi-out fuel consumption correspondingto an aircraft trajectory. We showed using FDR data that our model can provide more realistic estimates offuel burn than the standard ICAO fuel burn indices, or other dynamics-based algorithms that use the ICAOfuel burn indices for conversion of surface trajectory to fuel burn. Therefore, our procedure can be used tobetter quantify the total fuel burn and CO2 impact of surface operations at airports. Similar proceduresmay also be extended to estimate other emission impacts such as NOx and unburned Hydro Carbons, whichhave a nonlinear dependence on fuel flow rates.11 of 12American Institute of Aeronautics and Astronautics
References1 Collins,B., “Estimation of Aircraft Fuel Consumption,” Journal of Aircraft, Vol. 19, No. 11, Nov. 1982, pp. 969–975.Civil Aviation Organization, International Standards and Recommended Practices, Annex 16, Environmental Protection: Aircraft Engine Emissions, Vol. 2, Montreal, 3rd ed., 2008.3 Intergovernmental Panel on Climate Change (IPCC), Aviation and the Global Atmosphere, Cambridge University Press,1999.4 Senzig, D., Fleming, G., and Iovinelli, R., “Modeling of Terminal-Area Airplane Fuel Consumption,” Journal of Aircraft,Vol. 46 No. 4, 2009.5 Patterson, J., Noel, G., Senzig, D., Roof, C., and Fleming, G., “Analysis of Departure and Arrival Profiles Using RealTime Aircraft Data,” Journal of Aircraft, Vol. 46 No. 4, 2009.6 Simaiakis, I. and Balakrishnan, H., “Queuing Models of Airport Departure Processes for Emissions Reduction,” AIAAGuidance, Navigation and Control Conference and Exhibit, 2009.7 Jung, Y., “Fuel Consumption and Emissions from Airport Taxi Operations,” NASA Green Aviation Summit, 2010.8 “ICAO Engine Emissions Databank,” http://www.caa.co.uk/default.aspx?catid 702&pagetype 90, [Retrieved December 2010].9 Hill, P. and Peterson, C., Mechanics and Thermodynamics of Propulsion, Addison-Wesley, 2nd ed., 1992.10 Yoder, T., Development of Aircraft Fuel Burn Modeling Techniques with Applications to Global Emissions Modeling andAssessment of the Benefits of Reduced Vertical Separation Minimums, Master’s thesis, Massachusetts Institute of Technology,2007.11 Durbin, J. and Watson, G., “Testing for Serial Correlation in Least Squares Regression I,” Biometrika, Vol. 37, 1950,pp. 409–428.12 Durbin, J. and Watson, G., “Testing for Serial Correlation in Least Squares Regression II,” Biometrika, Vol. 38, 1951,pp. 159–178.2 International12 of 12American Institute of Aeronautics and Astronautics
The ICAO fuel burn indices provide fuel burn rates for only four engine power settings (corresponding to 7% or taxi/idle, 30% or approach, 85% or climb-out, and 100% or takeo ), and are based on estimates provided Graduate Student, Department of Aeronautics and Astronautics, Massachusetts Institute of Technology, Cambridge, MA