Transcription
Merchant Indifference Test Application –A Case For Revising Interchange Fee Level in PolandJakub GórkaAugust 2014AbstractThe paper presents results of an empirical study conducted in Poland aimed at estimatingcosts of cash and card payments acceptance at physical points of sale and determining thelevel of interchange fees (IF) in card-based transactions conformant with the merchantindifference test (MIT), also known as the tourist test or the cost-avoided test.Calculations were based on data obtained from a survey of more than 1000 merchants of allsizes from different branches of economy active in retail trade (consumer-to-businessdomain). The sample of companies was statistically representative at national level.The MIT may currently be considered as a preferred method of IF assessment in the economicliterature, as well as by the European Commission. To the author’s knowledge, theapplication of MIT on the basis of primary data from the merchants survey was the first suchattempt in the economic literature.The MIT explores the question whether a merchant would refuse a card payment if he werecertain that a non-repeat customer who is about to pay at the cash register had enough cashin his pocket. The test is passed if accepting the card does not increase the merchant’soperating costs.The level of interchange fees in Poland compliant with the tourist test would help acceleratethe growth of card acceptance network and make merchants indifferent to the choice ofpayment method by consumers (cash vs card). The level of IFs in Poland has long remainedthe highest compared to other countries of the European Union.Based on the outcomes of cost calculations it can be argued that tiers of interchange fees inPoland should be low – up to 0.2% of a transaction value or even nil.Keywords: payment costs, cash, card, merchant indifference test, interchange feeJEL Codes: D23, D24, D611
Table of contents1. Introduction2. Background information and literature review3. Survey methodology4. Selected descriptive results5. Cost items investigated6. Cost calculations of cash and card payments7. The concept of merchant indifference test8. The application of merchant indifference test9. ConclusionsGlossary of cost definitionsReferences2
1. IntroductionInterchange fees (especially collectively agreed multilateral interchange fees, MIFs)have been a focal point of many debates worldwide. The views of payment stakeholders onthe role of interchange fees (IFs) and their level are varied. While payment organisations andissuers tend to prefer higher IFs, merchants and acquirers would rather see them low or evennon-existing. Payment regulators in all countries, who are authorised to protect consumersand competition, closely monitor the payments market and take under scrutiny the economicsof business models in three and four-party card schemes. It would be hard to find a countryamong developed and emerging markets where antitrust authority did not conduct anyinvestigation against Visa and MasterCard networks for setting excessive (multilateral)interchange fees or enforcing anticompetitive rules (such as blending, no-surcharge/nodiscrimination rule, honour-all-cards rule).In Poland policy makers felt concerned about high interchange fees which wereregarded as one of the main factors that slowed down expansion of card accepting paymentterminals and in effect inhibited non-cash circulation development in the country. The needarose to make a study on payment costs with special attention on the issue of merchant servicecharges and underlying interchange fees.The article presents selected results of the Polish merchants survey and subsequentcost calculations which were made in the joint research project carried out in the second halfof 2012 by: the Foundation For Development of Cashless Payments in Poland (FROB), the National Bank of Poland (NBP), the Faculty of Management, University of Warsaw (WZ UW)1.More than 1000 merchants of all sizes from different branches of economy active inretail trade (consumer-to-business domain) were interviewed in the survey. The sample wasstatistically representative at the national level with the exception of small rural areas.The project aimed at: estimating costs of cash and card payments acceptance at physical points ofsale in Poland, identifying barriers to the development of non-cash payments (including cardtransactions), defining degree of Polish merchants’ openness to potential adoption ofinnovative payment methods.An important problem addressed in cost estimations was the assessment of an efficientlevel of interchange fees in Poland which would help accelerate the growth of card acceptancenetwork and make merchants indifferent to the choice of payment method by consumers (cashvs card). The merchant indifference test (MIT, also known as the tourist test or the avoided1Millward Brown conducted the survey of merchants.A comprehensive report written by the head of the research project is available on NBP and FROB websites.Górka J. (Dec. 2012), Study on Acceptance of Cash and Payment Cards in Poland (in Polish):http://www.nbp.pl/home.aspx?f /systemplatniczy/obrot bezgotowkowy/obrot a/The analyses, opinions and conclusions presented in the report are of the author and cannot be treated as aposition of any institution involved in the research project.3
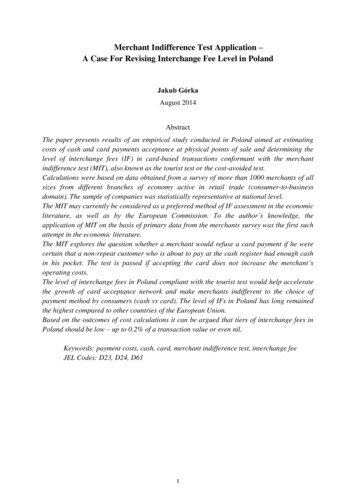
cost test) was used in order to find an appropriate benchmark for the IF level. The MIT maycurrently be considered as a preferred method of MIF assessment in the economic literature aswell as by the European Commission.The remainder of the paper is organised as follows: Section 2 provides generalbackground information about interchange fees and a brief literature review; Section 3describes the methodology used in the survey on merchant’s costs; Section 4 presents selectedresults of the survey; Section 5 gives insight into investigated cost items; Section 6 focuses oncost calculations of cash and card payments; Section 7 introduces the concept of merchantindifference test; Section 8 refers to the application of MIT to Polish data, shows recentdynamics of interchange fees in Poland and discusses regulatory interventions made in Polandand planned on the Pan-European level; Section 9 concludes followed by a glossary of costdefinitions used in the study on merchants’ costs.2. Background information and literature reviewInterchange fees are charged by issuing banks to acquiring banks for each cardpayment transaction executed at a merchant outlet. They can be set unilaterally as well asagreed bi- or multilaterally between issuers within a payment scheme. In the latter case theyare defined as multilateral interchange fees (MIFs) and take either a form of a percentage feeor combined fee (a fee with both – ad valorem and flat fee components).Figure 1. Domestic weighted average multilateral interchange fees (MIFs) in Europe %MasterCard Debit MIF (%)MasterCard Credit MIF (%)Source: based on EC data (DG Competition).4Visa Debit MIF eeceFranceGermanyFinlandEstoniaDenmarkCyprusCzech RepublicBulgariaBelgium-0.20%Austria0.00%Visa Credit MIF (%)
Domestic MIFs are not set on the same or similar levels across countries and theydiffer significantly. In 2012 MIFs in Poland stood out as the highest in the EU (the weightedaverage level of 1.55-1.60%). They were blamed for impeding the growth of paymentaccepting devices network in Poland and inflating merchants’ costs (NBP 2012: 6,Maciejewski 2012: 21). Between 2003 and 2012 the number and value of non-cash cardtransactions in Poland soared by 635% and 406% respectively, while the number of paymentterminals only by 246%. At the end of 2011 Poland had the second sparsest card paymentacceptance network in the EU – 7 005 devices per one million inhabitants, while the EUaverage at that time was 17 584.In order to solve the problem by means of a market compromise the National Bank ofPoland set up an Interchange Fee Task Force consisting of all major market stakeholders(issuers, acquirers, payment organisations, merchants, consumers, public authorities – PolishMinistry of Finance, Office of Competition and Consumer Protection, Polish FinancialSupervision Authority, the central bank itself). The IF Task Force was operating fromNovember 2011 to March 2012 and worked out the so called Programme of Card ChargesReduction in Poland which assumed gradual decreases of interchange fees in the years 20132017 (the first decrease to 1.1-1.2%, the last decrease to the European average – at that time0.70-0.84%). However, mainly due to the opportunistic behaviour of MasterCard, thecompromise had failed and the regulatory legislative process was initiated.Over the last decade the costs of payment instruments were estimated in a number ofempirical studies, frequently carried out directly by central banks: the Netherlands (Bank ofNetherlands 2004; Brits and Winder 2005), Belgium (Bank of Belgium 2005; Quaden 2005),Sweden (Guibourg and Segendorf 2004; Bergman et al. 2007; Segendorf and Jansson 2012),Portugal (Bank of Portugal 2007), USA (Garcia-Swartz et al. 2006a and 2006b), Australia(Simes et al. 2006; Reserve Bank of Australia 2007), Canada (Arango and Taylor 2009),Finland (Takala and Viren 2008; Nyandoto 2011), Norway (Gresvik and Øwre 2003; Gresvikand Haare 2009), Hungary (Turjan et al. 2011), Denmark (Bank of Denmark 2012), Germany(Krüger and Seitz 2014) and the most comprehensive study of the European Central Bankwith the involvement of 13 national central banks from the European Union (Schmiedel et al.2012). The studies concentrated on retail payments efficiency measured from the perspectiveof private costs incurred by different entities engaged in the payment process and from themacro perspective of social costs embracing all parties’ private costs after netting outreciprocal transfers of charges. Those studies did not directly deal with the economics of fees,such as the merchant service charge or the interchange fee, which underpin the paymentsystem and guide decisions of payment stakeholders.However, there is another strand of theoretical economic literature that evolved on theoptimal pricing of card payments. First in the early 1980’s Baxter built a model of two-sidedmarkets where he argued that contrary to traditional markets there was a rationale behindsetting an interchange fee which would balance demand for card services of two distinct usergroups: merchants and consumers characterised by different degree of price elasticity (Baxter1983). Simplified assumptions used in the Baxter model have been relaxed in other papers.Wright (2004) allowed for heterogeneity on both sides of the market. Rochet and Tirole(2002, 2003) proved that with lacking possibility of merchants to surcharge, the actual levelsof interchange fees can be higher than socially optimal. An extensive overview of economic5
literature on interchange fess can be found in Verdier (2009), Börestam and Schmiedel(2011), Bolt (2013).The pivotal issue raised in the economic literature as well as by antitrust authoritieswas the adequate level of MIF which would bring both sides on board without creating marketfailure whereby issuers would be able to extract economic rents through introducing highinterchange fees which in turn, via merchant service charges, would be passed on by acquirersto retailers. In such a case instead of positive externalities brought about by active cardholdersmerchants would face negative ones. All consumers, whatever payment method they used,would have to internalise higher costs of payments through higher prices of goods andservices.Up until ca 2008 in order to determine an appropriate MIF tier a supply side approachwas popular taking account of three cost categories (Börestam and Schmiedel 2011: 32): processing cost, payment guarantee cost, free funding cost.Payment organisations argued that these costs justified the usage of interchange feesby issuers. This reasoning was shared by antitrust authorities, including the EuropeanCommission, for some time, but it was later noticed that the supply side approach did nothave a good theoretical basis (Wright 2012: 28), because it did not relate directly to thoseparties of the market whose costs and benefits should be balanced, i.e. merchants andconsumers. Furthermore banks and payment organisations tended to inflate their costs withoutproviding compelling justification. Therefore the economists and regulators welcomed a newmethod of MIF assessment developed by Rochet and Tirole (2007, 2011), which was basedon retailers’ costs and benefits well internalising the position of consumers (for more on theconcept of merchant indifference test see section 7). The new method was considered suitablefor the purpose of finding a benchmark for interchange fees, promoting the use of moreefficient payment instruments and preventing abuses in the market (Börestam and Schmiedel2011: 19). It is remarkable that international payment organisations agreed for the tourist testmethodology in antitrust proceedings undertaken against them by the European Commission(EC vs. MasterCard 2007, EC vs. Visa 2008 cases) and thus withdrew from pushing for thesupply side approach.While theoretical literature on interchange fee models and methods of their assessmentflourished, there was not enough empirical research. Models lacked testing (Leinonen 2011:12, Börestam and Schmiedel 2011: 18). Only lately have some empirical studies been carriedout.In cases against Visa (2008) and MasterCard (2007) the European Commissionconducted simplified MIT-compliant calculations on the basis of data collected in cost studiesof the central banks in the Netherlands (Brits and Winder 2005, EIM 2007 – see Pleijster andRuis 2011), Belgium (Bank of Belgium 2005) and Sweden (Bergman et al. 2007). Pursuant tocalculations MIF benchmarks were defined (0.2% for debit cards, 0.3% for credit cards). TheEC did not make the calculations public.In February 2014 the EC announced preliminary results of its study on merchants'costs of processing cash and card payments, which delivered further evidence supporting theMIF benchmarks set earlier (EC 2014). The EC collected data for this study through a6
commissioned survey of more than 250 large retailers in 10 EU member states accounting forapproximately 87% of retail turnover in the EEA. The relevant costs applied in the tourist testincluded labour, service and payment instrument specific equipment costs.Other empirical studies were performed prior to the above mentioned study of the EC:the Polish one presented in this paper (2012), and the ones carried out by Layne-Farrar (2013)and Jonker and Plooij (2013).Layne-Farrar compared the interchange fee suggested by the tourist test with that setby the Durbin Amendment (DA) which capped debit card IFs at 21 cents per transaction plus5% of the transaction amount in the USA. Layne-Farrar made calculations on a case by casebasis for a variety of merchants (quick service restaurants, discount stores, supermarkets,retail gas stores, convenience stores, travel retail stores). She found that what mattered mostlyin calculations was the average transaction size and an alternative payment instrument to debitcards. For cash-centric merchants the DA cap seemed to be too high or about right (at venueswith higher average transaction sizes) while for merchants who honoured cheques the DA caplooked too low. The results imply that cash, unlike cheques, was still a cost competitiveinstrument compared to debit cards.Jonker and Plooij using Dutch cost data for 2002 and 2009 showed that for suchcountries as the Netherlands, characterised by decreasing costs of debit cards and increasingcosts of cash, the tourist test methodology may lead to growing costs for merchants, assumingthat MSCs would rise along with interchange fees. The MIT conformant level of MIF wouldgrow from 0.2% to 0.5% of the average debit card transaction value. According to Jonker andPlooij the tourist test is not a universal method of MIF assessment for regulatory purposes inall countries since it is heavily dependent on market characteristics. Moreover, what needs tobe further researched is the rate of passing through changes of MIFs on merchant andconsumer fee levels.Using tools of econometric modelling Chakravorti et al. (2009) demonstrated apositive impact of interchange fee reductions on the growth of card acceptance network inSpain, thus positively verifying the passing through effect. Ardizzi (2013) empiricallyinvestigated that decreasing of MIFs in Italy led to a shift towards payment card transactionsin lieu of cash at points of sale although he could not affirm that a zero MIF level would beoptimal for the development of electronic payments. Some economists went a step furtherproposing to eliminate interchange fees altogether (Gans 2007, Leinonen 2011). Leinonenargued that MIFs make merchants less willing to promote card payments instead of cash. It isnot enough to render merchants indifferent by setting MIFs at the tourist test compliant level.Abandoning MIFs in debit card transactions eliminates cross-subsidisation of cash. Leinonensupports the idea of transparent cost-based pricing. In this respect he is accompanied bynumerous other economists who are proponents of changing opaque pricing conventions intomore transparent ones (De Grauwe et al. 2006, Enge and Øwre 2006, Bergman et al. 2007,Humphrey et al. 2008, Van Hove 2008).7
3. Survey methodologyData in the study on merchants’ costs of accepting cash and card payments in Polandwere obtained on the basis of a standardised questionnaire comprising well over 100 detailedquestions which were asked in anonymous Computer Assisted Personal Interviews (CAPI) bya professional market research institute.The survey was carried out in three stages:1. Stage I – preparation (June - July).2. Stage II – interviews with merchants (August - September).3. Stage III – checking and working out the outcomes (October - November).Apart from work on the questionnaire which was subject to extensive consultationswith various market participants (the central bank, commercial banks, acquirers, merchants,consumers), stage I also involved a pilot study, training for pollsters from the researchinstitute and sampling. The sample was selected disproportionately and varied usingemployment and branch of economic activity criterion. Interviews were held all across Poland(as broken down into 8 macroregions by the Central Statistical Office of Poland, GUS). Withthe view to ensuring representativeness, the outcomes were weighted with the real structure ofbusiness population, based on data provided by GUS and the Polish Classification ofEconomic Activities 2007 (PKD 2007), reflecting the European Classification of EconomicActivities (NACE). The study comprised 7 PKD branches/sections from retail trade andservices sector (consumer sale). The businesses were broken down according to employmentcriterion into small- (employing up to 9 people), middle-sized- (employing from 10 to 49people) and large enterprises (50 employees and more).In order to encourage entrepreneurs to provide reliable answers based on financialdocuments maintained in their companies (invoices, print-outs from sales application,terminal print-outs, contract with acquirer) they were presented a cover letter signed by theparties involved in the project: the National Bank of Poland, Foundation for the Developmentof Cashless Payments and the Faculty of Management of the University of Warsaw. Beforeeach interview respondents were shown the letter by pollsters. Sometimes the complexity ofthe study required several contacts with individual businesses to obtain all answers and/or fillout the missing data.Stage III involved checking the correctness of outcomes (the so called validation), aswell as statistical description of respondents’ answers and carrying out cost analysis of cashand cards payments based on data obtained in the study.Pursuant to the study objectives only costs at physical points of sale were estimated,while remote payments were not subject to an in-depth analysis.According to data of the Central Statistical Office of Poland (GUS) there were a totalof 3.9 m businesses in 2011 in Poland. This includes all business entities entered in theREGON register (Register of the National Economy). Depending on the source, the numberof active companies on the Polish market was 1.7 – 1.8 m in general, and 1.1 – 1.3 m in theindustries covered by the study.The study sample comprised 1006 companies. Respondents were senior officersresponsible or co-responsible for decisions on acceptance of payments methods and relatedissues (in practice company owners, CFO’s, chief accountants, senior managers) who8
provided their answers with the support of a salesman/cashier. Sample selection involvedstratification by:a. branch of economic activity,b. size of employment,c. territorial distribution.As it was necessary to draw conclusions with regard to branches (PKD sections) andsize of employment, researchers opted for a disproportionate sample structure, meaning thatthe share of companies from specific branches and of specific size did not reflect the realmarket structure. Proportional sampling would not have provided the right sample size in allof the strata (branch and size of employment).Table 1. Studied population size (registered entities) and structure of the study sample bybranchesBranch(PKD section 2007)*G. Wholesale and retailtrade, repair of motorvehicles and motorcyclesH. Transportation andstorageI. Accommodation and foodservice activitiesM. Professional, scientificand technical activitiesQ. Human health and socialwork activitiesR. Arts, entertainment,recreationS. Other service activitiesSumSize ofbusinesspopulation**Percentage shareof the branch inthe wholestudiedpopulationUnmodified n:number ofenterprises in thesample proportionalto the share ofenterprises in thepopulationActual n in thesample –realisedinterviews1 060 04148%483345, including 6interviews withchains252 82011%111111122 2996%60116336 82214%141117193 2658%8010967 2073%30111235 72010%101972 268 174100%10061006* The sample only covered retailers (B2C transactions).**Population size of companies registered in the REGON register. Branch structure which was used to weigh thedata was based on the structure taken from REGON register, which involved all registered entities. Since noother source was available, it was assumed that that the structure of active entities was the same as for allregistered companies.For the total sample of n 1006 the estimation error was /-3% with significance levelof 95%. Higher share of trade (section G) in the sample was due to a much higher share ofbusinesses from this section in the total population covered by the study, and thus due to thestatistical significance of this section as regards the study objectives. The realized samplen 345 provided for a good basis for conclusions, with estimation error of /- 5.6%. In otherbranches the share in the sample was similar, which ensured only a slightly higher estimationerror ( /- 9%) and a good basis for comparisons between branches.9
Table 2. Sample structure by size of employment- 0-9- 10-49- 50 90%8%2%Unmodified n:number of enterprises inthe sample proportional totheir share in the totalpopulation9058120total100%1006Strata by numberof employeesShare of enterprises of thesame size in the totalbusiness populationActual n in the sample3773782511006The strata 0-9 employees and 10-49 employees were of equal size which ensured thesame estimation error ( /- 5%). The stratum 50 employees and more comprised 251companies. Estimation error for this sample was /-6%A disproportionate sample structure provided for the possibility of inference pertainingto strata by size of employment. If sampling had reflected the real share of enterprises in thetotal business population, the analysis would have been impossible for middle-sized and largeenterprises.As regards the territorial breakdown, the study covered enterprises from cities of morethan 10 000 inhabitants, which account for ca. 72% of the business population in Poland inthe investigated sections. The majority of interviews was carried out in cities above 100 000inhabitants. The sample was representative for the general population of active companies inthe indicated branches of economic activity with the exception of rural areas. Territorialdivision of the sample reflected the distribution of business entities between 8 Polishmacroregions. Stratification was proportional in this case.Data from merchant study were weighted using two criteria: company size (measuredby the number of employees) and branch of economic activity. The data thus obtained wererepresentative and it was possible to make reliable inferences on the total population ofcompanies covered by the study.10
4. Selected descriptive resultsThe survey delivered many interesting results, some of which are presented below.The sample consisted of 1003 firms accepting cash and 359 accepting cards (card presenttransactions).Figure 2. Payment instruments accepted in C2B transactions in Poland (2012).statistically significant difference between the total and a given group of companiesSource: Survey results, n 1006.The goal of the study was to estimate costs of cash and card payments in face-to-facetransactions at physical locations. It turned out than only 19% of all merchants in Poland wereaccepting cards in card present transactions.Table 3. Comparison of average number of points of sale between all firms and firmsaccepting cards (2012).Averagenumber ofpoints ofsaleAll firms1.07Firms accepting cards1.31Source: Survey results, n 1006.Average number ofpoints of sale insmall firms up to9 employees1.031.15Average number ofpoints of sale inmedium sized firms10-49 employees1.521.73Average number ofpoints of sale in largefirms50 employees4.656.53The bigger the firm, the wider was its point of sale network. Companies acceptingcards, regardless of their size (small, medium, large): had more points of sale, were characterised by higher sales and higher number and value of cashtransactionscompared to companies which only accepted cash.11
Figure 3. Average share of payment methods in the total number of transactions (2011).statistically significant difference between the total and a given group of companiesSource: Survey results, n 1006.According to initial declarations of companies 87% of all transactions in 2011 weremade in cash and only 4% with physical use of cards. The share of card transactions rises withthe company’s size. Companies accepting cards reported higher shares of card presenttransactions (in total – 71% for cash, 19% for physical use of cards).The declared share of cash in value of transactions was lower than in number of transactions.After a critical analysis of merchants’ declarations, supplemented by additional dataand information provided by merchants and external sources it was estimated that in 2011 anaverage Pole made 326 cash payments with the total value of EUR 2 233 and 26 cardpayments with the total value of EUR 631. Based on merchant survey data the fraction of cashin the number of consumer-to-business point of sale transactions was 92.6% (7.4% for cards)and 78.3% in value of consumer-to-business point of sale transactions (21.7% for cards).12
Table 4. Cash and card quantitative indicators (2011).All firmsFirms up to 9employeesFirms 10-49Firms 50 Cash N 1003Card N 359Cash n 374Card n 67Cash n 378Card n 151Cash n 251Card n 141Average monthly value ofcash payments per onepoint of sale 5 492 4 282 13 216 25 344Average monthly value ofcard payments per onepoint of sale 4 899 3 649 8 437 9 17979873411361945242181379382 6.89 5.83 11.65 13.11Average monthly number ofcash payments per onepoint of saleAverage monthly number ofcard payments per onepoint of saleAverage value of one cashpaymentAverage value of one card 20.24 20.15 22.33 24.03paymentNote: In 2011 the average EUR/PLN exchange rate in Poland was 4.12. The values provided in the table wereconverted at this exchange rate and rounded.Source: Survey results, cash n 1003, card n 359.As regards all companies the average monthly value of cash payments per one point ofsale in 2011 declared in the survey was only little higher than the average monthly value ofcard payments, but because of bigger discrepancy between the number of average paymentswith these two instruments, the average value of card transaction was almost three timeshigher than that of cash transaction (EUR 20 vs 7). In the case of card payments the averagevalue reported for large companies was exactly the same as in the Polish central bank’sstatistics, which means that most card transactions in Poland are made at points of sale oflarge companies, such as supermarket chains, warehouses or petrol stations.When it comes to costs 74% of merchants perceived cards as more costly than cash.Only 6% claimed that cash was more expensive than cards.13
Figure 4. Perception of cash and card costs (2012)Question: Do you agree that cash/card is cheap: 1 – strongly disagree, 2 – disagree, 3 – neither disagree noragree / do not know, 4 – agree, 5 – strongly agree.Source: Survey results, n 1006.79% of merchants responded positively to the statement that cash was cheap (with 6%of negative answers), whereas only 18% agreed that card was cheap (and as much as 57%didn’t). Bigger companies tended to evaluate cash "cheapness" slightly worse and card"cheapness" slightly better than smaller companies.The views on safety and convenience of cash and card payments were more balanced,although the Polish merchants had a visibly
are defined as multilateral interchange fees (MIFs) and take either a form of a percentage fee or combined fee (a fee with both - ad valorem and flat fee components). Figure 1. Domestic weighted average multilateral interchange fees (MIFs) in Europe (2012) Source: based on EC data (DG Competition). -0.20% 0.00% 0.20% 0.40% 0.60% 0.80% 1.00% 1.20%