Transcription
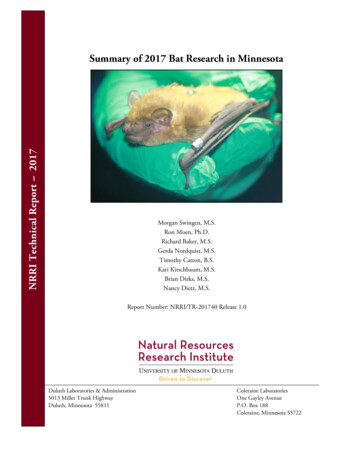
NRRI Technical Report --- 2017Summary of 2017 Bat Research in MinnesotaMorgan Swingen, M.S.Ron Moen, Ph.D.Richard Baker, M.S.Gerda Nordquist, M.S.Timothy Catton, B.S.Kari Kirschbaum, M.S.Brian Dirks, M.S.Nancy Dietz, M.S.Report Number: NRRI/TR-201740 Release 1.0Duluth Laboratories & Administration5013 Miller Trunk HighwayDuluth, Minnesota 55811Coleraine LaboratoriesOne Gayley AvenueP.O. Box 188Coleraine, Minnesota 55722
Minnesota Bat Research2017SummaryBats were captured at 13 study areas across the forested region of Minnesota during June and July 2017 aspart of a statewide project focused on northern long-eared bat habitat use. Northern long-eared bats werelisted as threatened under the Endangered Species Act in 2015 due to the impacts of White-Nose Syndrome(WNS). Information about the summer roosts these bats use to raise their young will be used to informfuture management decisions. Three-hundred fifty bats were captured over 57 nights of mist-netting. Dueto low capture rates of northern long-eared bats, VHF transmitters were deployed on adult little brown andbig brown bats in addition to northern long-eared bats. We tracked 37 bats to their roosts in 81 trees and sixbuildings. All bat species roosted in trees of multiple species, varying size, and different decay stages.Colony size ranged from 1 – 45 at tree roosts and from 2 – 450 at building roosts. Fewer northern longeared bats were captured in 2017 than in previous years, and colony size at northern long-eared bat roostswas also lower than in previous years. These declines are likely the results of WNS mortality. A reportsummarizing all years of this project (2015 – 2017) will be available in 2018.Author Affiliations:MS & RM – UMD Natural Resources Research InstituteRB & GN – Minnesota Department of Natural ResourcesTC – Superior National Forest, USDA Forest ServiceKK – Chippewa National Forest, USDA Forest ServiceBD & ND – Camp Ripley Environmental Office, MN Dept. of Natural ResourcesFunder: Environment and Natural Resources Trust FundReport Number: NRRI/TR-201740 Release 1.0Please contact authors before citing as manuscripts are in review and in preparationThis report and any future releases or corrections will be available online from the University DigitalConservancy (https://conservancy.umn.edu)ii
Minnesota Bat Research2017Table of ContentsSummary . iiTable of Contents . iiiList of Figures . iiiList of Tables . iiiIntroduction . 1Methods . 1Results . 5Discussion . 15Acknowledgements . 16Literature Cited . 17Appendix A. Number of Identified Roosts by Tree Species . 19List of FiguresFigure 1. Photos showing the techniques for capturing and processing bats . 2Figure 2. Map of all 2017 mist-netting locations within the forested region of Minnesota . 4Figure 3. Map of bat mist-netting capture results in 2017 for all species . 5Figure 4. Maps of bat mist-netting capture results by species in 2017 . 6-7Figure 5. Frequency distribution of the diameter at breast height of bat roost trees . 10Figure 6. Histogram showing the decay stage of 81 bat roost trees identified in 2017. . 10Figure 7. Photos of female northern long-eared bat roost trees . 11Figure 8. Photos of big brown bat roost trees identified in 2017 . 12Figure 9. Photos of little brown bat roost trees identified in 2017 . 12Figure 10. Maximum number of bats observed exiting surveyed roost trees in 2017 . 14List of TablesTable 1. Names and abbreviations of study areas . 3Table 2. Count of bats captured and processed by species and sex . 8Table 3. Number of bats captured by age and reproductive condition by week . 8Table 4. Count of bats which were given transmitters by species, sex, and reproductive condition . 9Table 5. Characteristics of tree roosts used by bats in 2017, by bat species and sex . 9Table 6. Distances traveled (in meters) between the capture location and the first roost . 13Table 7. Distances traveled (in meters) between consecutive roosts . 13Table 8. Average bat colony size at tree roosts surveyed in 2017, by bat species and sex . 14iii
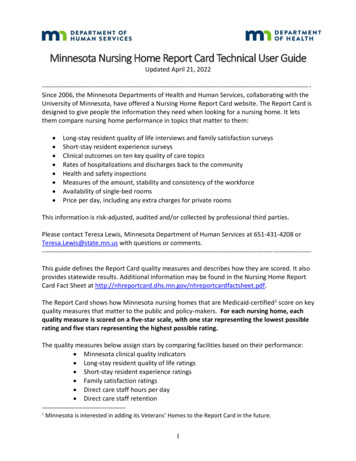
Minnesota Bat Research2017IntroductionWhite-nose syndrome (WNS) is a fungal disease that has devastated bat populations in the eastern UnitedStates, where it was first observed in 2006. WNS has since spread westward, killing more than 5 millionbats by 2012 (U.S. Fish and Wildlife Service 2012). The fungus that causes WNS, Pseudogymnoascusdestructans, thrives in cold humid environments such as the caves and mines that some bats use forhibernation. Bats that are infected with WNS awake more often during hibernation, use up their fatreserves, and then often die of either starvation or exposure to the elements as they search for food in latewinter (Frick et al. 2010). In 2013, the fungus that causes WNS was first detected in Minnesota at SoudanUnderground Mine, and the first bat mortalities from WNS were observed during the winter of 2015/2016(Minnesota Department of Natural Resources 2013, 2016).Eight species of bats have been documented in Minnesota: little brown bats (Myotis lucifugus, MYLU),northern long-eared bats (Myotis septentrionalis, MYSE), big brown bats (Eptesicus fuscus, EPFU),tricolored bats (Perimyotis subflavus, PESU), silver-haired bats (Lasionycteris noctivagans, LANO),eastern red bats (Lasiurus borealis, LABO), hoary bats (Lasiurus cinereus, LACI), and evening bats(Nycticeius humeralis, NYHU). Four of Minnesota’s bat species hibernate in caves and mines and can beaffected by WNS: MYSE, MYLU, EPFU, and PESU. The northern long-eared bat experienced especiallyhigh mortality rates from WNS in the northeastern U.S., which led to its listing as threatened under theEndangered Species Act in 2015.In response to this listing, the Minnesota Department of Natural Resources (MN DNR), University ofMinnesota Duluth – Natural Resources Research Institute (NRRI), and U.S. Forest Service (USFS), begancollaboration in 2015 on a statewide project to study northern long-eared bat summer habitat use, fundedby the Environment and Natural Resources Trust Fund (ENRTF). Northern long-eared bats hibernateduring the winter, but disperse across the forested region of the state during the summer, foraging oninsects at night and roosting in trees during the day. Female bats also give birth and raise their young inthese summer roosts, making information on roost selection critical to maintaining high-quality habitatfor reproduction.Data for this project were collected from across the state in 2015 – 2017, including 13 sites in 2017.Results from previous years were summarized in technical reports (Swingen et al. 2015, 2016), and aforthcoming report will summarize results from the entire project (2015-2017). This report summarizesthe results from the 2017 field season of the ENRTF-funded project, with support from additional fundingsources.MethodsBat Capture/ProcessingField crews set up fine mesh mist-nets (Avinet Inc, Dryden, NY, USA) along forested roads, trails,streams, etc. that could act as travel corridors for bats. Each night, 2 – 4 mist-nets were set up within 200m of a central processing location. We opened mist-nets after sunset, and checked them every 15 minutesfor 2 – 5 hours, depending on capture rates and weather conditions.We identified each captured bat to species, and determined sex, age, and reproductive condition byphysical examination. Each bat was also weighed and measured, and the wings were inspected fordamage potentially caused by white-nose syndrome (Fig. 1). Wing condition was scored from 0 – 3according to the Reichard wing-damage index, where 0 indicates no damage and 3 indicates severedamage (Reichard and Kunz 2009). We then fitted each bat with an individually-numbered lippedaluminum wing band (Porzana Ltd., Icklesham, United Kingdom).1
Minnesota Bat Research2017Figure 1. Photos showing the techniques for capturing and processing bats. Photo Credits: A – SuperiorNational Forest; B – Brian Houck, NRRI; C – Peter Kienzler, NRRI, D – Christi Spak, MN DNR; E –Ryan Pennesi, USFS; F – Nancy Dietz, MN DNR - CRTC.A: Mist-nets are raised on poles with a pulley systemB: A bat flies into the mist-net and is caughtC: Bats are handled with disposable nitrilegloves to prevent spread of WNS between batsD: The wings are examined for damageconsistent with WNSF: A small transmitter is glued to the skin ofthe bat using surgical adhesiveE: A numbered band is attached to the forearm2
Minnesota Bat Research2017Field crews attached radiotransmitters (A2414 Advanced Telemetry Systems Inc., Isanti, MN; or LB-2X,Holohil Systems Ltd., Carp, ON, Canada) to selected adult bats. At the beginning of the summer, welimited transmitter attachment to adult female northern long-eared bats and added other species and sexeslater in the season as we assessed capture success. We trimmed a section of hair in the center of the back,and used surgical adhesive (Perma-Type, Permatype Company Inc., Plainville, CT, USA) to attach thetransmitter to the skin (Fig. 1). We released all bats at the capture site after processing.Tracking/Roost Tree CharacterizationWe tracked bats with radiotransmitters daily to their roosts using radio telemetry until the transmitterfailed or fell off. Data recorded at each roost included roost type, tree species, and decay stage. At dusk,crews returned to the roost trees to conduct emergence surveys. During an emergence survey, personnelwatched the roost tree from 30 minutes before sunset to 1 hour after sunset. During the survey werecorded the number of bats emerging during each 10-minute interval, the location of the exit point, andwhether or not the transmitter left the tree.Crews returned to each roost tree to conduct a more detailed tree characterization after bats left. Thisincluded measuring roost diameter at breast height (dbh), tree height, decay stage, canopy closure, slope,aspect, and recording details about the vegetation surrounding the roost tree.Study AreaWe captured bats with mist-nets at 53 sites grouped into 13 study areas throughout the forested region ofthe state of Minnesota (Table 1, Fig. 2).Table 1. Names and abbreviations of study areas and dates during which bat mist-netting took placeduring the 2017 field season.Study Area NameArden Hills Army Training SiteCamp Ripley Training CenterCass County Sites – Chippewa NationalForest, Cass County Forest, & LandO’Lakes State ForestCloquet Valley State ForestHay Creek Unit – Richard J. Dorer StateForestLake Vermilion – Soudan UndergroundMine State ParkLouisville Swamp Unit – Minnesota ValleyNational Wildlife RefugeMille Lacs Wildlife ManagementArea/Rum River State ForestNemadji State ForestSherburne National Wildlife RefugeThree Rivers Park District – Crow-Hassanand Elm Creek Park ReservesSuperior National Forest – West(Laurentian Ranger District)Superior National Forest – East (Kawishiwiand Tofte Ranger Districts)AbbreviationAHATSCRTCCCMN CountyDate Range7/5 – 7/86/5 – 6/267/17 – 7/26CVSFHCUSt. LouisGoodhueState/CountyState6/5 – 6/86/5 – 6/6LVSSt. LouisStateLSUScottFederalML/RRState6/12 – 6/15NSFSNWRTRPMille Lacs,KannabecPineSherburneHennepin7/18 – 7/207/5 – 7/86/25 – 6/28SNF-WSt. LouisStateFederalThree RiversPark DistrictFederalSNF-ELakeFederal6/12 – 7/1336/20 – 6/226/196/19 – 6/29
Minnesota Bat Research2017Figure 2. Map of all 2017 mist-netting locations within the forested region (shaded) of Minnesota. Eachdot represents a separate mist-netting site. Mist-netting sites were grouped into “study areas” and arelabeled with abbrevations as listed in Table 1.4
Minnesota Bat Research2017ResultsMist-NettingWe conducted 57 nights of mist-netting between June 5th and July 27th, 2017, with multiple crewsoperating simultaneously across the state. Mist-netting took place for 1 – 9 nights at each study area.Species CapturedWe captured and processed 350 bats over 817 net-hours (Fig. 3). We captured individuals of six of theeight bat species recorded in Minnesota (Fig. 4, Table 2). Tricolored bats and evening bats were notcaptured in 2017.Figure 3. Map of bat mist-netting capture results in 2017 for all species. Capture results are displayed bystudy area as listed in Table 1. The size of the symbol at each study area represents the total capture rate(bats/net-hour), and the label at each study area indicates the total number of individuals captured. Notethat the high capture rate at one site in St. Louis County was likely due to the proximity to Soudan Mine(within 1 km of mine entrances), which is the largest known hibernaculum in the state.5
Minnesota Bat Research2017Figure 4. Maps of bat mist-netting results (captures per 10 net-hours) by species in 2017. Capture resultsare displayed by study area as shown in Figure 2 and listed in Table 1. See Table 2 for total captures byspecies.Northern long-eared batLittle brown batBig brown batEastern red bat6
Minnesota Bat Research2017Figure 4 (cont.) Maps of bat mist-netting results (captures per 10 net-hours) by species in 2017. Captureresults are displayed by study area shown in Figure 2 and listed in Table 1. See Table 2 for total capturesby species.Hoary batSilver-haired batTricolored batEvening bat7
Minnesota Bat Research2017Table 2. Count of bats captured and processed during the 2017 field season by species and sex. EPFU –big brown bat, LABO – eastern red bat, LACI – hoary bat, LANO – silver-haired bat, MYLU – littlebrown bat, MYSE – northern long-eared bat, NYHU – evening bat, PESU – tricolored Species CodeLANO MYLU ge Class and Reproductive Status of Captured BatsMost bats captured were adults, but 46 juveniles were also captured, with the earliest juveniles captured(EPFU and LANO) on July 5th at AHATS. The first juvenile Myotis spp. was a MYLU captured on July6th at AHATS. Most captured female bats were pregnant or lactating, with the first lactating bat capturedon June 13th (EPFU) at CRTC and the first lactating Myotis spp. captured on June 20th at LVS (Table 3).Table 3. Number of individual bats captured of all species by age and reproductive condition by week. P –Pregnant, L – Lactating, PL – Post-lactating, TD – Testes descended, NR – Non-reproductive, U –Undetermined. This table only includes those bats for which the reproductive assessment had medium orhigh confidence.AdultWeek ofCaptureNetHours6/5 – 6/111376/12 – 6/181046/19 – 6/256/26 – 7/27/3 – 7/97/10 – 7/167/17 – 7/237/24 – 00211112803358AdultMalesNRTotalJuveni BatsleblankNRU TDNRU06117305502012200430000527221022116 10 11 30 00 50 91 2132816132981153000006002308144558367523638343Wing Damage of Captured BatsWing scores of 1 or higher were recorded for 238 of the 350 bats captured (68%), including individuals ofall six species captured. Moderate (wing score 2) damage was recorded for 7% of cave-hibernating bats(EPFU, MYLU, & MYSE) captured, but only one bat showed severe (wing score 3) damage. Themoderate and severe wing damage we observed was likely caused by WNS, although damage alone doesnot confirm infection.8
Minnesota Bat Research2017Radiotransmittered BatsOur original goal was to deploy transmitters only on reproductive female MYSE, but due to low capturerates in 2017 we began attaching transmitters to female and male MYSE, MYLU, and EPFU. Weattached transmitters to 44 bats, including 20 female MYSE (Table 4). The bats were tracked until thetransmitters failed or fell off, which was between 1 – 31 days (median 6).Table 4. Count of bats which were given transmitters in 2017 by species, sex, and reproductive condition.EPFU – big brown bat, MYLU – little brown bat, MYSE – northern long-eared edTestes DescendedNon-ReproductiveEPFUblankSpecies 2244Roost TreesWe tracked 19 MYSE, 10 MYLU, and 8 EPFU to their roosts in 81 trees and six buildings. Seven of thebats originally given transmitters could not be relocated after release. The 19 MYSE were tracked to 56unique roost trees of at least 17 species (advanced decay of some trees did not allow for identification tospecies), and one roost in a building. The 10 MYLU were tracked to 12 roost trees of at least four species,and three roosts in buildings. The eight EPFU were tracked to 13 roost trees of at least seven species, andtwo roosts in buildings. See Appendix A for a full list of tree species used as roost trees in 2017. All batswith transmitters that roosted in buildings were females. For those bats which were tracked to at least oneroost, we identified an average of 2.8 roosts per bat.The roost trees varied from 12 – 72 cm in diameter at breast height (DBH), with an average DBH of 38cm (Table 5, Fig. 5). Roosts were located in both live trees and dead trees of varying decay stage (Figs.6,7,8,9). Roost tree height ranged from 4 – 30 m (average 15 m).Table 5. Characteristics of tree roosts used by bats in 2017, by bat species and sex. Each cell shows theaverage value followed by the range in parentheses (if applicable). N number of roost trees identified.Bat Species/SexEPFU / FemaleEPFU / MaleMYLU / FemaleMYLU / MaleMYSE / FemaleMYSE / MaleOverallN1215753381DBH (cm)34.7 (13.6 – 53.0)51.841.3 (24.3 – 66.0)25.4 (16.3 – 37.2)39.3 (11.5 – 71.9)34.2 (32.8 – 35.3)37.5 (11.5 – 71.9)9Decay Class3.6 (1 – 7)2.01.8 (1 – 2)4.6 (1 – 6)2.7 (1 – 7)3.3 (1 – 6)2.95 (1 – 7)Height (m)14.4 (4.6 – 21.8)23.613.8 (7.2 – 18.6)10.0 (6.0 – 15.2)16.7 (3.8 – 30.5)6.7 (4.9 – 9.5)15.3 (3.8 – 30.5)
Minnesota Bat Research2017Figure 5. Frequency distribution of the DBH (diameter at breast height) of bat roost trees identified in2017 (n 81).Roost Tree DBH (cm)Number of Roost Trees1614MYSE (n 56)12MYLU (n 12)10EPFU (n 13)8642005101520253035 40 45DBH (cm)50556065707580Figure 6. Histogram showing the decay stage of 81 bat roost trees identified in Minnesota in 2017.Number of Roost TreesRoost Trees by Decay Stage30MYSE (n 56)25MYLU (n 12)EPFU (n 13)201510501Live2Declining3Dead45Loose BarkCleanDecay Stage106Broken78Decomposed Down material9Stump
Minnesota Bat Research2017Figure 7. Photos of female northern long-eared bat roost trees identified in 2017. Top row left to right:American elm (Ulmus americana) snag in Hay Creek Unit, live paper birch (Betula papyrifera) at CampRipley Training Center, green ash (Fraxinus pennsylvanica) snag at Camp Ripley Training Center, livered pine (Pinus resinosa) at Camp Ripley Training Center, live trembling aspen (Populus tremuloides) inCloquet Valley State Forest, and live sugar maple (Acer saccharum) in Hay Creek Unit.AMERICAN ELMPAPER BIRCHGREEN ASHRED PINETREMBLING ASPENSUGAR MAPLE11
Minnesota Bat Research2017Figure 8. Photos of big brown bat roost trees of various species and decay stages identified in 2017. Fromleft to right: bigtooth aspen (Populus grandidentata) snag in the Chippewa National Forest, live red cedar(Juniperus virginiana) in Three Rivers Park District, and bur oak (Quercus macrocarpa) snag on CassCounty land.BIGTOOTH ASPENEASTERN RED CEDARBUR OAKFigure 9. Photos of little brown bat roosts of various species and decay stages identified in 2017. Fromleft to right: Populus spp. snag in the Superior National Forest, live green ash (Fraxinus pennsylvanica) inThree Rivers Park District, and trembling aspen (Populus tremuloides) snag with broken/hanging top inthe Chippewa National Forest.POPULUS SPP.GREEN ASH12TREMBLING ASPEN
Minnesota Bat Research2017MovementsThe 18 female MYSE that were successfully tracked spent an average of 1.5 days (maximum 5 days) ineach roost (of those roosting events with known start and end dates, n 33). Female big brown bats spentan average of 1.3 days in each roost (n 7 roosting events of known length), and male little brown batsspent an average of 1.6 days in each roost (n 18 roosting events of known length). There were less thanthree roosting events of known length for male big brown bats, female little brown bats, and malenorthern long-eared bats.The average distance from the capture (foraging) location to the first roost for all bats was 922 m, and wassimilar for females (936 m) and males (809 m). EPFU traveled farther on average than MYLU and MYSEfrom the capture location to their first roost (Table 6). Distance traveled between consecutive roosts forall bats averaged 296 m, with 80% of consecutive roosts 500 m apart. A male MYSE had the farthestrecorded distance between consecutive roosts at 2193 m (Table 7). Three bats with transmitters (one maleMYLU, one MYLU female, and one EPFU female) re-used roosts on non-consecutive days within thetracking period (e.g. moved from roost A on day 1 to roost B on day 2 and then back to roost A on day 3).Table 6. Distances traveled (in meters) between the capture location and the first roost by bats withradiotransmitters in 2017. Each cell shows the average distance followed by the range in parentheses.SexFemaleMaleOverall AverageEPFU1456 (565 – 3234)6841360 (565 – 3234)MYLU1160 (259 – 2199)1246 (232 – 2261)1177 (232 – 2261)MYSE635 (80 – 1380)59604 (59 – 1380)Overall Average936 (80 – 3234)809 (59 – 2261)922 (59 – 3234)Table 7. Distances traveled (in meters) between consecutive roosts by bats with radiotransmitters in 2017.Each cell shows the average distance followed by the range in parentheses.SexFemaleMaleOverall AverageEPFU317 (33 – 555)317 (33 – 555)MYLU36 (4 – 101)244 (14 – 416)214 (4 – 416)MYSE300 (2 – 1013)739 (12 – 2193)325 (2 – 2193)Overall Average290 (2 – 1013)314 (12 – 2193)296 (2 – 2193)Emergence SurveysField crews conducted 70 emergence surveys on 46 of the identified female northern long-eared bat roosttrees. Bats were observed exiting the roost in 59 of those surveys. Colony size (total count of bats duringone survey) at female northern long-eared bat tree roosts ranged from 1 – 45 and averaged 6.9 (Table 8).Bats were not observed at seven female northern long-eared bat roost trees, which was due to vegetationobstructing the view, misidentification of the roost tree, weather conditions affecting the emergencebehavior of the bats, or the maternity colony having moved to another tree (this sometimes occurred if thetransmitter had fallen off of the bat in a previously used roost tree).13
Minnesota Bat Research2017We also conducted emergence surveys at 23 other identified roost trees used by male northern long-earedbats, and male and female little brown bats and big brown bats. Colony size at roost trees used by femalebats was greater on average than colony size at roost trees used by male bats (Table 8).Table 8. Emergence survey results at tree roosts surveyed in 2017, by bat species and sex. If a roost wassurveyed multiple times, the maximum number of bats exiting among all surveys was used to calculatethe average colony size across trees. Colony sizes reported here are only for those trees at which batswere observed during emergence surveys (n 59). Building roosts were not included for this FM# TotalSurveys70591291# RoostsSurveyed4634781# Roosts with BatObservations3924770MinimumColony Size11212-MaximumColony Size45313534-MeanColony Size8.22.05.51.616.1-Figure 10. Maximum number of bats observed exiting surveyed roost trees in 2017. If a roost wassurveyed multiple times, the maximum number of bats exiting among all surveys is displayed in thefigure so that each surveyed roost tree at which bats were observed appears once (n 59). Emergencecounts at roosts in buildings are not included in this chart.# of Bats Emerging by Roost Tree4035MYSE (n 41)# of Roost Trees3025MYLU (n 11)20EPFU (n 46-50Maximum # of Bats ObservedWe conducted three surveys of the one building used as a roost by a female northern long-eared bat andobserved 3 – 5 bats emerging. At the three buildings used as roosts by female little brown bats, crewsobserved between 2 – 480 emerging (average 183). At the two buildings used as roosts by big brownbats, we observed 44 – 96 bats emerging (average 70).14
Minnesota Bat Research2017DiscussionNorthern long-eared bat capture rates in 2017 (0.04 bats/net-hour) were lower than capture rates forMYSE in 2016 (0.11) and 2015 (0.15). Average colony size at female MYSE roost trees (8.2) was lowerthan in previous years as well (2016 16.4, 2015 21.5). Although many factors can influence capturerates, we suspect these declines are primarily a result of mortality from WNS observed during the wintersof 2015/2016 and 2016/2017 (Minnesota Department of Natural Resources 2016, 2017). At the SoudanUnderground Mine, which is the largest known hibernaculum in the state, winter counts of hibernatingbats in early 2017 were down 73% from the previous year (Minnesota Department of Natural Resources2017). Also noteworthy was that zero northern long-eared bats were observed during 2016/2017 wintersurveys of the Soudan Underground Mine (G. Nordquist, pers. comm.).The proportion of bats with wing damage scores 1 (“light” damage or greater) was also greater in 2017(68%) than in 2015 and 2016 (38% and 41%, respectively). Wing damage does not confirm WNS, but P.destructans infection is known to cause lesions and loss of wing tissue (Reichard and Kunz 2009, Cryanet al. 2010). Thirty-six of the 238 bats with wing damage scores 1 were migratory species (LABO,LACI and LANO) not known to be affected by WNS, although none of these bats were given wing scoresof 2 or 3. Minor wing damage in migratory bats unrelated to WNS has also been observed in the easternU.S. and highlights the importance of lab testing to confirm WNS infection (Francl et al. 2011). Resultsare pending from laboratory tests of swabs collected from a subset of bats captured in this project.Our 2017 field season added 5 new tree species to the existing list of tree species used as roosts by femalenorthern long-eared bats, now totaling 27 species. New tree species documented as roosts in 2017included box elder (Acer negundo), silver maple (Acer saccharinum), hackberry (Celtis occidentalis),black cherry (Prunus serotina), and northern pin oak (Quercus ellipsoidalis). This lends greater support tothe hypothesis that tree species may not be as important to roost selection as other factors such asavailability of cavities, cracks, and loose bark (Boyles 2007, Henderson and Broders 2008).As observed in past years, female northern long-eared bats switched roosts often. The average roostingduration in 2017 (1.45 days) was similar to that observed in 2015 and 2016 (1.33 and 1.25 days,respectively). These durations are also similar to roosting durations reported in Nova Scotia, Michigan,and West Virginia (Foster and Kurta 1999, Johnson et al. 2009, Patriquin et al. 2010), but shorter thandurations reported in West Virginia and the Black Hills of South Dakota (Cryan et al. 2001, Menzel et al.2002).The 2017 season also allowed us to collect roosting data from other bats that can be affected by WNS,including male MYSE, and male and female MYLU and EPFU. We did not observe strong preferences inany of these groups for certain tree species, tree sizes, or decay classes although sample size was small.EPFU and MYLU tended to roost in cavities and crevices, as observed in other studies (e.g. Brigham1991, Kalcounis and Brigham 1998, Agosta 2002, Broders and Forbes 2004, Fabianek et al. 2015).MYSE also roosted in cavities and crevices, as well as under loose bark, which has been commonlyrepo
Results from previous years were summarized in technical reports (Swingen et al. 2015, 2016), and a forthcoming report will summarize results from the entire project (2015-2017). This report summarizes the results from the 2017 field season of the ENRTF-funded project, with support from additional funding sources. Methods Bat Capture/Processing