Transcription
Bielderman et al. BMC Geriatrics 2013, ESEARCH ARTICLEOpen AccessMultidimensional structure of the GroningenFrailty Indicator in community-dwelling olderpeopleAnnemiek Bielderman1*, Cees P van der Schans1, Marie-Rose J van Lieshout2,3, Mathieu HG de Greef1,4,Froukje Boersma5, Wim P Krijnen1 and Nardi Steverink6,7AbstractBackground: Due to the rapidly increasing number of older people worldwide, the prevalence of frailty amongolder adults is expected to escalate in coming decades. It is crucial to recognize early onset symptoms to initiatespecific preventive care. Therefore, early detection of frailty with appropriate screening instruments is needed. Theaim of this study was to evaluate the underlying dimensionality of the Groningen Frailty Indicator (GFI), a widelyused self-report screening instrument for identifying frail older adults. In addition, criterion validity of GFI subscaleswas examined and composition of GFI scores was evaluated.Methods: A cross-sectional study design was used to evaluate the structural validity, internal consistency andcriterion validity of the GFI questionnaire in older adults aged 65 years and older. All subjects completed the GFIquestionnaire (n 1508). To assess criterion validity, a smaller sample of 119 older adults completed additionalquestionnaires: De Jong Gierveld Loneliness Scale, Hospital Anxiety Depression Scale, RAND-36 physical functioning,and perceived general health item of the EuroQol-5D. Exploratory factor analysis and Mokken scale analysis wereused to evaluate the structural validity of the GFI. A Venn diagram was constructed to show the composition of GFIsubscale scores for frail subjects.Results: The factor structure of the GFI supported a three-dimensional structure of the scale. The subscales DailyActivities and Psychosocial Functioning showed good internal consistency, scalability, and criterion validity (DailyActivities: Cronbach’s α 0.81, Hs .84, r .62; Psychosocial Functioning: Cronbach’s α 0.80, Hs .35, r .48). Thesubscale Health Problems showed less strong internal consistency but acceptable scalability and criterion validity(Cronbach’s α .57, Hs .35, r .48). The present data suggest that 90% of the frail older adults experienceproblems in the Psychosocial Functioning domain.Conclusions: The present findings support a three-dimensional factor structure of the GFI, suggesting that amultidimensional assessment of frailty with the GFI is possible. These GFI subscale scores produce a richerassessment of frailty than with a single overall sum GFI score, and likely their use will contribute to more directedand customized care for older adults.Keywords: Frailty, Older adults, Screening, Measurement* Correspondence: j.h.bielderman@pl.hanze.nl1Research and Innovation Group in Health Care and Nursing, HanzeUniversity of Applied Sciences, PO Box 3109, 9701 DC, Groningen, TheNetherlandsFull list of author information is available at the end of the article 2013 Bielderman et al.; licensee BioMed Central Ltd. This is an Open Access article distributed under the terms of theCreative Commons Attribution License (http://creativecommons.org/licenses/by/2.0), which permits unrestricted use,distribution, and reproduction in any medium, provided the original work is properly cited.
Bielderman et al. BMC Geriatrics 2013, ackgroundFrailty is characterized by a decline in reserve capacity in different domains of functioning, resulting in a decline in mobility, unintended weight loss, an elevated risk of morbidity,an increase in depression and anxiety, institutionalization,and premature death [1,2]. Due to the rapidly increasingnumber of older people worldwide, the prevalence of frailtyamong older adults is increasing and expected to escalate incoming decades [3,4]. In order to prevent the detrimentalconsequences of frailty, like the loss of balance and the decrease in muscle strength and walking speed, it is crucial torecognize early onset symptoms and then initiate appropriate care and specific preventive interventions. A number ofreview studies have shown that several interventions may bebeneficial for older adults in different stages of frailty [5-8].Early detection of frailty in older adults is feasible withappropriate screening instruments. These screening instruments measure frailty in various ways [9]. Some measurements are based on a clinical assessment by a geriatricianothers use performance-based tests or self-report questionnaires. A number of frailty assessment instruments haveemerged in the last decade [1,9-23]. These instruments aredesigned to screen older adults in a valid and feasible way.The majority of these screening instruments include itemson physical frailty characteristics like mobility and nutritional status. Only some instruments include items in multiple frailty domains, like the Frailty Index, the GroningenFrailty Indicator, the Tilburg Frailty Indicator and theEdmunton Frail Scale [9]. Especially frailty instrumentsused for case finding and screening, evaluate frailty dichotomously: persons are considered as either frail or not frail,regardless of the multiple dimensions measured by the instrument [9].One of these multidimensional screening instruments isthe Groningen Frailty Indicator (GFI). The GFI is a widelyused screening instrument for identifying frail older adults[22,24]. The GFI consists of 15 self-report items and is afeasible way to assess frailty in both community-dwellingand institutionalized older people [25,26]. Psychometricstudies examining the overall internal consistency of theGFI show a range of Cronbach’s α values, from α 0.68 toα 0.73, indicating moderate internal consistency [25-27].Besides feasibility and reliability, the construct and discriminant validity of the GFI were examined in previous research [26].However, the GFI is being used as a one-dimensionalscale based on an overall sum score of 15 items. A personis considered to be frail when the GFI sum score is 4 pointsor higher [26,27]. The sum score is used as a homogeneousindicator of frailty, without reference to specific problemslike sensorimotor functioning, cognitive functioning, mobility, or psychosocial functioning. Consequently, a varietyof different frailty-related problems can lead to a sum scoreof 4 points. We believe that the GFI has the potential toPage 2 of 9provide more differentiated information about the salienceof specific frailty-related problems, and thus direct a moreadequately focused program for the care and support frailolder adults need. For this reason, an assessment of thevarious dimensions of frailty is obviously needed.The main objective of this study was to evaluate theunderlying dimensionality of the GFI questionnaire forscreening frailty in community-dwelling older persons.In addition, we examined the criterion validity of theGFI subscales. Furthermore, we evaluated the composition of GFI subscale scores for subjects identified asfrail based on the currently used cutoff score of 4 points.MethodsStudy designA cross-sectional study design was used to evaluate thestructural validity and criterion validity of the GFI questionnaire in older adults aged 65 years and older. In this study,data of older adults living in a small city in a centrally located region of the Netherlands were used (N 1508). In asmaller sample (N 119), we examined the criterion validity of the GFI subscales.Study sample and data collectionIn 2008, 3083 older adults (65 years and older) wereapproached by their local health authorities to fill in theGFI questionnaire. Besides, a smaller sample of 200 olderadults was approached by community centers to fill in theGFI and additional questionnaires. In total, 1508 personscompleted the GFI and 119 persons completed the additional questionnaires. Under Dutch legislation, ethicalapproval was not required in this cross-sectional nonobtrusive observational study. All subjects gave theirconsent to participate in the study.MeasuresGFIThe GFI is a 15-item screening instrument used to determine the level of frailty [22]. Eight items have two response categories (yes / no), six items have three responsecategories (yes / sometimes / no), and one item has aLikert response category (1–10). All items were dichotomized to calculate GFI sum scores. A higher GFI sumscore indicates a greater level of frailty, with a maximumscore of 15. The GFI is displayed in Additional file 1.To examine criterion validity, we used four additionalscales or subscales: De Jong Gierveld Loneliness Scale[28], Hospital Anxiety Depression Scale (HADS) [29],physical functioning subscale of the RAND-36 [30], andthe perceived general health item of the EuroQol-5D [31].De Jong Gierveld Loneliness scaleThe 6-item De Jong Gierveld scale was used to measureloneliness [28]. This 6-item Likert scale is a reliable and
Bielderman et al. BMC Geriatrics 2013, alid instrument for measuring overall, emotional, and social loneliness in large surveys of older adults (Cronbach’sα 0.61-0.73) [32]. All items have five response categories(no! / no / more or less / yes / yes!). After recoding, higherscores indicate greater levels of loneliness.HADSThe Dutch version of the 14-item HADS was used to assess the presence of anxiety and depressive states independent of coexisting general medical conditions [29].The HADS consists of an anxiety subscale (7 items) anda depression subscale (7 items). In a general populationaged 65 years and over, the reliability of both the anxietyand depression subscales as the total scale varied withCronbach’s α values between 0.71 and 0.8 [29]. Higherscores represent greater anxiety and/or more depressivesymptoms.RAND-36Self-reported physical functioning was assessed using the10-item physical functioning subscale of the Dutch RAND36-item Health Survey (RAND-36). The RAND-36 is a reliable and valid scale for measuring different aspects ofhealth in different age groups [30,33]. The overall scalecontains eight subscales: physical functioning, social functioning, role limitations caused by physical health problems, role limitations caused by emotional problems,mental health, vitality, bodily pain, and general health perceptions [30]. The physical functioning subscale is a reliable and valid scale for measuring limitations in dailyactivities due to health problems (Cronbach’s α 0.92)[30]. The respondent reports to what extent he feels limited in a particular activity (limited a lot / limited a little /not limited at all). Raw scores are transformed into indexscores ranging from 0 to 100. After transformation, lowerscores on the physical functioning subscale indicate morelimitations in activities of daily living.EuroQol-5DPerceived general health was assessed on a Likert scaleof 1 to 10, where 10 represents excellent general health.This item represents one item in the overall EuroQol5D questionnaire [31].Statistical analysesDescriptive statistics were used to report subject characteristics of the study sample.Structural validity is defined as the degree to which thescores are an adequate reflection of the dimensionality ofthe construct to be measured [34]. Structural validity wasassessed using exploratory factor analysis. Exploratoryprincipal component analysis followed by oblique rotationaccording to the direct oblimin criterion was conducted toexplore factor structure. The number of factors was basedPage 3 of 9on the scree plot evaluation, the size of the eigenvalues, andtheir confidence intervals. All factors with eigenvaluesgreater than one were retained. In case an item did not discriminate well between factors, decisions were made basedon the content of the item and the results of the reliabilityanalysis of the subscales. Reliability of the factor solutionwas determined by calculating internal consistency usingCronbach’s α with corresponding 95% Confidence Intervals(CI). A Cronbach’s α coefficient of 0.80 was considered“good,” 0.70 – 0.80 “acceptable,” 0.60 – 0.70 “questionable,”0.50 – 0.60 “poor,” and 0.50 “unacceptable” [35,36].In addition, scale analysis of the GFI was applied usingMokken item response theory model of monotone homogeneity [37]. Mokken scale analysis tests the homogeneityof the subsets of items of test batteries that are multidimensional by construction [38]. A Loevinger’s scalability coefficient (H) of 0.30 - 0.39 indicates a weak scale, H 0.40 - 0.49indicates a moderate scale, and H 0.50 indicates a strongscale [39].Criterion validity is defined as the degree to which thescores are an adequate reflection of a “gold standard” [34].To establish criterion validity of the observed GFI subscales, the GFI subscales were compared to related reliableand valid scales considered to be gold standards of the individual dimensions. Positive relations were hypothesizedbetween GFI subscale Psychosocial Functioning and HADSand the Jong Gierveld Loneliness scale. Negative relationswere hypothesized between GFI subscale Daily Activitiesand RAND-36 physical functioning scale, and between GFIsubscale Health Problems and Perceived general health(EuroQol-5D). Pearson correlations (two-tailed) betweenGFI subscales and related scales were calculated. A correlation of 0.30 was considered “low,” 0.30 – 0.60 “moderate,” and 0.60 “high” [40].A Venn diagram was constructed to show the composition of GFI subscale scores for all subjects identified asfrail based on the currently used cutoff score of 4 points.The diagram provides information about the compositionof a score of 4 (or more) points. Only subjects that perceived problems in 25% of the items of each subscale arerepresented in the Venn diagram. Differences between thegroups within the Venn diagram were tested by using theChi2 test for categorical data and ANOVA test for continuous data.For frail older adults, frequency distributions for different age groups were calculated and tested for dependencies by using the Chi2 test and estimation of a log-linearmodel. We used the factors indicating age (in categories)and perceived problems in the subscales Daily Activities,Psychosocial Functioning, and Health Problems (scoreon 25% of the subscale items). To increase power, wetreated the latter variables as ordinals.Data from subjects were excluded from further analyseswhen more than five items (30%) of the GFI were missing.
Bielderman et al. BMC Geriatrics 2013, age 4 of 9In total, 17 persons were excluded from further analysesbecause of missing data on the GFI. In the analyzed sample, 1277 persons had no missing data at all, 194 personshad one missing value, 27 persons had two missing values,4 persons had three missing values and 6 persons had fouror five missing values on the GFI. These remaining missing values were imputed by the logistic regression data imputation method [41].Data were processed using the statistical software SPSSstatistics 19 (SPSS Inc., Chicago, IL, USA) and the R statistical programming system (R Development Core Team,2011). Statistical significance level was set to p 0.05.ResultsParticipantsA total of 1508 persons participated in the study. Age ofthe respondents ranged from 65 to 97 years, with a mean(SD) age of 75 (7) years; 49.3% were female, and 41.7%were living alone. Table 1 shows the characteristics of allparticipants.As can be seen in Table 1, the smaller sample differedfrom the main sample in mean age, gender, and livingsituation. Compared to the main sample, the smaller sample consisted of persons with a higher average age (77 vs74 years), relatively more females (71% vs 47%) and moresingle living persons (65% vs 40%). Educational level andGFI total scores of the smaller sample did not differ significantly from the main sample.Factor structure of the GFITable 2 shows the factor loadings after oblimin rotationand eigenvalues from the principal component analysis.Evaluation of the scree plot and the size of the eigenvaluesstrongly suggest that the GFI has a three-dimensionalstructure, explaining 50.6% of the variance. This analysisproduced three subscales: (1) Daily Activities (items 1–4),(2) Psychosocial Functioning (items 11–15), and (3)Health Problems (items 5–10).The rotated factors did not clearly discriminate item 5(“How do you rate your physical fitness?”). Based on content and reliability analysis, this item was assigned to factor3 (subscale Health Problems). Cronbach’s alpha decreased(from .81 to .77) when item 5 was assigned to factor 1(subscale Daily Activities), and increased (from .47 to .57)when item 5 was assigned to factor 3 (subscale HealthProblems).The GFI subscales Daily Activities and PsychosocialFunctioning showed good internal consistency, withCronbach’s α 0.81 (95% CI 0.79-0.83) and Cronbach’sα 0.80 (95% CI 0.78-0.82), respectively. By contrast, thesubscale Health Problems showed a poor internalconsistency (Cronbach’s α 0.57; 95% CI 0.54-0.61). InTable 1 Characteristics of the participants (n 1508)Overall sample (n 1508)Main sample (n 1389)Smaller sample (n 119)t (df) † or Chi2 (df) ‡p74.5 6.974.3 6.877.1 7.7 3.94 (135.5) † 0.001*65 – 69 y418 (29.2)392 (29.8)26 (21.8)20.01 (4) ‡ 0.001*70 – 74 y363 (25.3)344 (26.2)19 (16)75 – 79 y301 (21.0)274 (20.9)27 (22.7)30.81 (2) ‡ 0.001*5.47 (2) ‡0.06529.37 (1) ‡ 0.001* 1.77 (1506) †0.078Mean age (y) SDAge groups, n (%)80 – 84 y206 (14.4)181 (13.8)25 (21) 85 y145 (10.1)123 (9.4)22 (18.5)Male730 (50.7)695 (52.7)35 (29.4)Female709 (49.3)625 (47.3)84 (70.6)Low644 (47.1)582 (46.4)62 (55.4)Middle507 (37.1)467 (37.2)40 (35.7)High216 (15.8)206 (16.4)10 (8.9)Living together848 (58.3)807 (60.4)41 (34.7)Single living606 (41.7)529 (39.6)77 (65.3)3.0 3.02.9 3.03.4 2.7Gender, n (%)Educational level, n (%)Living situation, n (%)GFI, mean SDAbbreviations: GFI Groningen Frailty Indicator.*Values are percentages unless indicated otherwise.†Independent t-test results.‡Chi2 test results.*p 0.05.
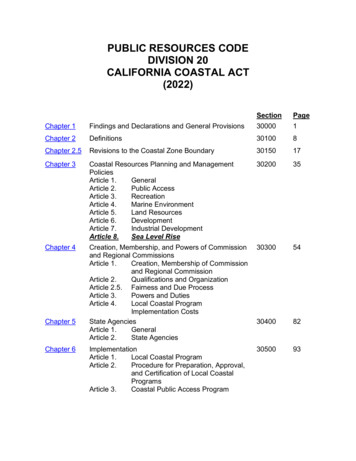
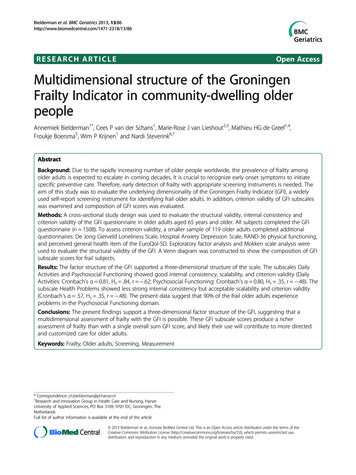
Bielderman et al. BMC Geriatrics 2013, age 5 of 9Table 2 Factor loadings and eigenvalues from theprincipal component analysis of the GFI scale (n 1508)subscale Health Problems was identified as a weakscale (Hs 0.35).Factor*Dailyactivities1. Shopping.6462. Walking outdoors.8483. Dressing and undressing.8554. Going to the toilet.8485. Physical fitness.326Psychosocial Healthfunctioning problems.303.2526. Vision problems.7427. Hearing problems.7378. Unintentional weight loss.3749. Use of more than threemedicines.49810. Memory complaints.33911. Experience of emptiness.82012. Missing people around.80313. Feeling abandoned.78914. Feeling sad/dejected.70815. Feeling nervous/anxious.598Initial eigenvalues (95% mulative variance (%)29.4542.7450.58Abbreviations: GFI Groningen Frailty Indicator, CI confidence interval.*Factor loadings 0.30 are not presented, except for item 5. Bold loadingscorrespond to the subscales.all subscales, Cronbach’s α decreased when any of theitems were deleted.Scale analysis of GFI subscalesTable 3 shows the scaling coefficients (H) from theMokken scale analyses for each of the GFI subscales.The subscales Daily Activities and Psychosocial Functioning were identified as strong scales, with Hs 0.84and Hs 0.54, respectively. On the other hand, theCriterion validity of GFI subscalesWe assessed the criterion validity of GFI subscales by calculating correlation coefficients among the subscales and fourrelated scales (Jong Gierveld Loneliness Scale, HADS, physical functioning subscale of the RAND-36, HADS, andperceived general health item of the EuroQol-5D) (seeTable 4). The subscale Daily Activities was strongly correlated with the RAND-36 physical functioning scale(r 0.62). The subscale Psychosocial Functioning wasstrongly correlated with the HADS (r 0.67) and theJong Gierveld loneliness scale (r 0.67). The subscaleHealth Problems was moderately correlated with thegeneral health rating of the EuroQol-5D (r 0.48). Furthermore, moderate correlations were found between theHealth Problems subscale and the RAND-36 physicalfunctioning (r 0.53), the HADS (r 0.36), and the JongGierveld Loneliness Scale (r 0.37). The rating of generalhealth was moderately correlated with all three GFI subscales—Daily Activities, Health Problems, PsychosocialFunctioning, (r 0.31, r 0.48, r 0.44, respectively).Composition of GFI score for frail subjectsFigure 1 gives a Venn diagram representation of the distribution of the subscale scores for all subjects with atotal GFI score of 4 (N 540). For about one quarter ofthe frail subjects (26.9%), the GFI score was exclusivelycomposed of perceived problems in one domain. In justa limited number of subjects, the GFI score was exclusively composed of perceived problems in the Daily Activities domain (0.9%) or the Health Problems domain(4.1%). For 21.9% of the frail subjects, the PsychosocialFunctioning domain contributed exclusively to the GFIscores.For almost half of the frail subjects (44.3%), the GFIscore was composed of perceived problems in two domains. In only a limited number of subjects, the GFI scoreTable 3 Scaling coefficients from Mokken scale analyses for items of the GFI subscales (n 1508)*ItemDaily activities (item 1–4)Health problems (item 5–10)Psychosocial functioning (item 11–15)Hi (95% CI)Hi (95% CI)Hi (95% CI)10.89 (0.84-0.95)0.40 (0.35-0.45)0.57 (0.54-0.61)20.83 (0.77-0.89)0.34 (0.28-0.39)0.56 (0.52-0.61)30.78 (0.71-0.85)0.28 (0.23-0.33)0.58 (0.53-0.62)40.83 (0.74-0.91)0.30 (0.24-0.35)0.51 (0.47-0.55)5-0.45 (0.39-0.51)0.47 (0.42-0.51)6-0.29 (0.23-0.35)-Hs0.84 (0.78-0.89)0.35 (0.31-0.39)0.54 (0.50-0.57)Abbreviations: GFI Groningen Frailty Indicator, Hi scaling coefficient of item, Hs scaling coefficient of total subscale, CI confidence interval.*Interpretation Loevinger’s scaling coefficients: Hs of 0.30 - 0.40 indicates a weak scale; Hs of 0.40 – 0.50 indicates a moderate scale; Hs 0.50 indicates astrong scale.
Bielderman et al. BMC Geriatrics 2013, age 6 of 9was composed of problems in both the Daily Activitiesand Psychosocial Functioning domains (3.0%), or composed of both the Daily Activities and Health Problemsdomains (5.5%). For 35.7% of the subjects, both the General Health and the Psychosocial Functioning domain contributed to the GFI scores.In total, 28.9% of the subjects experienced problems inall three domains of frailty.The Venn diagram revealed three groups: persons withproblems in one subscale (N 145), those with problemsin two subscales (N 239), and those with problems in allthree subscales (N 156). Table 5 shows the characteristics of these subjects. Subjects that had problems in multiple subscales were significantly older, on average (p 0.001), and had attained a significantly lower educationallevel (p 0.004) than those with problems in only onesubscale. Gender, living situation, and financial status didnot differ between any of the three groups (p 0.05).Among frail subjects, the Chi2 test revealed dependencybetween age and the domains Daily Activities (Chi2 45.72;df 4; p 0.001) and Health Problems (Chi2 38.69; df 4;p 0.001). The data provided no support for an increaseof psychosocial problems with increasing age (Chi2 5.04;df 4; p 0.284). ANOVA revealed interactions betweenage and Health Problems (p 0.001), and age and DailyActivities (p 0.001). Age did not interact with Psychosocial Functioning (p 0.433).DiscussionIn this study, we examined the structural validity and criterion validity of the GFI questionnaire in older adults. Inaddition, we evaluated the composition of GFI scores forfrail older adults. Our findings support a three-dimensionalfactor structure of the GFI, in terms of the subscales DailyActivities (items 1–4), Psychosocial Functioning (items 11–15), and Health Problems (items 5–10). This model explains50.6% of the overall variance. The internal consistency,scalability, and criterion validity of the GFI subscales DailyActivities (Cronbach’s α .81, Hs .84, r .62) andPsychosocial Functioning (Cronbach’s α .80, Hs .54,r .67) are good. Consequently, both subscales identifyproblems in these frailty domains in a reliable and validway. The internal consistency, scalability, and criterionvalidity of the GFI subscale Health Problems is less strong(Cronbach’s α .57, Hs .35, r .48). We surmise thatthe poor reliability and weak scalability of the HealthProblems subscale is due to the heterogeneity of itemspertaining physical health problems perceived by olderadults. The Venn diagram showing the distribution of allsubjects with a total GFI score of 4 revealed that 27% ofolder adults had problems in only one domain, 44% hadproblems in two domains, and 29% had problems in allthree domains (see Figure 1). Furthermore, the presentdata suggest that 90% of the frail older adults experienceproblems in the Psychosocial Functioning domain.In the literature, frailty is hypothesized to arise frommultiple causes and to affect multiple domains of physicaland cognitive functioning [9,42,43]. In different models offrailty, like the Functional Domains model (the accumulation of deficits), the Burden model (the index of healthburden) and the Biologic Syndrome model (frailty as abiological syndrome) multidimensional screening instruments are considered to be most appropriate in screeningfrailty [44]. Although the conceptualization of the multipledomains of frailty is generally used, there is no agreementabout the included dimensions in frailty instruments[11,15,45].In the assessment of frailty, screening instruments aremostly employed in a one-dimensional way. Originally, theGFI applied a cutoff point of a sum score of 4 points orhigher, regardless of the number of domains in which anolder adult faced problems. In addition, other screeninginstruments that distinguish different domains, like theTilburg Frailty Indicator and the Edmunton Frail Scale, alsouse total sum scores to identify frail older adults [11,46].We suggest the results of our study may improve theadequacy of screening on frailty and will offer specificindications for intervening in the early onset of frailty.Table 4 Pearson correlations between the GFI subscales and related scales (n 119)GFI subscale:Daily activitiesHealth problemsPsychosocialfunctioningRAND-36 physicalfunctioningPerceived general health (EuroQol-5D)†HADSDe Jong Gierveld Lonelinessscaler (95% CI)r (95% CI)r (95% CI)r (95% CI) 0.617* 0.3080.2640.003( 0.72- -0.49)( 0.46- -0.13)(0.08-0.43)( 0.18-0.19) 0.525 0.480*0.3550.367( 0.64- -0.38)( 0.66- -0.41)(0.18-0.51)(0.20-0.52) 0.237 0.4390.668*0.671*( 0.40- -0.06)( 0.58- -0.28)(0.550.76)(0.59- 0.76)Abbreviations: GFI Groningen Frailty Indicator, HADS Hospital Anxiety and Depression Scale, CI confidence interval.*Bold loadings represent related scales.†Perceived general health item of the EuroQol-5D questionnaire.
Bielderman et al. BMC Geriatrics 2013, age 7 of 9Health Problems 2 of 6 itemsDaily Activities 1 of 4 items5.5%0.9%N 304.1%N 22N 528.9%N 1563.0%35.7%N 16N 19321.9%N 118GFI 4N 540Psychosocial Functioning 2 of 5 itemsFigure 1 Venn diagram of the frequency distribution of subscale scores for persons with a total GFI-score 4 (N 540).Table 5 Percentages of frail persons (GFI 4) who experience problems in one, two, or three GFI domains (N 540)*One domain (N 145)Two domains (N 239)Three domains (N 156)F (df)† or Chi2 (df)‡p73.54 5.9977.46 6.8480.71 7.1941.14 (2)† 0.001§65 – 69 y27.115.29.476.63 (8)‡ 0.001§70 – 74 y31.416.510.775 – 79 y25.030.420.85.02 (2)‡0.08115.26 (4)‡0.004§0.30 (2)‡0.8612.41 (2)‡0.299Mean age (y) SDAge groups80 – 84 y11.422.826.2 85 4.660.665.7Middle40.031.725.0High15.47.79.3Living together41.043.743.7Single living59.056.356.3No financial problems83.977.279.0Financial problems16.122.821.0GenderEducational levelLiving situationFinancial statusAbbreviations: GFI Groningen Frailty Indicator.*Values are percentages unless indicated otherwise.†One-way ANOVA test results.‡Chi2 test results.§p 0.05.
Bielderman et al. BMC Geriatrics 2013, n this study, three separate dimensions of the GFI wereestablished. These results lend support to the use of theGFI screening instrument as a multidimensional tool forthe analysis of frailty. When we compare our multidimensional analysis with the originally used one-dimensionalapproach, as we showed in the Venn diagram, we nowget a clearer picture of the underlying problems in thefrailty sum scores. Therefore, we question the use of anoverall cutoff point to identify frail older adults. It isclinically relevant to use the GFI as a multidimensionalscale consisting of three subscales in order to direct themost appropriate care and to provide focused supportto older adults facing problems in the different dimensions of frailty. Besides providing support for the use ofthe GFI screening instrument in a multidimensionalway, the present study prompts a fundamental questionabout using an overall score without delineating specificfrailty problems. The question is: Which combinationsof pre-conditions are in fact essential for a valid assessment of frailty? The lack of a conceptual model in whichfrailty is specified results in overestimation and inconsistent identification of frailty in older adults. We propose exploring the possibility of using a conditional cutoff score,one based on both the sum score and the subscale scores.We believe this is necessary for establishing a more convergent diagnosis.We suggest employing a multidimensional assessmentof frailty with the GFI, one that
RAND-36 Self-reported physical functioning was assessed using the 10-item physical functioning subscale of the Dutch RAND 36-item Health Survey (RAND-36). The RAND-36 is a re-liable and valid scale for measuring different aspects of health in different age groups [30,33]. The overall scale contains eight subscales: physical functioning, social .