Transcription
AAPM MeetingJuly 20-24, 2014, Austin TexasArt of Imaging:Diagnostic Ultrasound Image ArtifactsJames A. Zagzebski, Ph.D.,Department of Medical Physics, University of Wisconsin – MadisonZheng Feng Lu, Ph.D.,Department of Radiology, University of Chicago
Introduction Underlying assumptions when formingB-mode images Artifacts for specular reflectors Reverberations Scatter effects, speckle, specklereduction Mirror image artifacts Common artifacts in Doppler Refraction Attenuation, shadowing, enhancement
For those with “SAMs” audience response clickers,Trial question:Illinois is known as the “Land of Lincoln;” Wisconsin is called“ .”20%20%20%20%20%1.2.3.4.5.The Beehive StateAmerica’s DairylandThe Coyote stateThe Beaver StateThe Lone Star State10
Answer 2 America’s Dairyland( http://en.wikipedia.org/wiki/List of U.S. state nicknames )1.2.3.4.5.The Beehive State (Utah)America’s Dairyland (Wisconsin)The Coyote state (S. Dakota; officially, Mt Rushmore state)The Beaver State (Oregon)The Lone Star State (Texas)
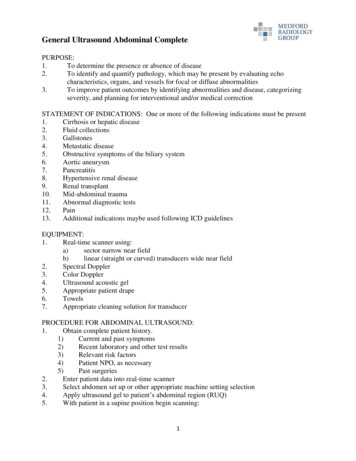
Underlying Assumptions when forming images:Echo Arrival Time(Assumes a Sound Speed, usually 1,540 m/s)
Underlying Assumptions when forming images:Direct “beams” over scannedregion150-200 “acoustic scan lines”(beam lines)25-50 sweeps/sPulse repetition frequency ofabout 25 x 200 4,000 /sDots representing echo signals are displayed along a line that represents theultrasound beam axis. Location along the line depends on echo arrival times.
Underlying Assumptions when forming images:Dot brightness represents the echo signal amplitude. Try tooptimize TGC, etc., so this indicates relative reflectivity.
Which of the following is NOT assumed implicitlyduring the formation of a conventional ultrasound Bmode image?20%20%20%20%20%1.2.3.4.5.echoes originate from along “beam” axeswave speed is 1540 m/sbrightness indicates reflectivity levelspeckle reveals microscopic details of scatterersTGC corrects for attenuation throughout10
Answer 4: “speckle reveals microscopic details ofscatterers” is not an assumption.B-mode Imaging Assumptions Pulse-echo transit times can be converted toreflector depth through uniform tissue models. Echoes originate (only) from locations along thetransmit-receive axes of pulse propagation path. First order correction schemes (such as TGC)adequately account for acoustic wave attenuationand absorption. Display brightness encodes tissue echogenicity.JA Zagzebski, Essentials of Ultrasound Physics, Mosby, St Louis, 1996. Chapter 7.F Kremkau, Chapter 6 in Textbook of Diagnostic Sonography, SL Hagen Ansert, Elsevier,2012, Chapter 6.
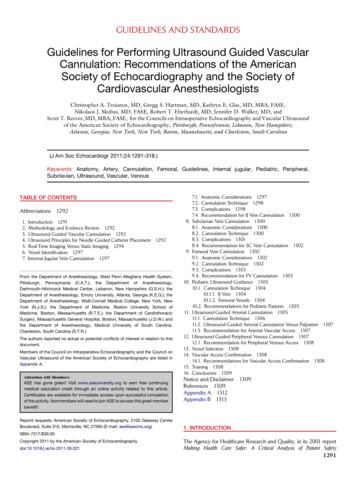
Echoes from the superior pole of thekidney are weaker (do not appear asbright) than those from the proximalsurface because of changes inover the liver-kidney interface.20%20%20%20%20%1.2.3.4.5.Beam focusingfrequencyacoustic impedancedepthincident beam angle10
Answer 5: changes in incident beam angleSpecular Reflector: effects on ability tooutline an objectImpedance change atliver-to-kidney interfacelikely is uniformBeams from acurvilinear arrayemerge perpendicularto surface of apertureStrong effects of beamangle on detectedamplitude, displaybrightnessJA Zagzebski, Essentials ofUltrasound Physics, Mosby, StLouis, 1996. Chapter 7.11
Spatial Compounding Uses “beam steering”technology Combines scans from differentangles More completely outlinesinterfaces that are notperpendicular to primarybeam direction Smoothes random dots calledspeckle
.Entrekin RR1, Porter BA, Sillesen HH, WongCooperbergPL. “ Real-time spatial compound imaging: AD,2000ATL Ultrasoundapplication to breast, vascular, and musculoskeletal ultrasound.” Semin Ultrasound CT MR. 2001 Feb;22(1):50-64
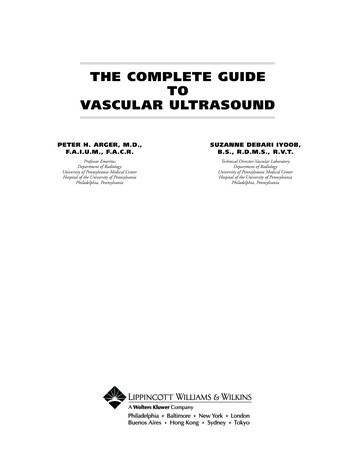
The region of brighter echoesin this longitudunal view ofthe liver and kidney are mostlikely due to which of essA focal massHigher speed of sound in this regionSide lobe artifactsReverberationsStress from a swollen kidney10
Answer 4: Reverberations (likely, the most ubiquitous ultrasound artifact)JA Zagzebski, Essentials of Ultrasound Physics, Elsevier, 1996.FW Kremkau, Sonography Principles and Instruments,, Elsevier, 2011.Images of a Gammex 403 PhantomTransducer in direct contact12 mm tissue-like layer between thetransducer and the phantom
Reverberation Artifacts16
Reverberation ArtifactsAir bubble ina water-filledcondom.17
ReverberationsReverberations hereProduce “noise” here.Entrekin RR1, Porter BA, Sillesen HH, Wong AD, Cooperberg PL. “ Real-time spatial compoundimaging: application to breast, vascular, and musculoskeletal ultrasound.” Semin Ultrasound CT18MR. 2001 Feb;22(1):50-64
ReverberationsReverberations hereProduce “noise” here.Entrekin et al, Semin Ultrasound CT MR.2001 Feb;22(1):50-6419
ReverberationsIdeal(?)Donadon & Torzilli, Am JRoent,198(4): April, 2012.No ReverbsPark et al, “Introperative Contrast –enhancedsonographic ,” J Ultrasound Med 35(7): 1287-91,2014.Fundamental problem: musttransmit through tissue layersMedlinePlus, 2012Body wallReverbs
.Entrekin et al, Semin UltrasoundCT MR. 2001 Feb;22(1):50-64Harmonic ImagingTransmit a low-frequency pulse (2-5 MHz)The pulse gradually distorts due to nonlinear propagation second harmonic generationHarmonic field is weaker than fundamental as incident beampropagates through superficial layers21
Reverberations22
Harmonic BeamReverbs weakHarmonicBeam (increasesas depth increases)23
“Clarify” (Siemens Medical Solutions)Uses power Doppler signals to remove unwanted gray scale echo signals from vessels.Doppler flow phantomAfter applying Clarify
ExamplesReverberationof reverberations occurringwithin distal objects,Artifactsnot back and forth between transducer and object.“Comet Tail”“Ringdown”25
“Comet Tail” Artifacts (a reverberation phenomenon)Seldinger wire a few millimetres above itsentry to the jugular vein.Reusz G et al. Br. J. Anaesth. 2014;112:794-802 The Author [2014]. Published by Oxford University Press onbehalf of the British Journal of Anaesthesia. All rightsreserved. For Permissions, please email:journals.permissions@oup.comReverberations within a biopsy needle.Schwartz DB, Zwiebel WJ, Zagzebski JA, Arbogast AL. ”Use ofreal-time ultrasound to enhance fetoscopic visualization,” J ClinicalUltrasound. 11(3): 161-164 (1983).
Ringdown Artifacts(a reverberation phenomenon)Water couple a transducer to aphantom; then withdraw theprobe from the phantomsurface. Effect is as shown onthe right.
Ringdown Artifacts(a reverberation phenomenon)Water couple a transducer to aphantom; then withdraw theprobe from the phantomsurface. Effect is as shown onthe right.Repeat the experiment afteradding detergent to the water.Bubbles result in a “ringing”artifact.This is the origin of what hascome to be known as“ringdown artifacts.
Ringdown Artifacts(a reverberation phenomenon)Water couple a transducerto a phantom; thenwithdraw the probe fromthe phantom surface. Effectis as shown on the right.Repeat the experiment afteradding detergentPhased Array(Bubbles result in a “ringing” artifact)Linear Array
Ringdown Artifacts(a reverberation non
What 2 factors arecombined on this B-modeimage? (Hint, 1 is anartifact, the other involvesacquisition/processing.)1.20% 2.20% 3.20% 4.20% 5.20%Specular reflection angle effects and harmonic imagingSpecular refection angle effects and speckle reductionRing down and Spatial compound imagingReverberations and harmonic imagingShadowing and spatial compounding10
Answer 3: Ringdown artifacts viewed with Spatial compound imagingReverberation ArtifactsRing-down artifacts from the stomach imaged with both conventional(A and C) and spatial compound imaging (B and D)Veterinary Radiology & Ultrasound Volume 51, Issue 6, pages 621-627, 4 NOV 2010DOI: full#f3
Scan courtesy of Dr. StephenThomas, Dept of Radiology,University of Chicago.These 2 images of the bladder are identical, except one uses multiple transmitfocal zones (left) while the other does not (right). The most likely cause of theechogenic region in the lower half of the bladder on the left is: (Hint, multipletransmit zones often result in an elevated PRF.)20%20%20%20%20%1.2.3.4.5.ReverberationsRange ambiguityBeam width artifactsMirror image artifactsSpeed of sound artifacts10
Answer 2: Range ambiguity artifact RT O’Brien, JA Zagzebski, FA Delaney, Rangeambiguity artifacts, Vet Radiology & Ultrasound 42: 542-545, 2001.Echo signalEcho signals, artifacts, acoustic noise from “beam n” arizing beyond theFOV are detected; if PRF is too high, they are picked up after transmittingalong beam n 1.)Reverb from bottom ofphantom, beam nTime (beam n)1/PRFTime (beam n 1)Beam nBeam n 1
“Specular Reflection” vs Scatter Scatter helps visualizenormal structures. Scatter helps visualizeabnormal structures.35
Liver Hemangioma visualized because ofscatter changes w/normal tissue
SpeckleJA Zagzebski, Essentials of Ultrasound Physics, Mosby, St Louis, 1996. Chapter 7.
Gray Scale Texture, “Speckle” Each dot we see on the image does not represent a singlescatterer. Each dot is the result of echo signals simultaneouslydetected from many scatterers insonified by the pulse. “Interference” effects help create the dot pattern.– Signals from individual scattering entities reinforce, partiallycancel, or completely cancel, depending on their relative phases. Most consider this a noise phenomenon. Spatial compounding combines “views” of the scatteringfield from different directions; reduces speckle. Some manufacturers are taking measures to reducespeckle.38
Image of a phantom, showing speckle(Philips Ultrasound)39
Spatially Compound image of a phantom, showing reduced speckle(Philips Ultrasound)40
Speckle Reduction Imaging (SRI)By Coherent DiffusionAlgorithm Adapts Based on Image Feature; if statistical test results for a pixel regionare consistent with the area being “speckle”, smoothing is done. If there arespecular-type interfaces, the original data are maintained.41(GE Medical)
GE’s SRI (Speckle Reduction Imaging)Different levels of “filtering”42
Speed of Sound Artifacts43
Speed of Sound ArtifactsKremkau FW, Taylor KJ., “Artifacts in ultrasound imaging,” JUltrasound Med. 1986 Apr;5(4):227-37.44
Speed of Sound ArtifactsMuscle SOS 1560 m/sCartilageSOS 2500 m/sThe soft tissue-to-lung interface (arrow)should appear straight, but the higher SOS inthe cartilage results in the interfaceappearing curved.45
Therapy planning and monitoring Superimposed CTand Ultrasoundimage, aftercorrecting for SOSeffects. “Density basedcorrection” Each pixel alongeach beam line isshifted accordingto new SOSestimations basedon CT density.Fontanarosa D, van der Meer S, Bloemen-van Gurp E, “Magnitude of speed of soundaberration corrections for ultrasound image guided radiotherapy for prostate and otheranatomical sites.” Med. Phys. 2012; 39 (8): 5286-92.
Therapy planning and monitoring Superimposed CTand Ultrasoundimage, aftercorrecting for SOSeffects. “Density basedcorrection” Each pixel alongeach beam line isshifted accordingto new SOSestimations basedon CT density.Muscle, ConnectiveFat, AdiposeMast T, “Empirical relationship between acoustic parameters inhuman soft tissues.” Acoustics Research Letters online, 2000; 1:37.Fontanarosa D, van der Meer S, Bloemen-van Gurp E, “Magnitude of speed of soundaberration corrections for ultrasound image guided radiotherapy for prostate and otheranatomical sites.” Med. Phys. 2012; 39 (8): 5286-92.
Therapy planning and monitoring Typical results for prostate, using theshift of the centroid of the target as ametric:1p2p3p4p5p-1.3 mm-3.6 mm-3.1mm-3.3 mm-2.8 mmAverage shift, -2.8 mm “ a larger apparent depth of theprostate is produced by the SOSaberration, with differentmagnitudes according to the relativeimportance of the amount of fattissue and urine content in thebladder [1520 m/s with respect tomuscle tissue [1580 m/s overlyingthe prostate.”Fontanarosa D, van der Meer S, Bloemen-van Gurp E, “Magnitude of speed of soundaberration corrections for ultrasound image guided radiotherapy for prostate and otheranatomical sites.” Med. Phys. 2012; 39 (8): 5286-92.
Sound Speed Correction1.48 mm/msec ATS Phantom Imaged at 1.54 mm/msecZonare allows the machine tochange the assumed SOS in thebeamformer in order to optimizethe sharpness. Notive here the SOSin the phantom is 1480 m/s whilethe machine assumes 1540 m/s inthe beamformer.49(Courtesy of Larry Mo, Zonare Corp.)
Sound Speed Correction1.48 mm/msec ATS Phantom Imaged at 1.48 mm/msecZonare allows the machine tochange the assumed SOS in thebeamformer in order to optimizethe sharpness. Here the SOS in thephantom is 1480 m/s and themachine assumes 1480 m/s in thebeamformer.Image Rescaled to 1.54 mm/msec Dimensions50(Courtesy of Larry Mo, Zonare Corp.)
Sound Speed CorrectionAverage Patient8.5 MHz Breast Image at 1.54 mm/msecZonare allows the machine tochange the assumed SOS in thebeamformer in order to optimizethe sharpness. Here the SOS in thetissue is unknown, yet the machineassumes 1540 m/s in thebeamformer.51(Courtesy of Larry Mo, Zonare Corp.)
Sound Speed CorrectionAverage Patient8.5 MHz Breast Image at 1.44 mm/msecZonare allows the machine tochange the assumed SOS in thebeamformer in order to optimizethe sharpness. Here the SOS in thetissue is unknown, but the bestimage is achieved when themachine assumes 1440 m/s in thebeamformer.Many scanners now employapplication specific presets where alower SOS is assumed along at leastpart of the path.Image Rescaled to 1.54 mm/msec Dimensions52(Courtesy of Larry Mo, Zonare Corp.)
Another artifact: Scan an ATS 539 Phantom1.2.3.4.Echo from surface of objectEcho from strong reflectorEcho from object produced by 23 reflected by strong reflector53
Use a Larger FOV: Mirror Image Artifacts1.2.3.4.Echo from surface of objectEcho from strong reflectorEcho from object produced by 23 reflected by strong reflector54
Mirror Image Artifacts1.2.3.4.Echo from surface of objectEcho from strong reflectorEcho from object produced by 23 reflected by strong reflector55
Mirror Image ArtifactsStill, calm Colorado River, canyon, and mirrored 56
Mirroring can be side-to-sideSide wall of Gammex 403 phantom is the mirror57
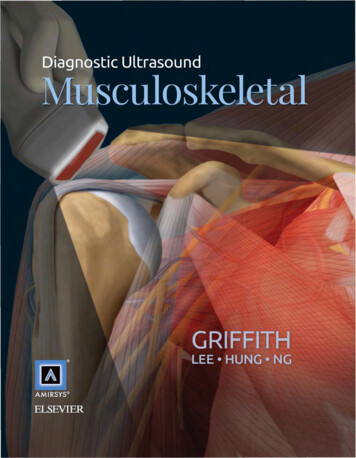
This B-mode image obtained witha transvaginal transducer,illustrates an early pregnancy(arrow). It also presents aninteresting example of what typeof artifact? (red arrow)20%20%20%20%20%1.2.3.4.5.Side lobeAttenuationMirror imageReverberationsSpeed of sound10
Answer 3: Mirror imageMirror-Image Artifact of Early Pregnancy on TransvaginalSonographyJUM November 1, 2012 vol. 31 no. 11 1858-1859Imaging done with a tightly curved curvilineartransducer (note, this image is oriented properly)Actual fetal sacMirror image
Mirror Image Artifact (Spectral Doppler)Flow in this carotid artery is right-to-left.However, it appears bi-directional.Mirror Image Artifacts in Doppler:- being perpendicular to flow;- using too high a gain- dead transducer elements(?)60
Mirror Image Artifact (color) Inferior vena cava “extra” vessel Mirror is thediaphragm in thiscase.Pozniak, M, Zagzebski, J and Scanlan, K, “Spectral and Color Doppler Artifacts,”Radiographics12, 35-44, 1992.61
PW Doppler Processing and Spectral DisplaySensitive to the changing phase of the returning echo signalsDoppler Frequency2f o v cosθFD cDoppler FrequencyTimeTime1 sec
PW Doppler Processing and Spectral DisplayWith proper “angle correct”, can display as a velocity vs. time c v FD 2f o cosθ Blood VelocityTime1 sec
This Doppler signal waveform is inadequate, mainly because ofwhich ing downSpeed of soundSpectral mirroringBlood Velocity1 sec10
Answer 1: AliasingDoppler Signal Formation with PW Doppler(Sampling at the PRF)1.2.3.4.Doppler mode pulses transmitted alonga “Doppler beam line”Operator selects location, gate size of a“sample volume”Doppler signal (yellow signal curve forexample) from this volume is generatedthrough a “sampling” process ie, shown here with the white arrowsThe sample rate equals the pulserepetition frequency (PRF)!JA Zagzebski, Essentials of Ultrasound Physics,Mosby, St Louis, 1996. Chapter 5.
Arrows representsampling timesAliasing occurs if the Dopplerfrequency exceeds ½ the PRF.Ideal signalSampled result
Manifestation of AliasingPRFVelocity scale
After increasing the Velocity Scale (or the PRF)PRFVelocity scale
To get rid of aliasing: Change thevelocity scale Change thebaseline Use a lowerultrasoundfrequency
This image illustrates an example of:20%20%20%20%20%1.2.3.4.5.AliasingSpectral mirroringPoor Doppler angleErroneous angle correctToo low a PW ultrasonic frequencyApparentPeak Velocity22 cm/s10
Answer 4: Erroneous angle correctThe angle correct is established by the sonographer. The erroneoussetting in the previous case resulted in an apparent peak velocity of 22cm/s.With the correct setting, the peak velocity appears to be 110 cm/s.ApparentPeak Velocity110 cm/sJA Zagzebski, Essentials of Ultrasound Physics, Mosby, St Louis, 1996. Chapter 5.
This image of a hepatic veinsuggests bi-directional flow (arrow)just below the gall bladder. This is aclear manifestation of:20%20%20%20%20%1.2.3.4.5.A dissectionThe US frequency set too lowA stenosisAliasingThe color gain set too high10
Answer 4, AliasingColor flow imaging is based on pulsedDoppler principles. Aliasing occurs if theDoppler frequency exceeds ½ the PRF,and results in a wrapping around on thecolor scale.This is an image of the same structureafter the velocity scale was increasedfrom 12 cm/s to 21 cm/s, and the PRFwas increased from 0.6 kHz to 1.0 kHz.Scan courtesy of Dr. David Paushter, Deptof Radiology, University of Chicago.
This B-mode image (left) and color flow image (right) shows a urinarybladder. The color image on the right exhibits an artifact (arrows)known ainingenhancementcolor bleeding10
Answer 1, twinkling The twinkle artifact isassociated with calcifications,stones, and other roughobjects. It has been attributedto system clock jitter, noise, andeven bubbles. (Mitchell C, Pozniak M, Zagzebski J,Ledwidge M. “Twinkling artifact relatedto intravascular suture.” J UltrasoundMed 22:1409–1411, 2003.)
A point-like reflector will result in a line on the image; the length of the line equals thebeam width at the depth of the reflector.76
Beam Width ArtifactsSingle elementtransducerBeam is wide hereFocal zone; beam isnarrowBeam is wide here77
Receivefocusing offTransmit focusing applied to asingle depthReceive focusing is disabledTransmit Focusing Only
Receivefocusing onTransmit focusing applied to asingle depthReceive focusing done in the“beam former”- Uses time delays- Changes dynamicallyDynamic Receive Focusing
80
This image is of a phantom thatcontains 4 mm diameterspherical, low scatter objects.The objects are not visualizedover the first 4 .5 cm (seeimage). This is due fractionSpeed of soundBeam widthSlice thickness10
Answer 5, Slice thickness effects.Slice thickness is largehereElevational focalzoneSlice thickness is largehereJA Zagzebski, Essentials of Ultrasound Physics, Mosby, St Louis, 1996. Chapter 2.82
ConventionalTransducer“1 ½ D”Transducer
ConventionalTransducer1½DTransducer
Grating Lobes (array transducers)85
86
87
88
89
Example of side lobe, grating lobe90
Effects of side/grating lobes from a damaged curvilineartransducer. This image shows a section (red) of an ATS539 phantom.Courtesy of Douglas Pfeiffer,Boulder Community Foothills Hospital
Brighter, or “enhanced” echosignals are seen in this imagebelow the echo free mass. This isa result of:20%20%20%20%20%1.2.3.4.5.Improper TGC settingsLower density in the massLower attenuation in the massHigher speed of sound in the massLower acoustic impedance of the mass10
Answer 3: Lower attenuation in the mass introduces “echo enhancement”Attenuation Artifacts (useful)JA Zagzebski, Essentials of Ultrasound Physics, Mosby, St Louis, 1996. Chapter 7.93
Attenuation Artifacts (useful)EnhancementShadowing(Attenuation in a cyst is lower than insurrounding tissue)(Attenuation in mass is greaterthan that in surrounding tissue)94
Refraction Effects95
Refraction Effects96
Refraction EffectsButtery B, Davison G. “The ghost artifact,”J Ultrasound Med. 1984 Feb;3(2):49-52.97
Recap:Which one of the following willreduce reverberation artifacts20%20%20%20%20%1.2.3.4.5.Apply compound imagingUse coded excitationUse harmonic imagingUse a low transmit powerAvoid using curvilinear arrays10
Answer 3: Harmonic ImagingIt will at least partially help. Usually do not get thedramatic results as seen in these 2 images.Entrekin RR1, Porter BA, Sillesen HH, Wong AD, Cooperberg PL. “ Real-time spatial compoundimaging: application to breast, vascular, and musculoskeletal ultrasound.” Semin Ultrasound CTMR. 2001 Feb;22(1):50-6499
Answer 3: Harmonic ImagingIt will at least partially help. Usually do not get thedramatic results as seen in these 2 images. Typical:UW Archives100
Coded ExcitationTransmitted Pulse Train1 1 1 0 1 0 1 1EncoderBody SensitivityIncreaseReceived Pulse Train1 1 0 1 0 1 1 1Decoder(matched filter)Coded Excitation improves sensitivityRichard Chiao, Ph.D.without resolution tradeoffCourtesy of GE UltrasoundGE Medical Systems
Recap:This is an image of a tissue-likephantom containing an inclusion.The bottom of the phantomexhibits a discontinuity in theregion beneath the inclusion. Theinclusion appears to have athan the phantommaterial.20%20%20%20%20%1.2.3.4.5.TM GelInclusionGreater densityLower attenuationHigher attenuationLower speed of soundHigher speed of sound10
Speed of Sound ArtifactsAnswer 4, Lower speed ofsound, causing the bottomof the phantom to appeardisplaced downward in theB-mode image.TM Gel SOS 1560 m/sTM Gel SOS 1560 m/sSilicon DropletSOS 1200 m/sThe interface (arrow) should appear straight,but the lower SOS in the silicon results in theinterface appearing curved and distorted.H Lopez, K M Harris “Ultrasound interactions with free silicone in a tissue-mimickingphantom. “ J Ultrasound Med 17: 163-170, 1998.103
Recap:Shadowing and enhancement(right) artifacts are most closelyrelated to spatial variations in20%20%20%20%20%1.2.3.4.5.AttenuationOrgan shapeAcoustical impedanceSpeed of soundEchogenicity10
Answer 1GBShadowing and enhancementartifacts are most closely related tospatial variations in attenuation.The gall bladder (GB) is fluid filled,and the attenuation coefficient ofbile is lower than that ofsurrounding tissue. This results inhigher amplitude echo signals fromdistal to the GB.JA Zagzebski, Essentials of Ultrasound Physics, Mosby, St Louis, 1996. Chapter 7.
Recap:To best visualize shadowing and enhancementfeatures of breast masses, sonographers areadvised to avoid use of .20%20%20%20%20%1.2.3.4.5.Harmonic imagingTime gain compensationSpeckle reductionCompound imagingHigh ultrasound frequencies10
Answer: d – compound imaging.Ref: ACR Breast Ultrasound Accreditation Program TestingInstructions. American College of Radiology, Reston, VA.12014. Page 2.(Supposedly, for small masses that are shallow, it mighthide the shadowing and enhancement artifacts. )
Final Artifact: Difficulties scanning (flat window)phantoms with curvilinear array transducers.Detecting damaged transducers is the most important QA task.Can only make contact with part of curved probesSolution 1, with gel coupling, rock transducerGel coupling403 GS phantom
Artifacts when scanning (flat window) phantoms withcurvilinear array transducers using water dam.Solution 2: use a phantom with a curved window410 GS phantom
Artifacts when scanning (flat window) phantoms withcurvilinear array transducers using water dam.Solution 2: use a phantom with a curved window(but most of us have flat window phantoms)Solution 3: use water in the water dam (bad artifacts!)403 GS phantom
Artifacts are totally removed using whole milk.Grade A Homogenized milk;(SOS 1525-30m/s; sufficient attenuation to cut downspurious echoes )Solution 4: use milk in the water dam!!!403 GS phantom
Thanks, from America’s Dairyland, and the Land ofLincolnSolution 1: rock the transducerSolution 2: use a phantom with a curved windowSolution 2: use water in the dam (bad artifacts with curved probesSolution 4: use milk in the water dam403 GS phantom
application to breast, vascular, and musculoskeletal ultrasound." Semin Ultrasound CT MR. 2001 Feb;22(1):50-64 . 20% 20% 20% 20% 20% 1. A focal mass 2. Higher speed of sound in this region 3. Side lobe artifacts . Schwartz DB, Zwiebel WJ, Zagzebski JA, Arbogast AL. "Use of real-time ultrasound to enhance fetoscopic visualization," J .