Transcription
OverviewReport was released in October of 2019Reviews the Province’s commitment to add 15,000 new longterm care beds (the LTC expansion).The report: Explains how long-term care is funded by the Province Estimates the cost of the LTC expansion Analyzes how the LTC expansion will affect the wait list andwait times for long-term care Discusses how individuals waiting for long-term care impacthospital capacity and hallway health careFinancial Accountability Office of Ontario fao-on.org2
Background:Long-Term Care in OntarioFinancial Accountability Office of Ontario fao-on.org3
Long-Term Care in OntarioThere are 626 long-term care homes in Ontario thathouse over 78,000 residents.Most LTC residents are over the age of 75 and live withconditions that have compromised their health.LTC homes must be licensed by the ministry and canbe for profit, not for profit or municipal organizations.Financial Accountability Office of Ontario fao-on.org4
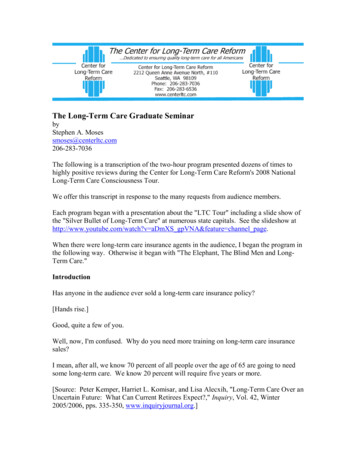
The Wait List for Long-Term Care Has Increased In 2018-19, there were nearly 35,000 Ontarians on the wait list for long -term care. The wait list for long-term care has grown substantially since 2011-12, increasing by78 per cent.40,00035,000Long-Term Care Wait 02011-12Financial Accountability Office of Ontario fao-on.org2014-152015-1652016-172017-182018-19
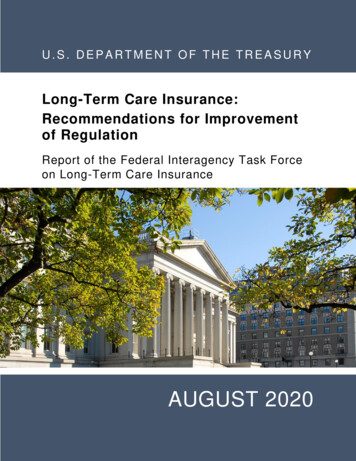
Time to Placement for LTC Has Also Increased From 2011-12 to 2018-19, the median time to placement (or wait time) for a long term care bed increased from 99 days to 152 days.160146140133Days to 402002011-122012-13Financial Accountability Office of Ontario fao-on.org2013-1462016-172017-182018-19
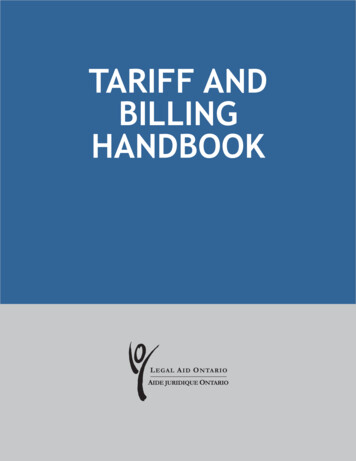
Why Did The Wait List and Wait Times Increase? High growth in the number of Ontarians aged 75 and over combined with a lack ofinvestment in new long-term care beds. Between 2011 and 2018, the number of long-term care beds in Ontario increased by only0.8 per cent while the population of Ontarians aged 75 and over grew by 20 per 00080,00078,00020% growth1,000,0000.8% ,88674,000850,00072,00070,0002011 20182011Long-Term Care Beds (left axis)Financial Accountability Office of Ontario fao-on.org 2018Ontarians Aged 75 (right axis)7800,000
How Does the Province FundLong-Term Care?Financial Accountability Office of Ontario fao-on.org8
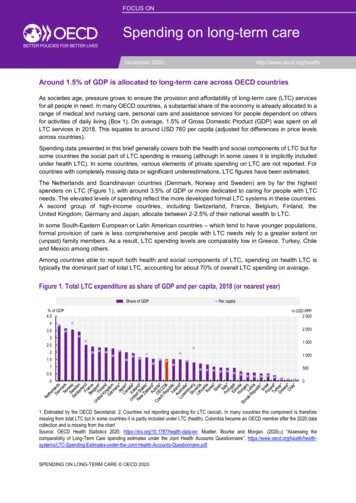
Long-Term Care Homes Program Spending The Province funds long-term care through the long-term care homes program,spending 4.3 billion in 2018-19. The Long-Term Care Homes program area represented 7 per cent of healthsector spending in 2018-19.Capital;1.9; 3%Hospitals;22.2; 35%OHIP (Physiciansand Practitioners),14.9, 24%Other Programs,8.0, 13%Ontario DrugPrograms;4.8; 8%Community Programs;6.2; 10%Financial Accountability Office of Ontario fao-on.orgLong-Term Care Homes;4.3; 7%9
Long-Term Care Homes Program Spending LTC home operators receive payments from the Province based on the number ofbeds in operation and the type of services provided. LTC home operators also receive payments from residents which vary based onthe type of accommodation.oLTC home operators remit the cost of basic accommodation to the Province to offsetsome of the program cost.2018-19 long-term care homes program spending by category, millionsCategoryNursing and Personal CareProgram and Support ServicesRaw FoodBasic AccommodationTotal LOC Per DiemSupplementary Funding Programs millions2,9192792681,5955,0627645055278713Total Cost of Long-Term Care Homes Program5,826100Less: Resident Co-paymentsNet Cost to Province of Long-Term CareHomes Program-1,5374,289Note: Excludes payments made by residents that are retained by LTC home operators(e.g. for semi-private and private rooms).Source: Information provided to the FAO by MLTC.Financial Accountability Office of Ontario fao-on.org10%
Long-Term Care Homes Program Spending From 2011-12 to 2018-19 long-term care homes program spending grew by an annualaverage of 2.5 per cent, increasing from 3.6 billion in 2011-12 to 4.3 billion in 2018-19. Level of care per diem funding increased at an annual average of 2.1 per cent which isslightly higher than the rate of inflation over the same time period at 1.7 per cent. Supplementary funding increased at an annual average of 4.2 per cent.Long-term care homes spending, 2011-12 to 2018-19 billionsNursing and Personal CareProgram and Support ServicesRaw FoodBasic AccommodationTotal LOC Per DiemSupplementary Funding ProgramsTotal Cost of Long-Term CareHomes ProgramLess: Resident Co-paymentsNet Cost to Province of LongTerm Care Homes ProgramNumber of 477,86278,00678,34078,35778,51778,6640.1%Source: Information provided to the FAO by MLTC.Financial Accountability Office of Ontario fao-on.org11
Timing and Cost ofthe LTC ExpansionFinancial Accountability Office of Ontario fao-on.org12
Long-Term Care Expansion In July 2018, the Province announced its commitment to add 15,000 new long-termcare beds over the next five years. The 15,000 new beds represent the first meaningful increase to the supply of longterm care beds in over 15 years. The process for building or redeveloping a long-term care bed in Ontario beginswhen the LTC home operator signs a development agreement with the Ministry ofLong-Term Care. It takes approximately three years from the execution of a development agreement towhen the first resident occupies a new bed.Financial Accountability Office of Ontario fao-on.org13
Long-Term Care Expansion Timing As of October 2019, the Province had allocated 7,889 of the 15,000 beds. If the remaining beds are allocated by March 2021, all 15,000 beds could be inservice by 2023-24.16,00014,0005,079Number of 0001,0302020-21Financial Accountability Office of Ontario fao-on.org2021-222022-23142023-24Total
Long Term Care Expansion Cost The 15,000 new beds will not impact long-term care program spending until eachbed comes into service and begins to receive LOC per diem payments andsupplementary funding. The supplementary funding includes payments to subsidize the construction of thebed over 25 years. As of 2019, a newly constructed bed that is in operation is eligible to receive a dailypayment of between 18.03 and 23.03 over 25 years to cover the cost ofconstruction. In total, the FAO estimates the construction of the 15,000 new beds will cost theProvince 2.0 billion (in 2019 dollars) or about 135,000 (in 2019 dollars) per bed.Financial Accountability Office of Ontario fao-on.org15
Long Term Care Expansion Cost LTC homes program spending will increase by a total of 1.7 billion over five years,as new beds come into service. Once all 15,000 beds are in service provincial spending will increase by an ongoingannual amount of approximately 970 million.15,000 new beds will increase LTC homes program spending by 1.7 billion over five years( millions)LTC homes program spendingincrease for 15,000 new LTC 5058631,732Source: FAO.Financial Accountability Office of Ontario fao-on.org16
LTC Homes Program Spending Forecast LTC homes program spending will grow at an annual average of 5.4 per cent over thenext five years, increasing from 4.3 billion in 2018-19 to 5.6 billion in 2023-24. LTC homes program spending growth will accelerate in 2021-22 as over 6,000 bedsare expected to come into service in that year.6.0Long-Term Care 20-214.03.53.0Financial Accountability Office of Ontario fao-on.org2021-22172022-232023-24
Effect of the LTC Expansion onthe Wait List and Wait TimesFinancial Accountability Office of Ontario fao-on.org18
Number of LTC Beds The 15,000 new long-term care beds will increase the supply of long-term care spacesin Ontario from 78,700 in 2018-19 to approximately 93,700 in 2023-24.95,00093,664Number of 0070,0002019-20Financial Accountability Office of Ontario fao-on.org2020-212021-22192022-232023-24
Long Term Care Wait List Projection The wait list is projected to increase over the next five years despite 15,000 new beds. The wait list is expected to peak in 2020-21, before most of the new beds are opened.42,00040,206Long-Term Care Wait 6234,00032,00030,0002018-19Financial Accountability Office of Ontario fao-on.org2019-202020-212021-22202022-232023-24
Reasons for Wait List Increase High growth in Ontarians aged 75 and over will lead to long -term care demandoutpacing the 15,000 new beds. The number of Ontarians in need of a long-term care bed placement is expected toincrease by 17,000, outpacing the 15,000 new beds. From 2018-19 to 2023-24, the number of Ontarians aged 75 and over is projected togrow by an annual average of 4.3 per cent.4.3%4.5%Average Annual -14 to 2018-19Financial Accountability Office of Ontario fao-on.org2018-19 to 2023-2421
Long Term Care Wait Times ProjectionThe FAO projects a decrease in wait times by 2023-24. 250Days to -20Financial Accountability Office of Ontario fao-on.org2020-212021-22222022-232023-24
Program Targets and Benchmarks The Ministry of Long-Term Care does not have a target or benchmark for the wait listor wait times. Health Quality Ontario (HQO) publicly reports on five LTC indicators that currentlyhave targets or benchmarks. While median time to placement (or wait times) is an indicator measured by HQO, andreported publicly, HQO has not identified an appropriate target or benchmark for LTCwait times.Financial Accountability Office of Ontario fao-on.org23
Comparison to Other Jurisdictions Compared to British Columbia and Alberta, Ontario has significantly longer waittimes for a long-term care bed. In British Columbia, there are 28,000 long-term care beds with a wait list of about1,400 people and a median time to placement of 12 days. Alberta has a target of placing 65 per cent of patients into continuing care within30 days.oIn 2017-18, Alberta fell short of the target, placing only 52 per cent of clients within the30-day window.oLess than three per cent of long-term care homes in Ontario place 50 per cent of clientswithin 30 days.Financial Accountability Office of Ontario fao-on.org24
Long-Term ImplicationsFinancial Accountability Office of Ontario fao-on.org25
Long-Term Implications Beyond 2023-24, high growth in the number of elderly Ontarians will continue. To maintain the projected wait list at 36,900 Ontarians, the Province would need to add55,000 more LTC beds by 2033-34.75 Population Growth85 Population Growth5.0%4.5%4.7%4.3%4.2%Average Annual -19 to 2023-24Financial Accountability Office of Ontario fao-on.org2023-24 to 2033-3426
Impact on Hallway HealthcareFinancial Accountability Office of Ontario fao-on.org27
Hallway Health Care “Hallway health care” refers to the estimated 1,000 patients receiving care inunconventional hospital spaces in Ontario on any given day. Patients are in unconventional spaces partly because hospital beds are occupied bypatients waiting to go elsewhere (e.g., long-term care or rehabilitation facility). In November 2018, over 4,600 of the Province’s 34,000 hospital beds were occupied bypatients waiting to go elsewhere.Financial Accountability Office of Ontario fao-on.org28
LTC Wait Times Contribute to Hallway Health Care ALC patients waiting for long-term care wait much longer than other ALC patients.Average hospital length of stay for ALC patients in OntarioAcute Care DaysALC DaysTotal average lengthof stay in hospitalALC patients waiting for a long-termcare bed155469All other ALC patients141529Source: Information provided to the FAO by MLTC. In 2017-18, patients waiting in hospitals for a long-term care placement occupied340,000 hospital bed days or about five per cent of all hospital bed days in Ontario. In 2017-18, patients waiting in hospitals for long-term care beds cost the Provinceapproximately 170 million.Financial Accountability Office of Ontario fao-on.org29
Will the LTC Expansion Help End HallwayHealth Care? LTC beds are being placed in areas of the Province with the longest LTC wait lists andmost hospital capacity occupied by patients waiting for an LTC placement. However, the FAO projects that the wait list and wait times for LTC will peak in 2020-21.o This implies that, in the absence of other health sector changes, the problem of hallway healthcare will get worse over the next two years.By 2023-24, the FAO projects that wait times will drop below 2018-19 levels.oIf this also reduces the number of hospital bed days occupied by patients waiting for anLTC bed, then, all else being equal, there could be an improvement in hallway health care by2023-24.Financial Accountability Office of Ontario fao-on.org30
Thank You2 Bloor Street West, Suite 900, Toronto, Ontario, M4W 3E2416.644.0702info@fao-on.orgfao-on.org
The Province funds long-term care through the long-term care homes program, spending 4.3 billion in 2018-19. The Long-Term Care Homes program area represented 7 per cent of health sector spending in 2018-19. Long-Term Care Homes Program Spending Hospitals; 22.2; 35% OHIP (Physicians and Practitioners), 14.9, 24% Ontario Drug Programs; 4.8; 8%