Transcription
OPTIMUM CLEANUP SCENARIOS FOR VOC’S AND PERCHLORATE INBALDWIN PARK OPERABLE UNIT, SAN GABRIEL VALLEY,SOUTHERN CALIFORNIAbyChristian SamA Dissertation Presented to theFACULTY OF THE GRADUATE SCHOOLUNIVERSITY OF SOUTHERN CALIFORNIAIn Partial Fulfillment of theRequirements for the DegreeDOCTOR OF PHILOSOPHY(CIVIL ENGINEERING)August 2008Copyright 2008Christian Sam
DedicationTo:My beloved family and friends who have helped me in the strive for success!ii
Table of ContentsDedicationiiList of TablesviList of FiguresviiAbstractxChapter 1 IntroductionProblem StatementHistory of the ContaminationPerchlorateResearch ContributionsResearch ObjectivesManagement ModelStudy AreaSources of DataContaminantsDeveloping the Hydraulic Gradient Control SchemeCoupling Simulation with OptimizationPCE and TCE Superfund SitesDissertation Overview11234566131414161819Chapter 2 Current Clean Up EffortsCleanup StrategyAgencies Effecting CleanupBaldwin Park Operable Unit Cleanup HistoryPotentially Responsible Parties (PRPs)ContractorsPrecipitationHydrograph – Baldwin Park Key WellResearch Strategy212122253031313234Chapter 3 Literature ReviewGround Water ContaminationGroundwater Management ModelsModel SelectionHydraulic Gradient Control4748495253iii
Table of ContentsChapter 4 GeohydrologyGeologic SettingGeologic UnitsAquifer SystemsModel LayersGroundwater Elevations, Flow Directions and Seepage VelocitiesRecharge and Discharge56565658596465Chapter 5 Proposed MethodologyComputer ProgramsConceptual ModelModel AssumptionsMass Transport ModelNumerical SimulationDevelopment of the Optimization ModelHydraulic Gradient Control SchemeLinear Optimization FormulationOptimization Program - LINDO66676770717379838588Chapter 6 Case Study – Baldwin Park Operable Unit Proposed MethodologySan Gabriel Valley BasinSimulation Model Development and OptimizationStudy Area - Baldwin Park Operable UnitGroundwater DataHydraulic Gradient Control System ComponentsContaminant PlumeWater BudgetModel CalibrationModel VerificationManagement Model8990929497100101101106115117Chapter 7 Case Study ResultsResults of the Simulation ModelParticle Tracking Model – MODPATH ResultsDeveloping the Hydraulic Gradient SchemeContaminant Transport Model – RT3D ResultsSummary of RT3D ResultsSystem Economic AnalysisOptimization Model ResultsSensitivity Analysis123123125127128143143147150iv
Table of ContentsChapter 8 ConclusionSummaryConclusionRecommendation for Implementation152152154157References158v
List of TablesTable 2.1 BPOU Water Treatment Projects27Table 2.2 Treatment Technologies for Contaminants in BPOU30Table 4.1 Aquifer Systems59Table 4.2 Lithologic Layers60Table 6.1 Sources of Model Data91Table 6.2 Aquifer Parameters95Table 6.3 Active Pumping Wells97Table 6.4 Monitoring Wells98Table 6.5 Stress Period100Table 6.6 PEST Calibration Result112Table 6.7 Calibration and Verification Periods113Table 6.8 Decision Variable Summary118Table 7.1 Summary of Contaminant Concentration143Table 7.2 Unit Cost of Water144Table 7.3 Optimal Policy for Optimization Model149Table 7.4 Cost Summary150vi
List of FiguresFigure 1.1 Main San Gabriel Basin7Figure 1.2 San Gabriel Basin Operable Units8Figure 1.3 Hydrologic Boundaries of San Gabriel Basin9Figure 1.4 Satellite Image of BPOU10Figure 1.5 3-D Surface map of BPOU11Figure 1.6 Shaded Relief Map of BPOU12Figure 1.7 Flow Chart for Iterative Simulation with Optimization16Figure 2.1 Hydraulic Gradient Control Scheme22Figure 2.2 Average Annual Rainfall San Gabriel Basin32Figure 2.3 Baldwin Park Key Well Hydrograph33Figure 2.4 PCE Conc. at Monitoring Well W10BDMW2 Baldwin Park36Figure 2.5 PCE Conc. at Monitoring Well W11AJMW2 Baldwin Park37Figure 2.6 PCE Conc. at Monitoring Well W11AJMW3 Baldwin Park38Figure 2.7 PCE Conc. at Monitoring Well W11AJMW4 Baldwin Park39Figure 2.8 TCE Conc. at Monitoring Well W11AJMW2 Baldwin Park40Figure 2.9 TCE Conc. at Monitoring Well W11AJMW4 Baldwin Park41Figure 2.10 TCE Conc. at Monitoring Well W11WOMW1 Baldwin Park42Figure 2.11 PCR Conc. at Monitoring Well W11AJMW1 Baldwin Park44Figure 2.12 PCR Conc. at Monitoring Well W11AJMW2 Baldwin Park45Figure 2.13 PCR Conc. at Monitoring Well W11AJMW4 Baldwin Park46vii
List of FiguresFigure 4.1 Well Lithology58Figure 4.2 Plan View – Cross Sections ABC and CD61Figure 4.3 Geologic Profile ABC62Figure 4.4 Geologic Profile CD63Figure 5.1 Conceptual Unconfined Aquifer69Figure 6.1 Finite Difference Grid93Figure 6.2 Hydraulic Conductivity Zones96Figure 6.3 Hydrologic Base Period103Figure 6.4 Transient General Head Boundary, Pumping and Monitoring Wells105Figure 6.5 Transient Calibration at Monitoring Well Z1000006114Figure 6.6 Transient Calibration at Monitoring Well W10OSMW3114Figure 6.7 Transient Calibration at Monitoring Well Z1000008115Figure 6.8 Transient Verification at Monitoring Well W11AJMW3116Figure 6.9 Transient Verification at Monitoring Well W10BDMW2116Figure 6.10 Transient Verification at Monitoring Well W10WOMW1117Figure 7.1 Head Contours at the end of June 2006 – Layer 1124Figure 7.2 MODPATH Pathlines at the end of June 2006 – Layer 1126Figure 7.3 MODPATH Pathlines at the end of June 2006 – Layer 2127Figure 7.4 Contaminant Transport Calibration and Verification - PCE129Figure 7.5 Contaminant Transport Calibration and Verification - TCE129viii
List of FiguresFigure 7.6 Contaminant Transport Calibration and Verification - PCR130Figure 7.7 PCE Concentration at the end of June 2006 – Layer 1131Figure 7.8 PCE Concentration at the end of June 2006 – Layer 2132Figure 7.9 TCE Concentration at the end of June 2006 – Layer 1133Figure 7.10 TCE Concentration at the end of June 2006 – Layer 2134Figure 7.11 PCR Concentration at the end of June 2006 – Layer 1134Figure 7.12 PCR Concentration at the end of June 2006 – Layer 1135Figure 7.13 Head Contours at the end of June 2010 – Layer 1135Figure 7.14 Head Contours at the end of June 2010 – Layer 2136Figure 7.15 Head Contours at the end of June 2010 – Layer 3136Figure 7.16 PCE Concentration at the end of June 2010 – Layer 1137Figure 7.17 PCE Concentration at the end of June 2010 – Layer 2138Figure 7.18 TCE Concentration at the end of June 2010 – Layer 1139Figure 7.19 TCE Concentration at the end of June 2010 – Layer 2140Figure 7.20 PCR Concentration at the end of June 2010 – Layer 1141Figure 7.21 PCR Concentration at the end of June 2010 – Layer 2142ix
AbstractThe Baldwin Park Operable Unit (BPOU) in the San Gabriel Valley basin, California hasbeen identified by the USEPA as a groundwater contaminant superfund site. Thisresearch employs optimized hydraulic gradient control to cost-effectively remove thecontaminant plumes. Perchlorate (PCR) and Volatile Organic Compounds (VOCs),predominantly tetrachloroethene (PCE) and trichloroethene (TCE) are still prevalent inthe Baldwin Park Operable Unit (BPOU). This study proposes a methodology thatoptimizes available groundwater and surface water resources and blocks, traps andreduces the contaminant concentration below the maximum contaminant level (MCL) ornotification level (NL).The current strategy by USEPA and other agencies involved in the cleanup of BPOU is“pump and treat.” Pump and treat has not been effective as high levels of PCE, TCE andPCR are still prevalent in BPOU after approximately 14 years of cleanup. Blendinggroundwater from wells not impacted by the contamination with groundwater from wellsimpacted by the contamination is a supplemental strategy employed by the waterpurveyors to circumvent the contamination problem. This research provides an overallsystematic strategy to clean up the entire aquifer at BPOU.The MODFLOW, MODPATH and RT3D modules of Ground Water Vistas (groundwater modeling program) are used to generate the ground water flow model, particletracking model and contaminant transport models. Further migration of the contaminantsis limited. Contaminants are rapidly trapped and removed by a set of experimentallyx
designed injection and production wells. The procedure utilizes sequential simulationwith optimization to optimally and rapidly remove the contaminants using a hydraulicgradient scheme. The hydraulic gradient scheme was run to test future scenarios usingassumed wet and dry cycles from the hydrologic base period.An economic analysis was performed to compare the cost of the existing system with thecost of the strategy proposed in this study. The strategy proposed in this study resulted ina cost effective solution.xi
Chapter 1Introduction1.1 Problem StatementIn 1999, the United States Environmental Protection Agency (USEPA) determined thatvolatile organic compounds (VOCs) have been released into groundwater in the SanGabriel Valley basin and that a substantial threat of release to groundwater still existed(USEPA, 1999). High concentrations of Volatile Organic Compounds (VOC’s) exist inthe Baldwin Park Operable Unit (BPOU) of the San Gabriel Valley basin. The term“Operable Unit” (OU) defines a discrete action that is an incremental step toward acomprehensive site remedy (USEPA, 1999). Operable units address certain geographicareas, specific site problems, initial phases of a remedy, or a set of actions over time(USEPA, 1999). Tetrachloroethene (PCE) and trichloroethene (TCE) form the bulk ofthe VOC’s found in the region. PCE and TCE are solvents used for degreasing andcleaning. Perchlorate (PCR) is an inorganic component of solid-fuel rockets. PCRexists in large quantities in the Baldwin Park Operable Unit of the San Gabriel ValleyBasin. This study focuses on PCE, TCE and PCR in the Baldwin Park Operable Unit(BPOU).The contaminant plume affects potable groundwater in several Operable Units in SanGabriel basin. The contamination spreads as groundwater is pumped. This is a result ofhigh demand for groundwater supply and scarcity of surface water sources. Overdraftoccurs when groundwater production exceeds natural and artificial replenishment. Thecontaminant plume not only threatens current groundwater production but also prevents1
future use of valuable groundwater resources.1.2 History of the ContaminationThe contaminants TCE, PCE, other VOC’s and PCR are a result of manufacturing andindustrial spills in El Monte, South El Monte, Azusa and Baldwin Park in the 1980s.Since the groundwater flow is south west, most of the contaminants from El Monte havemigrated to South El Monte and contaminants from Azusa migrated south to BaldwinPark.Groundwater contamination by volatile organic compounds (VOCs) in the San GabrielValley basin was first detected in 1979 when Aerojet Electrosystems in Azusa samplednearby wells in the Valley County Water District. Subsequently, the CaliforniaDepartment of Health Services (CDHS) initiated a well sampling program to assess theextent of contamination. By 1984, high levels of VOCs were detected in 59 wells in theSan Gabriel Valley basin. Hundreds of individual facilities could be contributing to thecontamination in the basin through improper handling and disposal practices. The area ofcontamination parallels the San Gabriel River to the east. The watershed is drained bythe San Gabriel River and Rio Hondo River that are tributaries of the Los Angeles River.The basin's groundwater provides approximately 90 percent of the domestic water supplyfor over 1,000,000 people who live in the Valley. Over 400 water supply wells are usedin the basin to extract groundwater for industrial, business, agricultural, and domesticuses. Forty-five different water suppliers operate in the basin and provide drinking2
water to more than 1,000,000 people. In 1992, USEPA completed construction of awater treatment plant for the Richwood Mutual Water Company to assist them inproviding water that meets drinking water standards (Main San Gabriel BasinWatermaster, 2006)1.3 PerchoratePerchlorate is an inorganic contamination that exists in the form of salts. The mostcommon type is ammonium perchlorate. Perchlorate occurs naturally and is also a byproduct of industrial or manufacturing spills. Perchlorate is used industrially as solidpropellants for rockets, missiles and fireworks. It is also used in the production ofmatches, flares, pyrotechnics, ordnance and explosives.Perchlorate was initially discovered in California in 1997 and subsequent groundwatermonitoring revealed that the contaminant was widespread in drinking water (CDHS,2006). Currently no federal or state drinking water standards (Maximum ContaminantLevel - MCL) exist for Perchlorate. However the California Department of HealthServices (CDHS) has an advisory notification level of 6 μg/L. The CDHS recommendsconsumer notification for contaminant levels slightly above this standard and sourceremoval for levels far exceeding this standard.3
1.3.1 Health Effects of PerchloratePerchlorate is deemed to cause interference with iodide uptake by the thyroid gland thatresult in decreased production of thyroid hormones. The thyroid hormones are neededfor prenatal and postnatal growth and development, as well as for normal metabolism andmental function in the adult (CDHS, 2006).1.4 Research ContributionsThis research will further the understanding of contaminant migration and current state ofpollution in the Baldwin Park Operable Unit. The models developed here utilize state ofthe art software and the most up-to-date engineering principles and theories.The current remedy at the superfund sites in San Gabriel Valley basin is large-scale"pump and treat" (i.e., groundwater extraction and treatment). “Pump and Treat” has notbeen very effective as high concentrations of PCE, TCE and PCR still exist in theBaldwin Park Operable Unit.The methodology presented in this research provides an optimal method to rapidlyremove the contaminants from the aquifers. A comprehensive transient contaminanttransport model is developed using the RT3D module of Groundwater Vistas(groundwater modeling program). Further migration of the contaminants is limited.Contaminants are rapidly trapped and removed by a set of experimentally designedinjection and production wells. The procedure utilizes sequential simulation withoptimization to optimally and rapidly remove the contaminants.4
1.5 Research ObjectivesMulti-objectives govern the optimal allocation of groundwater and surface water fromsources to users to disposal sites. The original objectives of this research were developedby Dr. Dennis E. Williams, owner, Geoscience Incorporated and Research Professor ofCivil and Environmental Engineering at the University of Southern California (USC).Dr. Williams consulted Stetson Engineers, the engineers for the Main San Gabriel ValleyWatermaster (Watermaster). The objectives of this research are: determine the origin of the contaminants; PCE, TCE and PCR; determine where the contaminants are going (predict the fate and transport); develop a groundwater flow model using MODFLOW, a particle tracking modelusing MODPATH, a solute transport model using RT3D. Then “layer” on theoptimization code to simulate several cleanup scenarios; use the groundwater flow model, particle tracking, solute transport model andoptimization models to determine the optimum cleanup schemes for both VOC’sand perchlorate (PCR).This study developed a contaminant transport model and an optimization model thatmanaged the optimal allocation of surface and groundwater supplies under the constraintof minimizing PCE, TCE and PCR contaminant plumes in the Baldwin Park OperableUnit in San Gabriel Valley basin. An economic analysis was also performed to comparethe cost of operating the existing system with the cost of operating the strategy proposedin this study.5
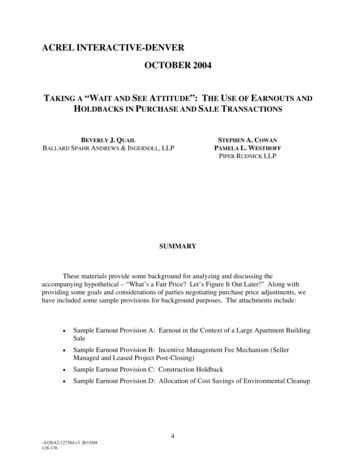
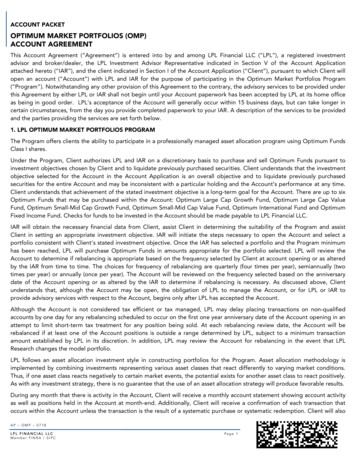
1.6 Management ModelThe management objectives considered in the optimization problem include: Meeting theprojected water demands; maximizing groundwater use; maximizing reclaimed wateruse; minimizing imported water use; minimizing overdraft; minimizing PCE and TCEcontaminant plume and minimizing total operation and maintenance cost.This study analyzes simulation with optimization as a viable management tool for waterallocation under the prevailing condition of extracting the contaminant plume. Thesolutions to the cost optimization model provide managers with a set of policies thatdetermine optimal groundwater pumping rates and schedules and the allocation ofgroundwater from sources to users to disposal sites whilst restraining the contaminantplume to a desired concentration level. A linear optimization scheme is developed tooptimally remove the contaminant plume at the lowest cost.1.7 Study AreaBaldwin Park Operable Unit (BPOU) is approximately 1 mile wide and 8 miles long.BPOU lies in the central portion of the San Gabriel Valley Basin (Figure 1.1),approximately 25 miles from the Pacific Ocean, in eastern Los Angeles County. BPOUlies south of the San Gabriel Mountains, east of the 605 Freeway, north of the 10Freeway and west of Azusa Avenue (Figure 1.2). BPOU is fully developed and has amixture of residential, commercial and industrial facilities. The region has large parcelsof open land with active and inactive gravel pits and the Santa Fe Flood control basin.Figure 1.3 shows Hydrologic Boundaries of the San Gabriel Basin. Figure 1.4 shows a6
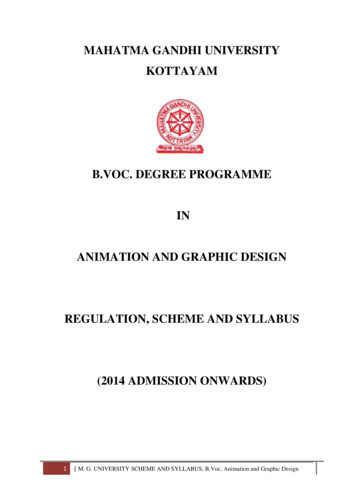
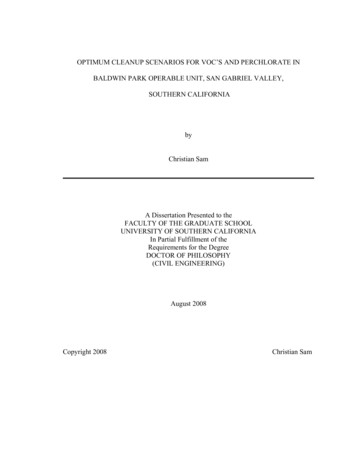
satellite image of BPOU. Figure 1.5 shows the 3D Surface Map and Figure 1.6 showsthe Shaded Relief Map of BPOU.Figure 1.1 Main San Gabriel BasinCourtesy of Main San Gabriel Basin Watermaster7
Figure 1.2 San Gabriel Basin Operable Units(Watermaster, Five Year Water Quality Plan (2005/2006)8
Figure 1.3 San Gabriel Basin Showing Hydrologic BoundariesCourtesy of Main San Gabriel Basin Watermaster9
Figure 1.4 Satellite Image of BPOU (courtesy of www.google.com)10
Figure 1.53D Surface Map of BPOU11
08000410000412000414000416000418000Figure 1.6Shaded Relief Map of BPOU12
1.8 Sources of DataSeveral sources of data were utilized in developing the flow, particle tracking andcontaminant transport models. Hydrogeologic data for BPOU were obtained from thefollowing sources:1.8.1 Geologic Data Aquifer Systems – California Department of Water Resources (1966) Well Lithology - USEPA San Gabriel Valley Database 2008 Ground Elevation - DEM - www.gisdatadepot.com Bottom Elevation- USEPA San Gabriel Valley Database 20081.8.2 Water Data Semi-Annual Water levels (to establish transient general head boundaries)- MainSan Gabriel basin Water master- Annual Reports Initial Water levels- USEPA San Gabriel Valley Database 2008 Water Level Target Heads- USEPA San Gabriel Valley Database 2008 Pumping Wells and Pumping Rates- USEPA San Gabriel Valley Database 2008 Monitoring Wells and Water Quality Data- USEPA San Gabriel Valley Database2008 Aquifer properties – Hydraulic conductivity, specific storage, effective porosityUSEPA San Gabriel Valley Database 200813
1.9 ContaminantsMultiple commingled plumes of groundwater contamination exist in the Baldwin ParkOperable Unit spanning over a mile wide and eight miles long. The groundwater depthvaries from approximately 150 to 350 feet. The groundwater contamination extends fromthe water table to more than 1,000 feet below ground surface. The most prevalentcontaminants in the groundwater are trichloroethene (TCE), tetrachloroethene (PCE),carbon tetrachloride, perchlorate, and N-nitrosodimethylamine (NDMA). TCE, PCE, andcarbon tetrachloride are solvents used for degreasing and cleaning. Perchlorate is used insolid propellant for rockets, missiles, and fireworks; and NDMA is associated withliquid-fuel rockets. Other VOCs including the chemical 1, 4-dioxane, which has beenused as a stabilizer in chlorinated solvents exist. The peak PCE contaminantconcentration detected in groundwater in the Baldwin Park Operable Unit is 38,000 μg/L,exceeding 7500 times the maximum contaminant level (MCL) allowed by Federal andState law.1.10 Developing the Hydraulic Gradient Control SchemeThe development of the optimized hydraulic gradient control scheme proposed in thisstudy consists of a two-step process:Step 1: Generate Hydraulic and Contaminant Flow Field: Initially, groundwater flow issimulated. Then the particle-tracking program is run to simulate contaminant flow paths.RT3D generates contaminant plume contours. This procedure establishes base linecontaminant contours to delineate the existing condition and aids in developing the14
hydraulic control scheme.Preliminary strategic locations of wells that are most effective in cleaning up the plumeare determined in an experimental design approach. Wells that are most effective incleaning up the plume are selected by several simulation and optimization runs todetermine their optimal locations and flow rates. The iterative coupling of simulationwith optimization procedure guarantees a successful hydraulic gradient control scheme(Figure 1.7).Step 2: Optimization - rates for recharge and extraction are optimized using variousconstraints using output from the simulation model. Simulation models depict thechemical and the physical behaviors of the system. The hydraulic gradient controlscheme initiates inward gradient that prevents further intrusion, stabilizes and removesthe contaminant plume. Hydraulic gradients are achieved by varying recharge andpumping rates using groundwater simulation, particle tracking and contaminant transportmodeling. The annual cost of operation and maintenance is minimized while satisfyingthe set of the constraints. Plume cleanup is achieved when the PCE and TCEcontaminant concentration is less than 5 μg/L and the PCR plume is less than 6 μg/L.15
Iterative Simulation withOptimizationStep 1Develop Flow Simulation,Particle Tracking andContaminant Transport ModelsStep 2Optimization- Define ObjectiveFunction, Identify andFormulate ConstraintsStep 3Water Quality Constraint (MCL)Satisfied?Yes - Operating Policies Optimal.Generate Head Contours using MODFLOW;Delineate Particle Paths using MODPATH;Delineate Plume Boundary using MT3DIdentify Optimal Well Location and RatesNo: Adjust Well Locationsand /or Rates; Go back to Step 1Run Optimization Model toYield Well Operating Policies: .Extraction and Injection Rates,Schedules etcFigure 1.7 Flow Chart of Iterative Simulation with Optimization1.11 Coupling Simulation with OptimizationOptimal management of groundwater resources requires the most efficient allocation ofwater supply and demand under given constraints to ensure optimum benefits to users.Simulation with optimization models have been effectively used in groundwaterremediation. Models may minimize annual cost of operation and maintenance, impact tothe environment or maximize net benefits to users.Simulation of groundwater flow is a very important tool used in hydrogeologicinvestigations to study the interactions between surface water and groundwater. As a16
management tool, simulation models predict the long and short term impacts ofGroundwater recharge and extraction and subsurface inflow and outflow. Simulationmodels are highly useful in the study of contaminant transport. Water mangers usesimulation models to analyze and assess their strategies and alternatives. When coupledwith optimization, water mangers can find optimal solutions to their operating policies.Hence, researchers and water managers highly depend on simulation coupled withoptimization to seek optimal alternatives.Optimization methods have been extensively used for decision-making. Optimization isused to maximize resource allocation or minimize adverse effects or costs to the user andenvironment. The real life problem is transformed into a mathematical statement.Physical, institutional, operational and legislative constraints are formulated to satisfymanagement objectives. Optimization yields the optimal solution to the givenmanagement objective subject to the given constraints.This research minimizes the annual maintenance and operation cost of contaminantplume stabilization and cleanup while meeting operational demand. The polluted plumeis isolated from the rest of otherwise hydraulically connected system by producing ahydraulic regime that directs groundwater flow toward the core of the plume. Thecontaminant removal methodology developed in this study is predicated on theexperimental design of a hydraulic control scheme based on variation of pumping andrecharge flow rates.17
1.12 PCE and TCE Superfund SitesThe Baldwin Park Operable Unit has been identified by the USEPA as a volatile organiccompound (VOC) superfund site. Clean up efforts are currently underway. PCE andTCE are halogenated aliphatic volatile organic compounds (VOCs) and have been widelyused as an ingredient in industrial cleaning solutions and as a universal degreasingsolvent due to its unique properties and solvent effects. TCE (tetrachloroethene) andTCA (trichloroethane) are the most frequently detected VOCs in groundwater in theUnited States (Fischer et al., 1987). Approximately 20% of 215 wells sampled in a NewJersey study contained PCE and TCE and other VOCs above the ppb detection limit(Fusillo et. al, 1985). The presence of PCE and TCE has led to the closure of watersupply wells on Long Island, N.Y. and in Massachusetts (Josephson, 1983). Detectablelevels of at least one of 18 VOCs, including TCE, were reported in 15.9% of 63 waterwells sampled in Nebraska, a State having a low population density and industrial base(Goodenkauf and Atkinson, 1986).1.12.1 PCE and TCE Health EffectsThe groundwater in Baldwin Park Operable Unit is contaminated with various VOC’s,predominantly PCE and TCE. Inhaling vapors from the contaminated groundwaterexposes people to hazardous substances. PCE and TCE are not directly carcinogenic.They are thought to become a human health hazard only after processing in the humanliver (Bartseh et al., 1979). However, processing in the human liver is not the only wayin which PCE and TCE may become a health hazard. Reductive dehalogenation of PCE18
and TCE through natural or induced mechanisms may result in production of vinylchloride (VC) which, in contrast to TCE, is a known carcinogen (Federal Register, 1984).1.13 Dissertation OverviewEach chapter contains the pertinent tables and figures. Except otherwise stated, thefigures are not to scale and the north arrow points to the top of the page. Chapter 2discusses current cleanup efforts in the Baldwin Park Operable Unit (BPOU). Themethodology employed in this research is recommended as a strategic solution to basinwide contamination in the Baldwin Park Operable Unit. Historic, current, researchoutput and Watermaster projected contaminant concentrations are plotted.Chapter 3 discusses general literature review of groundwater simulation, contaminanttransport and management studies focused on contaminant plume containment andremoval. Groundwater flow and contaminant transport simulation models and plumecleanup using water resources management and optimization techniques are emphasized.Chapter 4 discusses the geological and hydrological features of BPOU. The geologicsettings, geologic units and model layers are discussed. Groundwater elevations, flowdirection and seepage velocities are highlighted as well as recharge and discharge.Chapter 5 discusses the methodologies adopted in this study. Computer software utilizedin this study and the extent of their application described. Boundary conditions andgoverning equations are established for groundwater flow simulation, particle tracking19
and contaminant transport. An optimal hydraulic gradient control scheme is developedand the procedure outlined. The simulation and optimization models are mathematicallyformulated. The key software packages for the groundwater simulation model arediscussed. The multi-objective optimization model and its subsequent transformationinto a single-objective management model are outlined. The management modelconstraints are also highlighted.Chapter 6 describes the Baldwin Park Operable Unit case study used to test themethodology adopted in this research. Groundwater flow simulation, particle trackingand contaminant transport models are formulated and calibrated to match site conditions.Boundary conditions and assumptions for the case study are outlined. Optimizationprocedures are discussed. The selection procedure for potential decontamination andhydraulic gradient control wells is also highlighted.Chapter 7 presents the results of the groundwater flow simulation, particle tracking,contaminant transport and optimization models for the Baldwin Park Operable Unit casestudy. Model scenarios and applicability are discussed. An economic analysis wasperformed to compare the cost of the existing system with the cost of the strategyproposed in this study.The last chapter summarizes this study and discusses the results. It also presents theconclusions of this study, describes the attainment of research goals and recommendsstrategies for implementation.20
Chapter 2Current Cleanup Efforts2.1 Cleanup StrategyThis chapter elaborates on current cleanup efforts in the Baldwin Park Operable Unit(BPOU). This research highlights the fact that current contamination levels of PCE, TCEand PCR are still high and establishes the need for the current regulatory agenciesoverseeing the cleanup to adopt the methodology developed in this research to effectivelycleanup the contaminants in BPOU. Figure 1.1 shows BPOU in the San Gabriel Basin.This study involves a practical and systematic development of a hydraulic gradientcontrol scheme in which locations and rates of wells are varied subject to givenconstraints to effectively stabilize, capture and cleanup the contaminant plume. Theoptimized hydraulic gradient control methodology developed in this study physicallycontains, shrinks and extracts the contaminant plume below the MCL. The methodologyutilized in this study is based on iterative transient groundwater simulation, particletracking, contaminant transport and optimization. The methodology employed i
Figure 2.3 Baldwin Park Key Well Hydrograph 33 Figure 2.4 PCE Conc. at Monitoring Well W10BDMW2 Baldwin Park 36 Figure 2.5 PCE Conc. at Monitoring Well W11AJMW2 Baldwin Park 37 Figure 2.6 PCE Conc. at Monitoring Well W11AJMW3 Baldwin Park 38 Figure 2.7 PCE Conc. at Monitoring Well W11AJMW4 Baldwin Park 39