Transcription
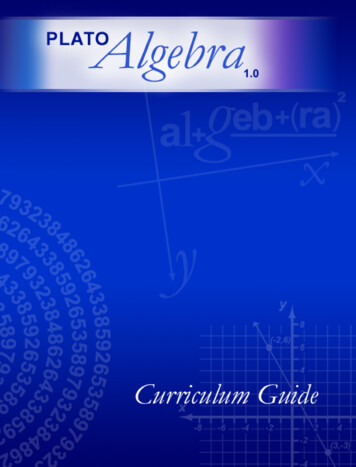
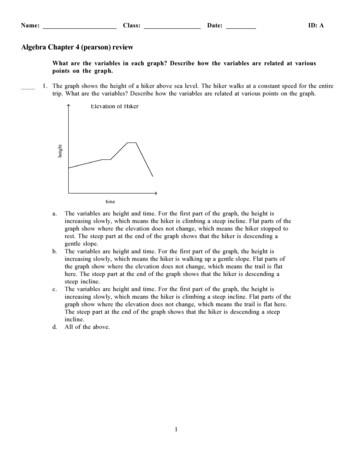
Name:Class:Date:ID: AAlgebra Chapter 4 (pearson) reviewWhat are the variables in each graph? Describe how the variables are related at variouspoints on the graph.1. The graph shows the height of a hiker above sea level. The hiker walks at a constant speed for the entiretrip. What are the variables? Describe how the variables are related at various points on the graph.a.b.c.d.The variables are height and time. For the first part of the graph, the height isincreasing slowly, which means the hiker is climbing a steep incline. Flat parts of thegraph show where the elevation does not change, which means the hiker stopped torest. The steep part at the end of the graph shows that the hiker is descending agentle slope.The variables are height and time. For the first part of the graph, the height isincreasing slowly, which means the hiker is walking up a gentle slope. Flat parts ofthe graph show where the elevation does not change, which means the trail is flathere. The steep part at the end of the graph shows that the hiker is descending asteep incline.The variables are height and time. For the first part of the graph, the height isincreasing slowly, which means the hiker is climbing a steep incline. Flat parts of thegraph show where the elevation does not change, which means the trail is flat here.The steep part at the end of the graph shows that the hiker is descending a steepincline.All of the above.1
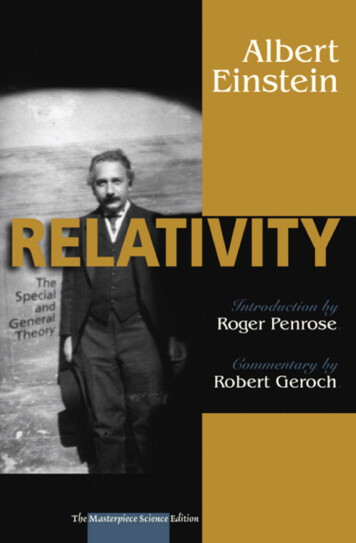
Name:ID: A2. The table shows the amount of money made by a summer blockbuster in each of the first four weeks ofits theater release. Which graph could represent the data shown in the table?Week1234Money ( )26,600,00015,900,0009,600,0005,700,000a.c.b.d.2
Name:ID: A3. A hiker climbs up a steep bank and then rests for a minute. He then walks up a small hill and finallyacross a flat plateau. What sketch of a graph could represent the elevation of the hiker?a.c.b.d.3Any of the graphs could represent thesituation, depending on the hiker’sspeed.
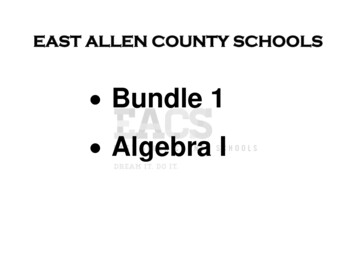
Name:ID: AIn the diagram below, what is the relationship between the number of rectangles and theperimeter of the figure they form?4. Which of the following tables represent the relationship in the diagram above?a.c.b.d.4
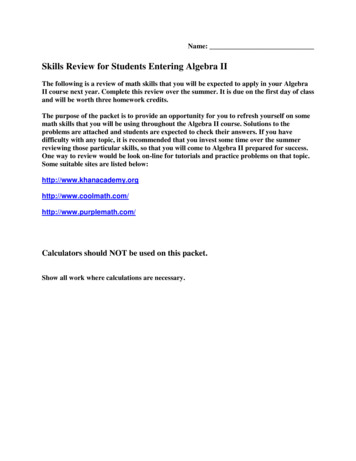
Name:ID: A5. Which of the following graphs represents the relationship described above?a.c.b.d.The table shows the relationship between the number of sports teams a person belongs to andthe amount of free time the person has per week.Number ofSports Teams0123Free Time(hours)362922156. Is the above relationship a linear function?a.yesb.5no
Name:7. What is the graph for the above relationship?a.c.b.ID: Ad.8. The ordered pairs (1, 1), (2, 8), (3, 27), (4, 64), and (5, 125) represent a function. What is a rule thatrepresents this function?a.y 3xc.y 3xb.y x 3d.y x39. The ordered pairs (1, 49), (2, 64), (3, 81), (4, 100), and (5, 121) represent a function. What is a rulethat represents this function?x6a. y 6c. y xb.y 6xd.6y (x 6)2
Name:ID: AWhat is the graph of the function rule?10. y 4x 1a.c.b.d.7
Name:ID: A11. A taxi company charges passengers 1.00 for a ride, and an additional 0.25 for each mile traveled. Thefunction rule C 0.25m 1.00 describes the relationship between the number of miles m and the totalcost of the ride c. If the taxi company will only go a maximum of 40 miles, what is a reasonable graph ofthe function rule?a.c.b.d.Write a function for the situation. Is the graph continuous or discrete?12. A movie store sells DVDs for 20 each. What is the cost, C, of n DVDs?a. C 20n; discretec. C 20 n; continuousb. C 20n; continuousd. C 20 n; discrete13. A produce stand sells roasted peanuts for 2.60 per pound. What is the cost, C, of p pounds of peanuts?a. C 2.60p; continuousc. C 2.60p; discreteb. C 2.60 p; discreted. C 2.60 p; continuous8
Name:ID: AWhat is the graph of each function rule?14. y x 3a.b.c.d.9
Name:ID: A15. y 2x 3a.c.b.d.10
Name:ID: A216. y x 2a.b.c.d.11
Name:ID: A217. y 2x 1a.c.b.d.18. Write a function rule that gives the total cost c(p) of p pounds of sugar if each pound costs .30.a. c(p) 0.30pc. c(p) p 0.30pb. c(p) d. c(p) 30p0.3019. A snail travels at a rate of 2.14 feet per minute. Write a rule to describe the function. How far will the snail travel in 7 minutes?a. d(t) 7t; 14.98 ftc.b.d(t) 2.14t; 14.98 ftd.12d(t) t 2.14; 9.14 fttd(t) ; 3.27 ft2.14
Name:ID: A20. Crystal earns 5.50 per hour mowing lawns. Write a rule to describe how the amount of money m earned is a function of the number of hours hspent mowing lawns. How much does Crystal earn if she works 1 hour and 45 minutes?ha. m(h) ; 0.32c. m(h) h 45; 50.505.50b. m(h) 5.50h; 9.63d. m(h) 5.50h; 7.9821. A zucchini plant in Darnell’s garden was 9 centimeters tall when it was first planted. Since then, it hasgrown approximately 0.7 centimeter per day. Write a rule to describe the function. After how many days will the zucchini plant be 0.181 meter tall?da. h(d) 0.7d; 26 daysc. h(d) 9; 6 days0.7b. h(d) 0.7d 9; 13 daysd. h(d) 9d 0.7; 1.3 days22. Identify the mapping diagram that represents the relation and determine whether the relation is afunction. ÏÔÔÔÔÔÌ ( 8, 6), ( 5, 2), ( 8, 1), (7, 3) Ô ÔÔ ÓÔa.c.The relation is a function.b.The relation is not a functiond.The relation is a function.The relation is not a function.13
Name:ID: A23. The function j(x) 43x represents the number of jumping jacks j(x) you can do in x minutes. How manyjumping jacks can you do in 20 minutes?a. 223 jumping jacksc. 163 jumping jacksb. 860 jumping jacksd. 2 jumping jacks24. The function b(n) 9n represents the number of light bulbs b(n) that are needed for n chandeliers. Howmany light bulbs are needed for 17 chandeliers?a. 153 light bulbsc. 152 light bulbsb. 158 light bulbsd. 1 light bulbsDescribe a pattern in each sequence. What are the next two terms of each sequence?25. 29, 26, 23, 20, . . .a. add 3 to the previous term; 23, 26b. subtract 3 from the previous term; 17, 14c. multiply the previous term by –3; 17, 180d. multiply the previous term by –3; –60, 18026. 3, 6, 12, 24, . . .a. subtract 3 from the previous term; 48, 96b. add 3 to the previous term; 21, 18c. multiply the previous term by –2; –48, 96d. multiply the previous term by 2; 48, 9627. –1, 3, –9, 27, . . .a. multiply the previous term by 3; 81, 243b. add 4 to the previous term; 23, 19c. multiply the previous term by –3; –81, 243d. subtract 4 from the previous term; –81, 243Tell whether the sequence is arithmetic. If it is, what is the common difference?28. 17, 13, 9, 5, . . .a.yes; –429. 3, 7, 12, 18, . . .a. yes; 4b.yes; 30c.yes; 1b.yes; 5c.yes; 314413d.nod.no
Name:ID: AThe table shows the total number of squares in each figure below. What is a pattern you canuse to complete the table?30. Which of the following equations represents the pattern above?2c.y (2x) 42d.y (2x 1) 4a.y (2x 4)b.y (2x 1) 41522
ID: AAlgebra Chapter 4 (pearson) reviewAnswer Section1. ANS: BPTS: 1DIF: L3REF: 4-1 Using Graphs to Relate Two QuantitiesOBJ: 4-1.1 To represent mathematical relationships using graphsNAT: CC F.IF.4TOP: 4-1 Problem 1 Analyzing a GraphKEY: interpreting a graph2. ANS: DPTS: 1DIF: L3REF: 4-1 Using Graphs to Relate Two QuantitiesOBJ: 4-1.1 To represent mathematical relationships using graphsNAT: CC F.IF.4TOP: 4-1 Problem 2 Matching a Table and a GraphKEY: sketching a graph modeling a relationship3. ANS: APTS: 1DIF: L3REF: 4-1 Using Graphs to Relate Two QuantitiesOBJ: 4-1.1 To represent mathematical relationships using graphsNAT: CC F.IF.4TOP: 4-1 Problem 3 Sketching a GraphKEY: sketching a graph modeling a relationship4. ANS: APTS: 1DIF: L3REF: 4-2 Patterns and Linear FunctionsOBJ: 4-2.1 To identify and represent patterns that describe linear functionsNAT: CC A.REI.10 CC F.IF.4 A.1.a A.1.b A.1.e A.1.hTOP: 4-2 Problem 1 Representing a Geometric RelationshipKEY: dependent variable independent variable function linear function modeling a relationship5. ANS: BPTS: 1DIF: L3REF: 4-2 Patterns and Linear FunctionsOBJ: 4-2.1 To identify and represent patterns that describe linear functionsNAT: CC A.REI.10 CC F.IF.4 A.1.a A.1.b A.1.e A.1.hTOP: 4-2 Problem 1 Representing a Geometric RelationshipKEY: dependent variable independent variable function linear function sketching a graph modelinga relationship6. ANS: APTS: 1DIF: L3REF: 4-2 Patterns and Linear FunctionsOBJ: 4-2.1 To identify and represent patterns that describe linear functionsNAT: CC A.REI.10 CC F.IF.4 A.1.a A.1.b A.1.e A.1.hTOP: 4-2 Problem 2 Representing a Linear FunctionKEY: dependent variable independent variable function linear function create equations in twovariables7. ANS: APTS: 1DIF: L3REF: 4-2 Patterns and Linear FunctionsOBJ: 4-2.1 To identify and represent patterns that describe linear functionsNAT: CC A.REI.10 CC F.IF.4 A.1.a A.1.b A.1.e A.1.hTOP: 4-2 Problem 2 Representing a Linear FunctionKEY: dependent variable independent variable function linear function sketching a graph modelinga relationship8. ANS: DPTS: 1DIF: L3REF: 4-3 Patterns and Nonlinear FunctionsOBJ: 4-3.1 To identify and represent patterns that describe nonlinear functionsNAT: CC A.REI.10 CC F.IF.4 A.1.a A.1.eTOP: 4-3 Problem 3 Writing a Rule to Describe a Nonlinear FunctionKEY: nonlinear function1
ID: A9. ANS:REF:OBJ:NAT:TOP:KEY:10. ANS:OBJ:NAT:TOP:11. ANS:OBJ:NAT:TOP:KEY:12. ANS:OBJ:NAT:TOP:KEY:13. ANS:OBJ:NAT:TOP:KEY:14. ANS:OBJ:NAT:TOP:15. ANS:OBJ:NAT:TOP:16. ANS:OBJ:NAT:TOP:17. ANS:OBJ:NAT:TOP:18. ANS:OBJ:NAT:TOP:DPTS: 1DIF: L44-3 Patterns and Nonlinear Functions4-3.1 To identify and represent patterns that describe nonlinear functionsCC A.REI.10 CC F.IF.4 A.1.a A.1.e4-3 Problem 3 Writing a Rule to Describe a Nonlinear Functionnonlinear functionAPTS: 1DIF: L2REF: 4-4 Graphing a Function Rule4-4.1 To graph equations that represent functionsCC N.Q.1 CC A.REI.10 CC F.IF.5 A.1.b4-4 Problem 1 Graphing a Function RuleKEY: continuous graphAPTS: 1DIF: L3REF: 4-4 Graphing a Function Rule4-4.1 To graph equations that represent functionsCC N.Q.1 CC A.REI.10 CC F.IF.5 A.1.b4-4 Problem 2 Graphing a Real-World Function Rulecontinuous graph choosing the correct scaleAPTS: 1DIF: L3REF: 4-4 Graphing a Function Rule4-4.1 To graph equations that represent functionsCC N.Q.1 CC A.REI.10 CC F.IF.5 A.1.b4-4 Problem 3 Identifying Continuous and Discrete Graphscontinuous graph discrete graphAPTS: 1DIF: L3REF: 4-4 Graphing a Function Rule4-4.1 To graph equations that represent functionsCC N.Q.1 CC A.REI.10 CC F.IF.5 A.1.b4-4 Problem 3 Identifying Continuous and Discrete Graphscontinuous graph discrete graphBPTS: 1DIF: L2REF: 4-4 Graphing a Function Rule4-4.1 To graph equations that represent functionsCC N.Q.1 CC A.REI.10 CC F.IF.5 A.1.b4-4 Problem 4 Graphing Nonlinear Function RulesKEY: continuous graphAPTS: 1DIF: L3REF: 4-4 Graphing a Function Rule4-4.1 To graph equations that represent functionsCC N.Q.1 CC A.REI.10 CC F.IF.5 A.1.b4-4 Problem 4 Graphing Nonlinear Function RulesKEY: continuous graphAPTS: 1DIF: L2REF: 4-4 Graphing a Function Rule4-4.1 To graph equations that represent functionsCC N.Q.1 CC A.REI.10 CC F.IF.5 A.1.b4-4 Problem 4 Graphing Nonlinear Function RulesKEY: continuous graphAPTS: 1DIF: L3REF: 4-4 Graphing a Function Rule4-4.1 To graph equations that represent functionsCC N.Q.1 CC A.REI.10 CC F.IF.5 A.1.b4-4 Problem 4 Graphing Nonlinear Function RulesKEY: continuous graphAPTS: 1DIF: L3REF: 4-5 Writing a Function Rule4-5.1 To write equations that represent functionsCC N.Q.2 CC A.SSE.1.a CC A.CED.2 A.1.b4-5 Problem 1 Writing a Function RuleKEY: create equations in two variables2
ID: A19. ANS: BPTS: 1DIF: L2REF: 4-5 Writing a Function RuleOBJ: 4-5.1 To write equations that represent functionsNAT: CC N.Q.2 CC A.SSE.1.a CC A.CED.2 A.1.bTOP: 4-5 Problem 2 Writing and Evaluating a Function Rule KEY: create equations in two variables20. ANS: BPTS: 1DIF: L3REF: 4-5 Writing a Function RuleOBJ: 4-5.1 To write equations that represent functionsNAT: CC N.Q.2 CC A.SSE.1.a CC A.CED.2 A.1.bTOP: 4-5 Problem 2 Writing and Evaluating a Function Rule KEY: create equations in two variables21. ANS: BPTS: 1DIF: L4REF: 4-5 Writing a Function RuleOBJ: 4-5.1 To write equations that represent functionsNAT: CC N.Q.2 CC A.SSE.1.a CC A.CED.2 A.1.bTOP: 4-5 Problem 2 Writing and Evaluating a Function Rule KEY: create equations in two variables22. ANS: DPTS: 1DIF: L3REF: 4-6 Formalizing Relations and FunctionsOBJ: 4-6.1 To determine whether a relation is a functionNAT: CC F.IF.1 CC F.IF.2 N.2.c A.1.b A.1.g A.1.i A.3.fTOP: 4-6 Problem 1 Identifying Functions Using Mapping DiagramsKEY: relation domain range23. ANS: BPTS: 1DIF: L2REF: 4-6 Formalizing Relations and FunctionsOBJ: 4-6.2 To find domain and range and use function notationNAT: CC F.IF.1 CC F.IF.2 N.2.c A.1.b A.1.g A.1.i A.3.fTOP: 4-6 Problem 3 Evaluating a FunctionKEY: function notation24. ANS: APTS: 1DIF: L2REF: 4-6 Formalizing Relations and FunctionsOBJ: 4-6.2 To find domain and range and use function notationNAT: CC F.IF.1 CC F.IF.2 N.2.c A.1.b A.1.g A.1.i A.3.fTOP: 4-6 Problem 3 Evaluating a FunctionKEY: function notation25. ANS: BPTS: 1DIF: L3REF: 4-7 Sequences and FunctionsOBJ: 4-7.1 To identify and extend patterns in sequencesNAT: CC A.SSE.1.a CC A.SSE.1.b CC F.LE.2 CC F.IF.3 CC F.BF.1.a CC F.BF.2 CC F.IF.6 CCF.LE.1.b A.1.bTOP: 4-7 Problem 1 Extending SequencesKEY: sequence term of a sequence arithmetic sequence26. ANS: DPTS: 1DIF: L3REF: 4-7 Sequences and FunctionsOBJ: 4-7.1 To identify and extend patterns in sequencesNAT: CC A.SSE.1.a CC A.SSE.1.b CC F.LE.2 CC F.IF.3 CC F.BF.1.a CC F.BF.2 CC F.IF.6 CCF.LE.1.b A.1.bTOP: 4-7 Problem 1 Extending SequencesKEY: sequence term of a sequence arithmetic sequence27. ANS: CPTS: 1DIF: L3REF: 4-7 Sequences and FunctionsOBJ: 4-7.1 To identify and extend patterns in sequencesNAT: CC A.SSE.1.a CC A.SSE.1.b CC F.LE.2 CC F.IF.3 CC F.BF.1.a CC F.BF.2 CC F.IF.6 CCF.LE.1.b A.1.bTOP: 4-7 Problem 1 Extending SequencesKEY: sequence term of a sequence arithmetic sequence28. ANS: APTS: 1DIF: L2REF: 4-7 Sequences and FunctionsOBJ: 4-7.1 To identify and extend patterns in sequencesNAT: CC A.SSE.1.a CC A.SSE.1.b CC F.LE.2 CC F.IF.3 CC F.BF.1.a CC F.BF.2 CC F.IF.6 CCF.LE.1.b A.1.bTOP: 4-7 Problem 2 Identifying an Arithmetic SequenceKEY: sequence arithmetic sequence common difference3
ID: A29. ANS: DPTS: 1DIF: L3REF: 4-7 Sequences and FunctionsOBJ: 4-7.1 To identify and extend patterns in sequencesNAT: CC A.SSE.1.a CC A.SSE.1.b CC F.LE.2 CC F.IF.3 CC F.BF.1.a CC F.BF.2 CC F.IF.6 CCF.LE.1.b A.1.bTOP: 4-7 Problem 2 Identifying an Arithmetic SequenceKEY: sequence arithmetic sequence common difference30. ANS: DPTS: 1DIF: L3REF: 4-3 Patterns and Nonlinear FunctionsOBJ: 4-3.1 To identify and represent patterns that describe nonlinear functionsNAT: CC A.REI.10 CC F.IF.4 A.1.a A.1.eTOP: 4-3 Problem 2 Representing Patterns and Nonlinear FunctionsKEY: nonlinear function4
Algebra Chapter 4 (pearson) review Answer Section 1. ANS: B PTS: 1 DIF: L3 REF: 4-1 Using Graphs to Relate Two Quantities OBJ: 4-1.1 To represent mathematical relationships using graphs NAT: CC F.IF.4 TOP: 4-1 Problem 1 Analyzing a Graph KEY: interpreting a graph 2. ANS: D PTS: 1 DIF: L3 REF: 4-1 Using Graphs to Relate Two Quantities