Transcription
Munich Personal RePEc ArchiveEssay on Stock Market Performance andDynamic Reactions to Monetary PolicyShocks in NigeriaEkong, Christopher N. and Onye, Kenneth U.University of Uyo, Uyo, University of Uyo, Uyo2016Online at https://mpra.ub.uni-muenchen.de/88319/MPRA Paper No. 88319, posted 10 Aug 2018 07:26 UTC
Essay on Stock Market Performance and Dynamic Reactions to Monetary Policy Shocks in Nigeria11, 2Christopher N Ekong, 2 Kenneth U OnyeDepartment of Economics, Faculty of Social Sciences, University of Uyo, Uyo, Nigeria.AbstractThis paper examines the dynamic response of three popular measures of stock market performance, namely; Stock MarketTurnover, Market Liquidity and All-Shares Index, to innovations in monetary policy shocks. Relying on the structural VectorAutoregressive (SVAR) regression technique, our findings reveal that monetary policy (money supply and interest rate) shocks arenot altogether neutral to the performance of the Nigerian stock market. The quantity-based nominal anchor (M2) proved to be moreeffective than the price-based policy variable (MPR) in enhancing the overall performance of the Nigerian stock market. In thisregard, the central bank should implement contractionary monetary policy when stock prices become persistently bullish. Sincestock prices are found to respond quickly and positively to shock in real GDP, boasting real economic activities becomes afundamental prelude for stabilizing the stock market in Nigeria.Keywords: Stock Market Performance, Dynamic Reactions, Monetary Policy Shocks.1. IntroductionThe stock market plays an important role for monetary policybecause it reflects the expectations of economic agentsregarding the outcome of monetary policy in the macroeconomy. As a result, the stock market reaction to monetarypolicy decisions can reveal information to central banksconcerning the market’s perception of the outcome of centralbank’s policy (see Sousa 2004:1) [37]. In addition, byperforming its financial intermediation functions, the stockmarket plays an important role in the smooth functioning ofthe economy. The central banks operate through the stockmarket by influencing the cost and availability of credit. Itsmonetary policy actions, therefore, potentially constitutes animportant factor affecting the behavior of stock market. Interm of stock market performance, three major indicators arediscernable. These are: (i) market turnover which is measuredas total value of transactions as a percentage of total marketcapitalization of the exchange; ii) All-Shares index – A marketcapitalization weighted index that reflects the price behaviorof all common stocks quoted in the Nigerian Stock Exchange(NSE); and iii) a measure of overall effect of the stockexchange on real economic activities which is computed asmarket capitalization as a percentage of real GDP (see Olewe,2007 for more expositions)In Nigeria, hardly can one find any attempt to investigate theeffect of monetary policy stocks on stock market performance.This, we argue, is perhaps due to the ‘Old Consensus view’i.e., the old consensus view that central banks should focus onprice and output stabilization and ignore development in thestock market even at the cost of temporarily deviating fromtheir out and inflation targets (Bernake 2000, Bernanke 1999;kohn 2006) [5, 26]. In this regard, many past studies generallyconclude that monetary policy account for an insignificant partof stock market behavior (Bernanke and Gertler 1999, Khon2006) [5]. As a result of this, in Nigeria for instance, paststudies have tended to focus more on the effect of monetarypolicy shock on output and inflation (see e.g. Chuku 2009;Chude and Chude 2013; Olowe, 2007; Adamge 2009;Bernanke and Getler, 2001) [12, 11, 33]. Consequently, therefore,there is avalanche of literature on studies focusing instead onthe effect of monetary policy on the real sector activities whilesidelining the effect of monetary policy on the financial sector.Nonetheless, this is in contrast with the importance usuallyattributed to the central banks in an economy, especially interms of its contribution to maintaining financial stability andpromoting economic growth.Regrettably still, as Sousa (2004) [37] notes, most studies inadvanced countries have tended to suffer from problem ofvariable omission bias. Thus, the question is posed whetherthe weak contribution of monetary policy to stock marketperformance, as purported by supporters of the ‘OldConsensus View’ is due to omission of relevant variables/information both for identifying monetary policy shocks andfor explaining the dynamic behavior of the stock market. Thisstudy, therefore, sets out to investigate the dynamic responseof the stock market to monetary policy shocks (unanticipatedchanges) with emphasis of the effect of interest rate andmoney supply on the stock market performance. This isimportant because, as De Grauwe (2008) [14] notes, policiesthat stabilize the financial market has potential to trickle downto output and inflation stabilization. As the same author notes,asset price stabilization is paramount since price bubblesinevitable leads to crashes as the 2008/2009 economic andfinancial crisis clearly demonstrates. Another importantcontribution of this study is that of inclusion of sufficient setof relevant variables that are likely to be part of a typicalreaction function1 of the central bank and that can adequatelyexplain stock market behavior in Nigeria. The findings willnot only supply lessons for policy –making in Nigeria, it willalso provide insight on how the Central Bank of Nigeriashould manage policy.1See Romer and Romer, 2003; for central bank reaction function (Taylor’srule).
Against this background, the demand for deep investigation ofthe relationship between monetary policy and stock marketperformance become topical. The balance of the paper isstructure as follows. Section 2 analyzes the performanceprofile of the Nigerian stock market from 1980 to 2014. Insection three we present the theoretical framework andliterature review. Section four discusses the method of studywhile five analyzes the results. The paper is concluded insection six with some lessons for policy.2. Performance Profile of the Nigerian Stock Market(1980-2014)The Nigerian Stock Exchange (NSE) which was founded in1960 as the Lagos Stock Exchange started operations in 1961with 19 securities listed on the exchange. In 1977 it wasrenamed the Nigerian Stock Exchange (sometimes used interchangeably with the term Nigeria stock market) with branchesin major cities in Nigeria. The exchange was deregulated2 in1993 with prices in the primary market (for new issues) beingdetermined by stock brokers and issuing houses while pricesin the secondary market (for quoted securities) weredetermined solely by brokers.The three most commonly used measures of stock marketactivities are All-Share Price Index, ASI proxing stock price(STOCKP), market capitalization (MC) and value of sharestraded (a measure of market liquidity) – both in relation toeach other and as a percentage of the gross domestic product(GDP). In terms of stock market performance, three majorindicators are also discernable. These are stock marketturnover (measured by Value of transactions as a percentageof market capitalization, VTMC), the All- Shares Index (ameasure of the average value of shares of all quoted firms inthe market) and an indicator of the effect of NSE on theeconomy (measured by market capitalization as a percentageof real gross domestic product – (MCGDP)3.Table 1 presents time series on Performance profile of Nigeriastock market indicators and real GDP real GDPTable 1: Stock Market Indicators and Real Economic Performance (N million)YearsNDVTRGDP 50 -1.72%198210,014215246730 -6.63%198311,925397.9230380 -1.36%198417,444256.5227250 497.9257780 60850.3275410 ,631.902003621,717120,402.60 4950106.58%15,559.902004973,526225,820.00 5275806.51%24,738.702005 1,021,967 262,935.80 5619306.03%22,876.702006 1,367,954 470,253.40 5958206.45%27,647.502007 2,615,020 1,076,020.40 6342505.98%48,773.302008 3,535,631 1,679,143.70 6722006.96%50,424.702009 1,739,365 685,717.30 7189807.98%23,091.502010 1,925,478 799,910.90 7763307.43%24,775.502011 1,235,467 638,925.70 8340006.58%23,393.602012 1,147,174 808,991.40 8888906.89%23,432.602013 3,224,639 2,350,875.70 950110 11.00% 36,207.102014 1,211,269 1,334,783.10 95112039,409.80Source: Central Bank of Nigeria (CBN) statistical Bulletin, 2011, 74.2352 In order to enhance the liquidity of quoted stocks, following the deregulation of the stock market in 1993, and to ensure improved surveillance against shoddydeals, the NSE has been operating an Automated Trading System (ATS) starting from 1999 with brokers trading through a network of computers that areconnected to a server. The market is now regulated by the Security and exchange commission, SEC, as the apex regulator which administers the investment andsecurities Act, of 2007 while trading on the exchange is regulated by the NSE3 See for e.g. Olowe (2007) [33] and Galebotswe and Tlhalefang (2010) [19] who used these indicators in analyzing Nigeria’s and Botswana’s stock exchanges.
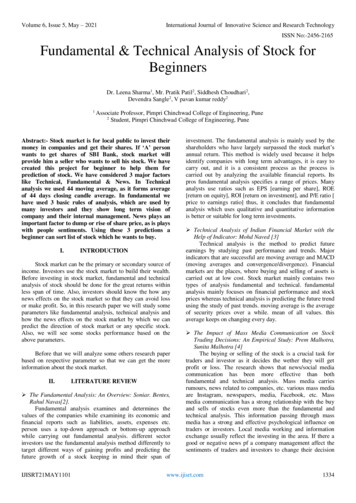
owing to the crisis. However, modest recovery has been madein recent years. In 2013 and 2014, market capitalization roseto 19.0774 trillion and 16.8751 trillion naira respectivelywhich are above its pre-crisis zenith of 13.1817 trillion. Interms of value of transactions, VT (a measure of the value ofstocks that are traded), the value peaked at 1.679 trillion in2008 over the period of 1980 through 2008. In 2009, the valueplummeted to a paltry 685.7173 billion. However, like marketcapitalization, VT has recorded modest recovery in recentyears. By 2013 and 2014, the value of transaction stood at2.35 trillion and 1.334 trillion naira respectively.The cursory look at the trend of real GDP seems to suggestthat it may not have been affected by the crisis. But a moreperceptive analysis shows that the growth rate of real GDPplummeted following the crisis (Table 1). In fact as Ekpo andAfagideh (2009) note, the crisis affected virtually all sector ofthe economy; as foreign direct investment, for instance,divested from the Nigerian Stock exchange and marketcapitalization plunged drastically.Figure 1 plots the annual trends of the level values of the stockmarket variables (Nigeria Stock Exchange All-share Index,ASI; market capitalization, MC; and number of deals, ND)and that of real GDP. In Figure 2, we plot the time-trend ofmajor stock market performance indicators, namely: stockmarket turnover (measured by Value of transactions as apercentage of market capitalization (VTMC) and marketcapitalization as a percentage of real gross domestic product(MCGDP)4.Where: ND number of deals, VT value of transactions (ameasure of market liquidity), MC total market capitalization,MCE market capitalization (equity only), RGDP real GrossDomestic Product (1990 constant prices), VTMC MarketTurnover (value of transaction as a percentage of marketcapitalization), NDRGDP number of deals as a percentage ofreal GDP, and MCRGP market capitalization as a percentageof real GDP. ‘–’ represents ‘not available’.The NSE All-Share which stood at 117.3 million naira in 1985rose to 48, 773.3 million naira in 2007 (the beginning of thefinancial crisis) recorded the highest value of 50424.7 millionnaira in history in year 2008. The represents a compoundedgrowth rate of over 4, 2887% (a 428.87 basis points increaseagainst it 1980 value). However, this phenomenal growthcould not be sustained as the All-Share Index plummeted,starting from 2009. The sharp drop in the value of ASI from50,474.7 million naira in 2008 to 23,091.5 million naira in2009 coincided with the global economic and financial crisis,the so-called Great Recession. In 2012, 2013 and 2014, theAll-Share Index stood at 23,432.6 million, 36,207.1 millionand 39,409.8 million naira respectively – suggesting that themarket may not have fully recovered from the effect of thecrisis. Turning to stock market capitalization – the value of alldomestic stocks that are listed on the Nigerian Stock Exchange– the picture is similar. The NSE Market Capitalization roseconsistently from 5 billion in 1980 to 13.1817 trillion in 2007,implying a compounded growth rate of over 263534% (anincrease of over 263.534 basis points above the 1980 value).By 2008, the market capitalization declined to 9.563 trillion,MC: Market CapitalizationASI: NSE All-Share Index (weighted by Market 990199520002005Years0802010ND: Number of Deals8486889092949698000204RGDP: Real GDP (1990 Constant 020052010200,0000608Begining of Glo. Eco.& Fin. urce: Author’s calculations based on Stock Market Indicators (Table 1).Fig 1: Development of Stock Market Indicators and Real GDPSee for e.g. Olowe (2007) [33] and Galebotswe and Tlhalefang (2012) [19] who used these indicator for analyzing the performance of Nigerria’s and Botswana’sstock exchanges respectively.4
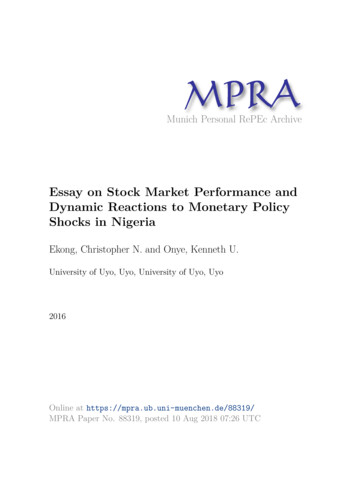
VT MC Value of Transaction as %of MarketCapitalization (STOCK MARKET TURNOVER)MC RGDP: Market Capitalization as %of RGDP (a measureof the effect of stock market on economic 9801980198519901995200020052010Source: Author’s calculations based on Stock Market Indicators (Table 1).Years198519901995200020052010Fig 2: Trend of Stock Market Turnover (VTMC) and MCRGDPorder to forestall bubbles that inevitable lead to crashes?Therefore, more detailed study of the dynamic relationshipbetween monetary policy shocks and the stock market willprovide further evidence on the market’s response to monetarypolicy shocks. This is important for policy choice.In the section that follows we examine in more details theinteraction of major stock market performance indicators(market Turnover, All-Shares index, and capitalization-GDPratio) with policy and non-policy variables as a prelude to oureconometric modeling strategy.Figure 3presents the scatter plots of market turnover versuspolicy and non-policy variables. Whereas the policy variablesinclude monetary policy rate, nominal naira-dollar exchangerate and broad money supply, the non-policy variable includereal GDP, crude oil price and inflation rate.2020As it is clear from Figure 1, All-Share Index, marketcapitalization and number of deals achieved some phenomenalgrowth between the period 1980 and 2007/2008 (start offinancial crisis). Nonetheless, beginning from 2008; stockmarket turnover, market liquidity, market capitalization, valueof transaction and number of deals became worse hit by thecrisis and were highly variegated, especially in post 2008/09crisis era. Intuitively, these dynamic movements (variations)may also have resulted from post-crisis policy responseswhich may potentially impact the underlying marketfundamentals that, in turn, influence the stock marketvariables. As earlier noted, the pertinent question for policy is,therefore, whether and how monetary policy can be used toprevent resurgence of similar crisis or reduce the effect of thecrisis when and where it occurs. In other words, how cancentral bank respond to gyrations in stock market variables inPANEL B: Stock Market Turnover Versus Nominal Naira-Dollar Exchange Rate005510101515PANEL A: Stock Market Turnover Versus Monetary Policy Rate51015MPR95% CIVTMC20Fitted values25050NEXR95% CIVTMC100Fitted values150
2020PANEL D: Market Turnover versus Crude Oil Price005510101515PANEL C: Market Turover (VTMC) Versus Real GDP0200000400000RGDP6000001000000204060OPN8095% CIVTMCFitted values100120Fitted values2095% CIVTMC800000051015PANEL E: Market Turnover Versus Inflation02040INF6095% CIVTMC80Fitted valuesSource: AuthorFig 3: Scatter Plots of Stock Market Turnover versus Policy and Non-Policy Variablesin all the panels lies outside the confidence band. Nonetheless,the analysis is insightful as it provides a cursory knowledge ofthe link between policy variables and stock marketperformance.Turning to another market performance indicator (percentageof capitalization-GDP ratio) a similar pattern emerges asshown in Figure 4.20002000Panel A and B of Figure 3 indicate the scatter plots of marketturnover (measured as percentage of value of transaction toreal GDP ratio) against interest rate and exchange rate. Thedark strand on each panel indicates the 95% confidenceinternal. As is obvious from Figure 3, interest rate isnegatively related to market turnover while exchange rate ispositively related to it, as expected. None of the panelsindicate a significant relationship as bulk of the scatter pointsPANEL H: MCRGDP versus Nominal Naira-Dollar Exchange Rate-500-100000500100010001500PANEL G: MCRGDP versus Monetary Policy Rate51015MPR95% CIMCRGDP20Fitted values25050NEXR95% CIMCRGDP100Fitted values150
250020003000PANEL J: MCRGDP versus Crude Oil Price005001000100015002000PANEL I: MCRGDP versus Real GDP0200000400000600000800000100000020RGDP60Fitted valuesOPN95% CIMCRGDP80100120Fitted values1500200095% CIMCRGDP40-50005001000PANEL K: MCRGP versus Inflation Rate02040INF6095% CIMCRGDP80Fitted valuesSource: AuthorFig 4: Scatter Plots of Percentage of Market Capitalization/RGDP versus Policy and Non-Policy Variablesinvestment) is associated with rising income from oil pricehike.Figure 5 presents the scatter of All-Share Index (proxyingstock prices, STOCKP) against policy and non-policyvariables. Against a similar pattern emerges.4466LSTOCKP8LSTOCKP810101212A perceptive analysis of panel J of Figure 4 and Panel D ofFigure 3 indicates that oil price is more strongly linked tomarket capitalization than market turnover. Intuitively thismay imply that acquisition of existing firm through mergers orestablishment of new production facilities (Green field51015MPR20Stock price versus monetary policy rate (MPR)25101214LM2Stock price versus M21618
RGDPStock price versus real GDP46LSTOCKP81012Stock price versus NEXR2.533.544.55LOPNStock price versus Oil Price (OPN)Source: AuthorFig 5: Scatter Plots of All-Shares Index (STOCKP) versus Policy and Non-Policy VariablesAs is obvious from the Figure 5, there is a near linearrelationship between stock prices and real GDP and anobvious positive relationship between stock prices and one ofthe policy variables, M2. On the contrary, there is noappreciable pattern between stock price and the balance of thepolicy variables (MPR and NEXR).Overall, Figures 3, 4, and 5 suggest that market performanceindicate exhibit similar pattern on their scatter plots withpolicy and non-policy variable. Broad money supply and realGDP show positive and more direct link with stock marketperformance than other macroeconomic magnitudes. In nextsection, we present the theoretical foundations underpinningour study.3. Theoretical framework and literature reviewThe theoretical underpinning of this study is motivated byCuthbertson and Nitzsche (2004) [13], Ioannidis andKontonikas (2008) [24] and Galebotwe and TIhalefang (2012)[19]. In their contributions, the present value or discounted flowmodel offers some theoretical explanation of the link betweenmonetary policy actions and changes in stock prices. It statesthat stock price equals the present value of future net cashflows. This means that expansionary monetary policy(decrease in interest rate and/or increase in money supply) isexpected to increase future net cash flows or decrease thediscount factors at which those cash flows are capitalized orvaluated. This model is derived by assuming that investors arerisk neutral and have two alternative investment outlets (stockor bond) over a one period horizon.As Cuthbertson and Nitzsche (2004) [13] note, stock hasexpected gross return of [Et (St 1 Dt 1)/St] whereas risk-freebond has constant nominal gross return of 1 R. Here, St is thestock price at time t, Dt is the dividend at time t, and Et is theconditional expectation operator based on informationavailable to market participants at time t and R is the rate ofreturn used by market participants to discount futuredividends. As noted by Ioannidis and Kontonikas (2008) [24],this model assumes that: (i) the discount factor used by marketparticipants is generally linked to market rate of interest; and(ii) the central bank is able to influence market rate of interest.Given this assumptions, arbitrage5 opportunities imply that forinvestors to be indifferent between the two alternatives, theymust yield the same expected return, i.e.,[Et (St 1 Dt 1)/St] 1 R1Rearranging equation 1 yields the Euler equation (equation 2)that determines the stock price movement over time:St δ (EtSt 1 EtDt 1)2Where δ 1/(1 R).Solving equation 2 by repeated forward substitution yields35Arbitrage means the simultaneous buying and selling of securities, currencyor commodities in different markets or in derivative forms in order to takeadvantage of deferring prices/interest for the same asset.
Where K is the investor’s time horizon (stock holding period).The transversality condition implies that as the horizon Kincreases, the second term on the right-hand side of equation 3St k 0; as K ). Thisvanishes to zero, (i.e. Lim Etcondition is called the no rational stock price bubblesassumption.Therefore, in the limit, equation 3 reduces to the more familiarrational stock valuation formula for stock prices4From equation 4, it follows that change in monetary policy canaffect stock returns in two ways: (i) there is a direct effect byaltering the discount rate, R, used by market participants.Tighter monetary policy leads to increase in the rate at whichfirms’ future cash flows are valuated/capitalized leading todecline in stock prices (ii) there is an indirect effect on firms’stock value by altering expected future cash flows, Dt. Giventhis theoretical foundation, we now review the theoretical andempirical literature on the subject matter.Given this theoretical foundation, it may be noted that that tryto explain the relationship between stock return(or stock price)and macroeconomic (policy and non-policy) variables have,therefore focused on how this macro variables transcend thereal sector to influence stock return. In this regard, some of thethem include theories on: (i) stock price- money supplyrelationship; (iii) stock price inflation relationship; and (iii)stock price and other macroeconomic variables relationship.One of the earliest link between money supply and stockprices was due to Baks and Kramer (1999) [2] who providesupport to the hypothesis that the link between stock price andmoney growth are positive. In their study of G7 countriesusing broad monetary aggregate, they conclude that anincreasing G7 excess money growth (i.e., a rate of growth ofmoney in excess of real GDP growth) leads to higher realstock returns and lower real interest rate. Another view on thelink between stock returns and money is provided by Backshiand Chen (1996) [3] who build a monetary model in which thereal stock prices is proportional to real GDP and real rate ofreturn on stock is equal to the growth rate of real GDP. Thismodel predicts that the covariance between real stock priceand money growth (growth rate of money supply) is positiveas long as monetary policy is pro-cyclical (i.e., as long asmoney growth and output growth are positively related).However, if the central bank pursues a counter-cyclicalmonetary policy, then money growth will be negatively relatedto real output which will result in a negative relation betweenmoney growth and stock returns.In term of Stock price inflation relationship, the nexus hasbeen anchored on Fisher’s (1930) hypothesis, i.e., his viewthat in the long run (when adjustments has been completed),nominal interest rate increases one-for-one with inflation.Fisher’s specification is stated as follows:i r e5where i represents the nominal interest rate, r the real interestrate and e the expected inflation rate.Since in the long run, the real interest rate equals naturalinterest rate (rn) and inflation equals the money growth (gm),equation 6may be restated thus;i rn gm6Equation 6states that in the long run the nominal interest rateis equal to the natural real interest rate plus the rate of moneygrowth. Equation 5 and 7could be regarded as the short-runand long-run Fisher’s equations respectively. The twoequations implies that a permanent money growth (increase inmoney supply in the long run) will lead to a one-for-oneincrease in inflation and nominal interest rate, leaving the realinterest rate unchanged. This result – that, in the long run(when adjustment has been completed), the nominal interestrate increases one for one with inflation – is called the Fisher’seffect or Fishers hypothesis, after Irving Fisher (Blanchard,1989:322).Thus, expected nominal rates should move one-for-one withexpected inflation. By implication, if stock returns are claimson real assets, then investing in equity should provide a hedgeagainst both expected and unexpected inflation. Thus, onlynominal interest move one-for-one with inflation leaving realinterest unchanged. Since real interest are unaffected bychanges in inflation, real return on stock are also unaffected byinflation. Consequently, nominal returns on stocks should varypositively with inflation while real stock returns should beindependent of inflation.However, against the view that real stock returns shouldprovide a hedge (insurance) against both expected andunexpected inflation, early studies provide large amount ofevidence which suggest that the relation between real stockreturns and inflation was in fact negative and not independent.For instance, Lintner (1975) [28], Bodie (1976) [7], Nelson(1976), Fama and Schwert (1977) and Fama (1981) [18] findnegative relation between real stock returns and both expectedand unexpected inflation. As Sousa (2004) [37] notes, thesefindings were considered a puzzle6 given the previously heldview that stocks should provide a good insurance againstinflation. Expectedly, the empirical findings of a negativerelationship between inflation and real stock returns havegiven rise to several explanations to rationalize the evidence.One such explanation is that stock prices may be distorted bymoney illusion occasioned by inflationary pressure when thepricing of the stock is done with nominal interest rate ratherthan real interest rate (see Modigliani and Cohn, 1979) [29-30].According to this argument, the use of nominal interest raterather than real interest rate to discount future real earningsfrom stock may result in negative relationship between stockprices and inflation rate.Focusing on the relationship between stock returns and othermacroeconomic variables, Chen, Roll and Ross (1986) [8]studied broad stock market variables and their relationship tomacroeconomic variables in the United States. They startedtheir specification with the simple relation between stockreturns and expected discounted dividend:P67This finding may be a consequence of the liquidity puzzle; the finding thanan increase in monetary aggregate – working through the money marketequilibrium – is accompanied by an increase (rather than a decrease) innominal interest rate. Price puzzle – the finding that a contractionary monetarypolicy (decrease in money supply) through positive innovations, i.e.,unanticipated changes, in the interest rate seems to lead to an increase inprices (rather than a decrease in prices the Hicksian AS-AD frameworkundertook to give it). And yet, the exchange rate disconnect puzzle is thefinding that an increase in interest rate is associated with depreciation (ratherthan appreciation) of local currency.
Where P represent the stock returns (proxyingstock prices),E(D) the expected dividend, and k the real discount rate.Equation 7indicates that the rate of return of stocks returndepends positively on changes in expected dividends andnegatively on changes in discount rate. Based on
important factor affecting the behavior of stock market. In term of stock market performance, three major indicators are discernable. These are: (i) market turnover which is measured as total value of transactions as a percentage of total market capitalization of the exchange; ii) All-Shares index - A market