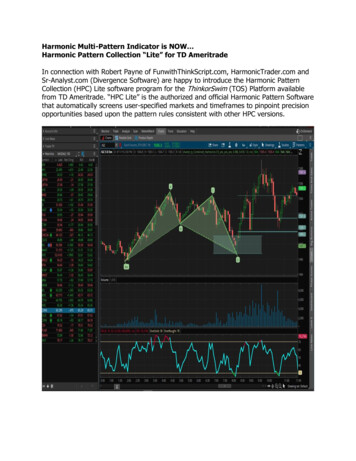
Transcription
Rajski et al. BMC Medical Genomics (2015) 8:16DOI 10.1186/s12920-015-0090-4RESEARCH ARTICLEOpen AccessBMP2 response pattern in human lung fibroblastspredicts outcome in lung adenocarcinomasMichal Rajski1,4†, Annika Saaf2† and Martin Buess1,3*AbstractBackground: Bone morphogenetic proteins play important roles in development, morphogenesis and cancer. Withthis study we aimed to characterize the response of lung stromal fibroblasts to BMPs and their antagonists on agenome wide level and investigate its potential role in human lung adenocarcinomas.Methods: We used an ex vivo culture model and measured gene expression changes in human lung fibroblastsafter stimulation with BMPs and their antagonists using HEEBO microarrays. The in vitro data were correlated within vivo observations in published expression datasets of human lung adenocarcinomas.Results: We have systematically analyzed the response to BMP2, BMP4, BMP7 and their antagonists, Gremlin andNoggin, to define common and specific gene expression patterns. A BMP2 induced gene expression signature wasdefined, which is specific for stromal fibroblasts. Gene expression profiles from lung adenocarcinoma biopsies wereanalyzed to determine the prognostic significance of the “Fibroblast specific BMP2 induced gene list”. This gene listsuccessfully segregated patients with different prognostic outcome in 3 datasets. In a small dataset (Garber et al.)there was a strong trend for a worse prognosis of patients with adenocarcinomas of all stages over-expressing the“Fibroblast specific BMP2 induced gene list”. In two larger datasets with stage I adenocarcinomas we observed asignificantly worse disease-free (p 0.002, Lee et al. and p 0.002, Bhattacharjee et al.) and overall survival (p 0.0002).Conclusions: The effects of BMPs and their antagonists are heterogeneous in different cell types. The gene expressionpattern induced by BMP2 in primary lung fibroblasts may predict outcomes of patients with lung adenocarcinomas.BackgroundThe bone morphogenetic proteins (BMPs) are secretedsignaling molecules that play important roles in numerous aspects of metazoan development, including stemcell regulation, fate determination, body axis specification, cell polarity, proliferation and differentiation [1].Thus, alterations might play a role in cancer.In human lung cancer, BMP2 has been shown to be overexpressed [2]. It activates Smad1/5, thereby increasing Id1expression and promoting invasion in lung cancer cells [3].It has long been established that epithelial-mesenchymalinteractions are essential for development and organogenesis [4] such as the skin, teeth, gut, and lungs. More recently, it has been recognized that cancer is a tissue-based* Correspondence: Martin.Buess@claraspital.ch†Equal contributors1Department of Biomedicine, University of Basel, Hebelstrasse 20, CH-4031Basel, Switzerland3Division of Medical Oncology, Department of Internal Medicine, St.Claraspital, Kleinriehenstrasse 20, CH-4016 Basel, SwitzerlandFull list of author information is available at the end of the articledisease of stromal cells co-evolving with carcinoma cells.Increasing evidence suggests that tumorigenesis isdependent upon contextual signals received from thestroma [5] and epithelial-mesenchymal interactions areplaying an important role in the initiation and progressionof tumorigenesis. As the tumor develops, the surroundingstroma provides tumor cells with growth factors and favorable matrix components that foster proliferation, migration and colonization of distant organs. In fact, thereciprocal interaction of stromal cells and carcinoma cellsdrives carcinogenesis. The most abundant mesenchymalcells in the stroma of most tissues and organs are fibroblasts. These cells secrete extracellular matrix componentsand signaling molecules that contribute to the establishment of customized microenvironments for epithelial cellsand provide a specialized niche for tissue stem cells [6].Dissecting the molecular mechanisms that underlie cellto-cell signaling and crosstalk between epithelial cells, stemcells, fibroblasts and other stromal cells in tissue microenvironments is essential to understand normal development 2015 Rajski et al.; licensee BioMed Central. This is an Open Access article distributed under the terms of the CreativeCommons Attribution License (http://creativecommons.org/licenses/by/4.0), which permits unrestricted use, distribution, andreproduction in any medium, provided the original work is properly credited. The Creative Commons Public DomainDedication waiver ) applies to the data made available in this article,unless otherwise stated.
Rajski et al. BMC Medical Genomics (2015) 8:16and carcinogenesis [7]. Here, we focus on one molecularelement that may play a role in epithelial-mesenchymal interactions in development and cancer – the transcriptionalresponse of fibroblasts to BMP-induced signals. Given themultifaceted roles of BMP signaling in these processes [8],its transcriptional effects on fibroblastic stromal cells are ofgreat interest. However, in lung cancer, the genome-wideeffects of the involved signaling molecules on stromal fibroblasts have not yet been systematically described. Therefore,to build a systematic foundation of knowledge, we focusedon the effects of BMPs and their antagonists, Gremlin andNoggin, on transcription in normal human lung fibroblasts.Importantly, we also demonstrate that the BMP2 gene signature identified in the lung fibroblasts in vitro has significant prognostic relevance in human lung adenocarcinomasand may thus serve as novel prognostic cancer markers andtherapeutic targets in future.Page 2 of 12cells were lysed in a buffer containing guanidine isothiocyanate (RLT buffer, QIAGEN, CA, USA). The totalRNA was extracted with an RNeasy kit (QIAGEN,Valencia, CA, USA) according to the manufacturer’s instructions. The RNA concentration was measured with aNanoDrop system spectrophotometer (ND-1000 Spectrophotometer Technologies, Wilmington, NC, USA).The integrity of extracted RNA was assessed by electrophoresis in a 1% agarose gel in MOPS buffer. For mRNAamplification, an Amino Allyl MessageAmp II aRNAAmplification Kit was used (Ambion, Austin, TX, USA).The amplification of mRNA from 500 ng total RNA,purification of the cDNA, in vitro transcription andpurification of aRNA were performed according to themanufacturer’s instructions. The integrity and quantityof the amplified RNA were verified as described above.Gene expression analysis with HEEBO arraysMethodsCell culturePrimary human fibroblasts (CCL-171) and the humanbreast cancer cell lines MDA-MB-231 and T47D wereobtained from the American Type Culture Collection(ATTC, Atlanta, Georgia, USA) on 2005 November 15.After resuscitation the cells were propagated in Dulbecco’smodified Eagle’s medium (D-MEM, Invitrogen, Carlsbad,USA) supplemented with 10% heat-inactivated FBS(Invitrogen, Carlsbad, CA, USA), 4.5 g/l glucose, 4 mML-glutamine, 100 U/ml penicillin and 100 μg/ml streptomycin (Gibco, Carlsbad, CA, USA). The cells were maintained by regular passages when confluence was reachedand used for the experiments within 3–4 months. Thestudy was approved by the Ethikkommission beider Basel,Switzerland (approval No. 271/05).BMP stimulation experimentsFor the experiment, 30’000 cells/cm2 were seeded in 3ml of 5% FBS D-MEM and incubated for 6 h to allow attachment. The cells were washed extensively withphosphate-buffered saline and starved for 48 h in freshlow-serum D-MEM supplemented with 0.2% FBS. Thecells were starved to reduce the effects of any stimulationfrom the regular cell culture medium. The medium wassubsequently replaced with fresh low-serum D-MEM withor without 200 ng/ml BMP2 (human recombinant inEscherichia coli; Sigma Aldrich, St. Louis, MO, USA), 24ng/ml BMP4, 200 ng/ml BMP7, 240 ng/ml Noggin or 1μg/ml Gremlin. The cells were stimulated for 24 h, andthe RNA was harvested to test the effects of BMP andtheir antagonists on mRNA expression patterns.RNA extraction and amplificationAfter aspirating the culture medium, the cell monolayerwas washed once with phosphate-buffered saline. TheGlobal gene expression was assessed using the HumanExonic Evidence Based Oligonucleotide (HEEBO) microarrays produced at the Stanford Functional GenomicFacility (Stanford, CA, USA). The HEEBO microarraysconsisted of 44,544 70-mer probes, which included thefollowing: (a) constitutive exonic probes (30,718); (b) alternatively spliced/skipped exonic probes (8,441); (c) noncoding RNA probes (196); (d) BCR/TCR Genic/regionalprobes (372); (e) other probes (843); and (f) controls.The complete details regarding the clones on the arrayscan be found at the Stanford functional genomics facilitywebsite (https://microarray.org/sfgf/). For the microarrayexperiments, 8 μg of amplified RNA (aRNA) was mixedwith the doping controls. The samples were vacuum dried,resolved in coupling buffer and labeled with Cy5 dye. Thelabeled samples were pooled with equal amounts of reverse color Cy3-labeled amplified reference RNA fromStratagene (Stratagene, Santa Rosa, CA, USA). The labeledaRNA was purified using an AminoAllyl MessageAmp IIaRNA Amplification Kit (Ambion) according to the manufacturer’s instructions and fragmented using fragmentationreagents (Ambion). The fragmented probe was added to ahybridization buffer containing Cot/PolyA/tRNA (0.05 μg/uLeach), 0.3% SDS and 3.3 SSC supplemented with HEPESbuffer. Following a denaturing step at 100 C, the probewas placed on the microarray for competitive hybridization.After 18 h, the slides with hybridized probe were sequentially washed, immediately dried in an ozone-free environment and scanned using an Axon Scanner 4100A (AxonInstruments, CA, USA). The data analysis and clusteringMicroarray fluorescent image analysis were performedusing the software Genepix Pro version 5.0 3.0.6.89 (AxonInstruments, Union City, CA, USA). Any spots with obvious array artifacts or poor technical quality were manuallyremoved from any further analysis. The raw data files werestored in the Stanford Microarray Database-Princeton
Rajski et al. BMC Medical Genomics (2015) 8:16University and are freely available Publication.pl?pub no 1095) [9] aswell as in NCBI’s Gene Expression Omnibus and areaccessible through GEO Series accession number GSE66142 (http://www.ncbi.nlm.nih.gov/geo/).Data analysisThe data were expressed as the log2 ratio of the fluorescence intensity of the sample and fluorescence intensityof the reference for each element on the array. A sequential data filtering procedure was applied to includeonly measurements fulfilling our quality requirements(i.e. data with a Cy3 channel or Cy5 channel mean intensity over median background intensity greater than 1.5and a Pearson regression correlation of the pixels withinthe spot of greater than 0.6). The genes that did not meetthese criteria for at least 80% of the measurements acrossthe experimental samples were excluded from further analysis. The data were evaluated by unsupervised hierarchical clustering with the Cluster software using Pearsoncorrelation (non-centered metric) and average linkage anddisplayed using TreeView software [10].SAM analysisSAM is a statistical approach to identify genes with expression patterns that are significantly associated withspecific characteristics of the sample sets [11]. TheExcel-SAM-package version 2.1. was obtained from thewebpage of the Tibshirani Lab: http://statweb.stanford.edu/ tibs/SAM/. SAM analysis was applied to the BMP datasetto examine differences between stimulated and unstimulated cells and between cells exposed to different stimuli. Atwo-way, unpaired test or a multiclass test was performedto compare the two groups of interest. A 10-nearest neighbor imputation engine was applied to estimate missing data[12], and 100 permutations were performed to compute theexpected values and calibrate false positives. The averageamount of imputed values was 5.17 / 4.56 percent.Correlation of gene expression changes upon exposure todifferent stimuliTo test for similarities between the expression changesof single genes upon stimulation with BMP2, BMP4,BMP7, Noggin and Gremlin we calculated the Pearsoncorrelation coefficient using the R software (R Development Core Team. A language and environment for statistical computing. Available: http://www.R-project.org)and displayed the results as scatter plots.Page 3 of 12The dataset published by Lee and colleagues [14] contains global gene expression profiles of 138 human lungcancers, of which 63 were adenocarcinomas associatedwith survival data. The dataset published by Bhattacharjee[15] contains mRNA expression levels of 12,600 transcriptsequences from 186 lung tumor samples, including 139adenocarcinomas. Of these, 125 samples were associatedwith clinical data (some patients were in multiple runs).The Bhattacharjee dataset was obtained from the BroadInstitute website, and the Garber dataset was acquiredfrom the SMD webpage [9]. A list of 156 unique clonescomprising 67 genes building the “Fibroblast specificBMP2 induced gene list” was extracted from the threedatasets. To avoid possible overweighting of clones fromUnigene clusters that matched more than one probe onthe array, the expression values derived from probesmatched to the same Unigene cluster were averaged. Onlygenes that had greater than 80% data values and tumorsamples from patients having complete clinical data wereused. The resulting dataset was subjected to average linkage unsupervised clustering, and the results were displayed using TreeView software [10]. All statistical testswere performed using the R statistical software (version2.10.1). Survival curves were obtained using the KaplanMeier estimator and univariate Cox proportional hazardsregression models were fitted (R package “survival”) RDevelopment Core Team. A language and environmentfor statistical computing. Available: http://www.R-project.org.Accessed 2013 December 2. Hazard ratios and coxp-values are given to all the curves.Continuous scoringThe patients in the Lee [14] and the Bhattacharjee datasets [15] were stratified based on a continuous score derived from the “Fibroblast specific BMP2 induced genelist”, as described previously. Briefly, the average expression level of the genes in the “Fibroblast specific BMP2induced gene list” was calculated for each patient attributing a score. The patients were then divided into twogroups, separating them by the median value of the continuous scores. Only patients with stage I cancers wereincluded in the survival analysis. Overall survival wasbased on the number of deaths from any cause, and thepatients were censored at the final follow up. Diseasespecific survival analysis was based on the number ofdeaths caused by the disease, with patients censored at thelast follow-up. In this analysis, patients who died fromother causes were considered alive and censored. The survival statistics were calculated as described above.Human cancer datasetsThe dataset published by Garber and colleagues [13]contains global gene expression profiles for 67 humanlung cancers derived from 56 patients. 41 of them wereadenocarcinomas with survival data for 24 patients.GO::TermFinder analysisGO::TermFinder uses a list of genes as input and determines whether those genes have gene ontology (GO) termsoverrepresented in their combined set of annotations
Rajski et al. BMC Medical Genomics (2015) 8:16BMP2 stimulation of lung stromal fibroblasts inducesregulatory genes of the BMP signaling pathwayThe aim of this study was to uncover the transcriptionalresponses to BMP signaling in lung fibroblastic stroma.To characterize the effects of BMP2 on stromal cells, westimulated pre-starved primary human fibroblasts (CCL171) with BMP2 in a physiological concentration of200ng/ml for 24 h. Biologically independent duplicatesamples were profiled for gene expression changes usinghuman exonic evidence-based oligonucleotide (HEEBO)microarrays. After filtering for data quality as describedin the methods section, filtering for data distribution(SD 0.7) and zero-transformation by the mean of theduplicate mock control average linkage unsupervised hierarchical clustering (Pearson correlation) was performedand the data were presented in a heatmap (Figure 1). Following BMP2 stimulation, we observed a remarkablechange in the gene expression profile. 171 genes exhibiteda greater than 1.5-fold increase (mean: 2.68, standard deviation: 0.86 ) and 206 genes showed a more than 1.5-folddecrease in the expression level (mean decrease: 2.99,standard deviation: 1.604) (Additional file 1: Table S1).A notable feature of the transcriptional response wasthe induction of genes with direct roles in the regulationof BMP signaling either as inhibitors (e.g., BAMBI) orpositive regulators (e.g., BMPR1A). Co-expression ofboth negative and positive regulators of BMP signalingprovides a network of opposing control mechanisms thatare likely to contribute to the robust and precise regulation of BMP target gene expression. Furthermore, we detected an up-regulation of BMP target genes such asSMAD7, ID1, ID2 and ID3. Other genes such as BMP4and CXCL12 were systematically down-regulated. Thedown-regulation of CXCL12 indicates a tie to stem cellregulation [17]. The “CCL-171-derived BMP2” signatureas marked in Figure 1 (Additional file 2: Table S2), alsocontains genes that are known to be involved in developmental processes, including GATA6, DKK1, ID2,BAMBI, SERPINE1, and PTGIS.The identification of transcription factors and otherregulatory genes involved in the transcriptional D7LIN7CCL-171 derived BMP2 signatureResults3MockMockBMP2BMP2compared with what would be expected by chance for arandomly selected group of genes from the backgroundpopulation of all of the genes [16]. In our analysis, tocalculate the frequency of particular annotations weused the gene lists from specific clusters and the fullparental gene lists from the same heatmap as a background file. For a SAM-derived signature, we used aninput file for SAM analysis as the gene list. For p-valuecorrection we used the Bonferroni correction method,as described by Boyle et al. [16].Page 4 of 12CXCL12BMP4Figure 1 Response of lung stromal fibroblasts (CCL-171) to BMP2stimulation. Biologically independent duplicate samples ofnon-stimulated (Mock) and BMP2 stimulated CCL-171 cells for 24hwere profiled for gene expression changes using HEEBO- microarrays.After filtering for data quality as described in the methods section,filtering for data distribution (SD 0.7) and zero-transformation by themean of the non-stimulated samples unsupervised hierarchical clusteringwas performed and the data were displayed in a heatmap. The genesare presented in rows and experiments in columns. Red and greencorrespond to up- and down-regulation, respectively. The intensity ofthe color reflects the magnitude of the change in the expression level asdepicted on a color key. The genes of interest and the CCL-171 derivedBMP2 signature are indicated.(e.g. HEY1, PHTF2, GATA6, and LMCD1) suggests thata more extensive reprogramming of transcription occursdownstream of the primary target genes; the mechanism
Rajski et al. BMC Medical Genomics (2015) 8:16of target gene activation is likely to be far more complexthan direct activation through SMADs, involving a cascade of downstream transcription factors and regulatoryproteins that play a role in further regulation of secondary BMP2 target genes. Among the transcription factorsregulated by BMP signal transduction, it was interestingto find HEY1 and GATA6, which play important roles inpattern formation, morphogenesis and body-axis specification. The increased expression of TPM1, TPM2 andTNC [18] indicates a fundamental reprogramming ofnormal lung fibroblasts such that they exhibited a geneexpression pattern that is typically found in carcinomaassociated fibroblasts.For an unbiased assessment of which features areshared by members of the “CCL-171-derived BMP2” signature and to verify the significance of enrichment of aspecific gene ontology, we used the GO::TermFindertool [16]. The analysis revealed that the “CCL-171-derived BMP2” signature as shown in Figure 1 (Additionalfile 2: Table S2) is significantly enriched for genes involved in biological processes such as the cellular response to chemical stimuli and the BMP signalingpathway with Bonferoni corrected p-values of 0.00017and 0.006, respectively (Additional file 3: Table S3).Furthermore to identify genes with a significant changein expression levels we performed a two class unpairedSAM analysis using a false discovery rate 1%. 76 significantly induced and 151 significantly repressed genes afterBMP2 stimulation are shown in Additional file 4: TableS4. According to our expectations, all the significantly upregulated genes are contained within the list of Additionalfile 1: Table S1. In addition 10 genes not comprised withinAdditional file 1: Table S1 were found to be significantlydown-regulated with SAM analysis, namely: GNG11,ABHD5, PHF17, GAS1, ARSI, JUN, KLHL29, CHEK2,ST6GAL1, PDGFRA, H1F0, BTG1 (fold changes of thesegenes: 2.15-2.58 fold decrease).A global picture of genes that are differentially expressedin response to BMP stimulation or inhibition in lungstromal fibroblastsTo obtain a more general picture of the transcriptional responses to BMP signaling, we examined the gene expression changes in response to physiological concentrationsof BMP2, BMP4, and BMP7, as well as their antagonists,Noggin and Gremlin, in CCL-171 cells. CCL-171 cellswere starved, and the medium was subsequently replacedwith fresh low-serum D-MEM with or without 200 ng/mlBMP2 (human recombinant in Escherichia coli; SigmaAldrich), 24 ng/ml BMP4, 200 ng/ml BMP7, 240 ng/mlNoggin, or 1 μg/ml Gremlin. To search for genes with asignificant change in expression upon exposure to at leastone of the agents, we performed a multiclass SAM analysis on BMP2, BMP4, BMP7, Noggin, Gremlin and mockPage 5 of 12stimulated biologically independent duplicate samples ofCCL-171 with a false discovery rate of 1% [11] After zerotransformation with the mean expression levels of themock stimulated samples we performed unsupervisedhierarchical clustering of the genes identified by SAM anddisplayed the data as a heatmap (Figure 2A). A set of 115genes was identified that were commonly induced byBMP2, BMP4 and BMP7 (Additional file 5: Table S5). Tocorrelate the responses of all genes derived by SAM uponBMP2 stimulation with the responses to BMP4, BMP7,Noggin and Gremlin we calculated the Pearson correlationcoefficient r and displayed their correlation as a scatterplot (Figure 2B). Thus the response to BMP2 observed inCCL-171 cells was highly significantly correlated to thatobserved in response to BMP4 (r 0.892, p 0.001) andBMP7 (r 0.892, p 0.001). An expression pattern opposing the BMP responses were observed in response toNoggin (r 0.940, p 0.001) and Gremlin (r 0.924,p 0.001), as would be expected for antagonists.A comparison of the effect of BMP2 stimulation in lungstromal fibroblasts and breast cancer cellsTo determine whether the response to BMP2 is a general effect or specific for mesenchymal cells such as thelung fibroblasts (CCL-171), we compared the gene expression profile of BMP2-stimulated CCL-171 cells withthe expression profiles of the breast cancer cells MDAMB-231 and T47D treated with BMP2. First, to systematically define a gene signature reflecting the commonresponse to BMP2 shared by CCL-171, MDA-MB-231and T47D cells, we used a two class SAM with blockpermutation to identify genes with a significant changeusing a false discovery rate of less than 0.8%. A commonset of 80 genes that were significantly induced, and 200genes that were significantly repressed in all three celltypes were identified (Additional file 6: Table S6).Second, we intended to determine the cell type specificgene expression changes upon BMP2 stimulation. Thegene expression levels of CCL-171, MDA-MB-231 andT47D upon stimulation with BMP2 were subtracted bythe mean expression levels of duplicate samples of thesame cell types with mock stimulation. Genes with a difference in expression of at least 4 fold were selected andafter unsupervised hierarchical clustering displayed in aheatmap (Figure 3). We observed a cell type dependent induction or repression of specific genes. We observedgenes that were specifically up- or down-regulated inCCL-171 cells, including POSTN, a gene that was recentlydescribed to be essential for the formation of metastaticstem cell niches [19]. The fibroblast-specific up-regulationof topoisomerases and cyclins indicates an induction offibroblast proliferation in response to BMP2 (Figure 3). Aset of 67 genes, which are specifically induced in CCL-171compared to MDA-MB-231 and T47D is referred as the
Page 6 of 12GremlinNogginBMP7BMP4ABMP2Rajski et al. BMC Medical Genomics (2015) 8:16B0.892, ***BMP7BMP40.892, ***30BMP2GremlinNogginCommon BMP induced gene listBMP2-0.940 , ***BMP2-0.924 , ***BMP2-3Figure 2 Effects of BMP 2, 4 and 7 and gremlin and noggin on CCL-171 cells. A) A multiclass SAM analysis was performed to select for genes thatare differentially expressed in response to BMP2, BMP4, BMP7, Noggin or Gremlin using a FDR of less than 1% as the cut-off value. The selectedgenes were organized by unsupervised hierarchical clustering and gene expression changes plotted in a heatmap. The legend bar maps colorversus the magnitude of changes in transcript levels relative to the mock-treatment level. The “common BMP induced gene list” is indicated, andthe genes included in the list are shown in Additional file 5: Table S5. B) Scatter plots demonstrating the correlation of expression changes of allgenes identified by SAM upon stimulation with BMP2 (x-axis) versus BMP4, BMP7, Noggin and Gremlin( y-axis). The Pearson correlation coefficientr is given. ***corresponds to a p-value 0.001.“Fibroblast specific BMP2 induced gene list” (Additionalfile 7: Table S7). To support the up-regulation of this cluster in BMP2 stimulated CCL171 cells compared to nonstimulated CCL-171 cells and compared to MDA-MB-231and T47D we calculated the average expression levels ofthe genes in the cluster (centroid) for each cell line andcondition. A graphic representation of the average expression value is shown as centroid above the heatmap of themagnified area in Figure 3.BMP4 stimulation of lung stromal fibroblasts induces atime-dependent gene expression signatureTo exemplarily show the development of the gene expression changes in response to BMP stimulation overtime we performed a 48 h time course analysis afterBMP4 stimulation in CCL-171 cells. CCL-171 cells werefirst placed under replicative quiescence in DMEMmedia with 0.1% serum for 48 h and then exposed tofully supplemented media, DMEM with 10% serum, andincubated with BMP4 for 1, 3, 6, 12, 24 or 48 h. Thetemporal effect of BMP4 on gene expression wasassessed using DNA microarrays. The BMP4 dependentchanges in the gene expression profiles over time wereassessed by normalization against the time dependentchanges with mock stimulation and normalization againstthe gene expression profile at time 0. Some genes wereup-regulated as early as 3 hours, whereas others wereonly expressed after 24 hours of stimulation with BMP4(Figure 4). The strong and highly significant correlation(r 0.892, p 0.001) of the gene expression changes
Rajski et al. BMC Medical Genomics (2015) 171CCL-171MDA-MB-231MDA-MB-231T47DT47DPage 7 of 12STC1TGFBR3PDGFRATGIF130Fibroblast specific BMP2 induced gene listDKK1TPM1FGFR3HES1CSRP2- - - PP1PTGISCCNA2CDK1TOP2ATK1CTNNAL1-3Figure 3 Effects of BMP2 stimulation on CCL-171, MDA-MB321 and T47D cells. Biologically independent duplicate samples of CCL-171, MDA-MB-231 andT4D7 cells were exposed to BMP2 for 24 h. To determine the cell type specific gene expression changes, the mean of the mock gene expression profilewas subtracted from mean of the gene expression profiles of the duplicates of the respective cell type induced by BMP2 for CCL-171, MDA-MB-231 andT47D. The profiles of induced or repressed genes were merged. Genes with a difference in expression of at least 4 fold were displayed after unsupervisedhierarchical clustering in a heatmap. A set of genes specifically up-regulated in CCL-171, representing the “fibroblast specific BMP2 induced gene list” isindicated. In the zoomed image the genes of the “fibroblast specific BMP2 induced gene list” are shown for all duplicate samples. The array treedetermined by unsupervised hierarchical clustering using average linkage of all the genes of the arrays is shown to demonstrate consistency of theduplicates. The mean expression values of all the genes of the “fibroblast specific BMP2 induced gene list” is shown above the cluster of all genes asexpression level of the centroid.upon BMP4 and BMP2 stimulation over 24h (Figure 2B)suggests a concordant and reliable pattern of gene expression changes in CCL-171 upon 24h of stimulationby BMP4 and BMP2. This suggests the response toBMP2 to be suitable for further analysis.Prognostic significance of the “Fibroblast specific BMP2induced gene list” in human lung adenocarcinomasTo verify the relevance of our in vitro experiments, wechecked the expression of genes in the “Fibroblast specificBMP2 induced gene list” (Additional file 7: Table S7) inpublicly available microarray data from lung cancer biopsies [13]. Garber et al. published global gene expressionprofiles of 41 human lung adenocarcinomas; patient survival data were available for 24 of these adenocarcinomas[13] (GEO: GSE3398). A subset of the genes th
Escherichia coli; Sigma Aldrich, St. Louis, MO, USA), 24 ng/ml BMP4, 200 ng/ml BMP7, 240 ng/ml Noggin or 1 μg/ml Gremlin. The cells were stimulated for 24 h, and the RNA was harvested to test the effects of BMP and their antagonists on mRNA expression patterns. RNA extraction and amplification After aspirating the culture medium, the cell .