Transcription
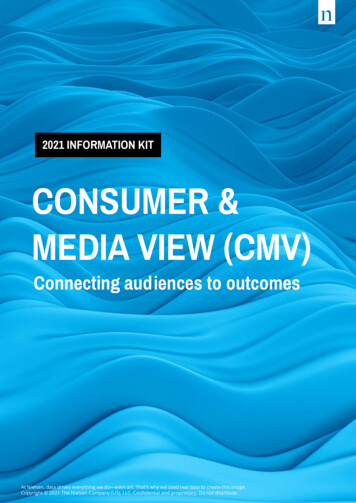
THE NIELSENCOMPARABLEMETRICS REPORTQ2 2017Copyright 2017 The Nielsen Company (US), LLC. Confidential and proprietary. Do not distribute.
WELCOMEWelcome to the Q2 2017 Nielsen Comparable Metrics Report! This is an indepth study of users and usage – averaged across the U.S. population – withthe purpose of aligning methodologies and metrics to display an “applesto apples” view of consumption across Live DVR/Time Shifted TV, AM/FMRadio, TV-connected devices, Computers, Smartphones, and Tablets. The corepurpose of this report is to address three basic concepts equally applicable toall categories of media measurement: how many, how often, and how long.How many is commonly displayed in TV as Reach, in Radio as Cume, andin digital as Unique Audience, but they are all synonyms. This is simply thenumber of adults who use a given platform or content type in an averageweek.How often is expressed as the number of days per week that those adultsaccess said platform.How long is a measure of the time spent engaging with each platform. This isdisplayed both in raw terms as Gross Minutes and also as Average Audience,which is defined as the number of adults engaging with the platform in anaverage minute during the week.Beginning this quarter we have made some slight changes to the namingconventions of the different platforms in order to provide additionalclarification as to what is being measured. TV is now labeled as Live DVR/Time Shifted TV, Radio is AM/FM Radio, and PC is now Internet on a Computer.There have been no changes to the actual metrics other than how theyare referred to here. These changes were also implemented in the Q22017 Nielsen Total Audience Report, and both reports can continue to becross-referenced and used concurrently to gain a better understanding ofmarketplace trends.Also, the Video on a Computer methodology has changed from prior reports.Please see the sourcing and methodology on page 24 for additional details.Video on a Smartphone and Tablet is inclusive of video sites and apps onlyand is not affected.Please note that when comparing Q2 2017 to Q2 2016 data we will still beseeing some effects of recent crediting enhancements to the smartphoneand tablet data. In August 2016 a legacy crediting rule on Android devicesthat capped usage at 30 minutes was removed, so now if a panelist uses anapp or visits a website for more than 30 minutes at a time the entire lengthof the session is now credited. This change was implemented for iOS devicesin March 2016 and as such does not factor into this report’s year-over-yeartrending.All of the findings were derived from the best available data in the reportingperiods of March 27 – June 25, 2017 and March 28 – June 26, 2016.Copyright 2017 The Nielsen Company (US), LLC. Confidential and proprietary. Do not distribute.2
AVERAGE AUDIENCECOMPOSITIONQ2 2017 AVERAGE AUDIENCE COMPOSITION BY 17%6%17%52%17%34%26%ADULTS 18 P18-34P35-49P50 Live DVR/Time-shifted TVAM/FM RadioTV-Connected DevicesInternet ona ComputerApp/Web ona SmartphoneApp/Web ona Tablet(DVD, Game Console,Multimedia Device, VCR) TV accounts for 41% of the total average audience among adults 18 17% of average audience across all age groups is spent listening to RadioCopyright 2017 The Nielsen Company (US), LLC. Confidential and proprietary. Do not distribute.3
HOW MANYQ2 2017 WEEKLY REACH (% OF POPULATION)90%88%94% 93% 92% 95% 92%90%96%83%78%71%56% 56%56%50%47%58%51%43%37% 37%36%26%LIVE DVR/TIME-SHIFTED TVAM/FM RADIOTV-CONNECTEDDEVICESAdults 18 P18-34INTERNET ONA COMPUTERP35-49APP/WEB ONA SMARTPHONEAPP/WEBON A TABLETP50 56% of P18-49 are using TV-Connected devices 95% of P35-49 tune into the Radio each week More adults P35-49 use Smartphones, Tablets and Computers than P18-34Copyright 2017 The Nielsen Company (US), LLC. Confidential and proprietary. Do not distribute.4
HOW OFTENQ2 2017 AVG DAYS PER WEEK WITH USAGE (AMONG USERS)6.15.65.54.65.85.14.85.2 5.14.33.84.23.83.84.15.65.8 5.94.74.54.44.65.03.2LIVE DVR/TIME-SHIFTED TVAM/FM RADIOTV-CONNECTEDDEVICESAdults 18 P18-34INTERNET ONA COMPUTERP35-49APP/WEB ONA SMARTPHONEAPP/WEBON A TABLETP50 Adult TV viewers are watching an average of 5.6 out of 7 days per week TV-Connected Devices are used 4.3 days per week by users 18-34 Smartphones are the devices used most often among adults 18-49Copyright 2017 The Nielsen Company (US), LLC. Confidential and proprietary. Do not distribute.5
HOW LONGQ2 2017 WEEKLY HOURS:MINS OF USAGE (IN 3:2843:1726:5916:00ADULTS 18 P18-34P35-49P50 Live DVR/Time-shifted TVAM/FM RadioTV-Connected DevicesInternet ona ComputerApp/Web ona SmartphoneApp/Web ona Tablet(DVD, Game Console,Multimedia Device, VCR) TV-Connected Devices are most heavily consumed by P18-34 Adults spend nearly 13 hours per week listening to the Radio Adults 35-49 spend the most time per week on Smartphones,Computers and TabletsCopyright 2017 The Nielsen Company (US), LLC. Confidential and proprietary. Do not distribute.6
COMPARABLEMETRICS BY RACEAND ETHNICITYQ2 2017 WEEKLY HOURS:MINS OF USAGE BY ETHNICITY & RACEAdults 18 TotalBlackHispanicAsian AmericanLive DVR/Time-Shifted TV31:0645:2923:3614:38AM/FM Radio12:4813:3513:43naTV-Connected Devices4:274:554:354:25Internet on a Computer6:046:304:043:49Video on a Computer2:193:312:011:57Streaming Audio on a Computer0:060:070:050:05Social Networking on a Computer0:490:410:250:20App/Web on a Smartphone17:1320:2019:4714:18Video on a Smartphone0:501:221:280:49Streaming Audio on a Smartphone0:390:490:550:29Social Networking on a Smartphone4:124:345:022:42App/Web on a Tablet4:014:372:281:46Video on a Tablet0:200:350:190:45Streaming Audio on a Tablet0:100:130:050:03Social Networking on a Tablet0:370:390:240:17 Black audiences watch more TV than any other group Hispanics are the most avid radio listeners Asian Americans have the highest amount of tablet video usageCopyright 2017 The Nielsen Company (US), LLC. Confidential and proprietary. Do not distribute.7
COMPARABLE METRICS - ADULTS 18 AVERAGE WEEK MARCH 28, 2016 - JUNE 26, 2016HOW MANYADULTS 18 UE 243,020,000REACH/CUME/UNIQUESREACH%HOW OFTENUSAGE MINS/DAYDAYS/WEEK (USERS)HOW SERS)AAAVG%AUDIENCELive DVR/TimeShifted TV212,381,800 AM/FM Radio225,207,000 ConnectedDevices104,210,918 net on aComputer121,139,161 49.8%4.3018797,492,634,0874018054.0%9,671,888Video on 1.1%2,620,287Streaming Audioon a 5,543Social Networkingon a 6%1,473,578App/Web ona Smartphone194,302,567 eo on aSmartphone113,530,949 46.7%2.80185,832,312,93724510.2%578,602Streaming Audioon a 0.4%1,018,244Social Networkingon a Smartphone171,268,679 b ona Tablet89,066,317 36.6%5.2311955,364,811,5562286222.3%5,492,541Video on a Tablet52,078,786 21.4%2.69304,229,073,08817810.2%419,551Streaming Audioon a Tablet35,411,237 14.6%3.62303,863,215,773161090.2%383,256Social Networkingon a Tablet74,328,402 ht 2017 The Nielsen Company (US), LLC. Confidential and proprietary. Do not distribute.8
COMPARABLE METRICS - ADULTS 18 AVERAGE WEEK MARCH 27, 2017 - JUNE 25, 2017HOW MANYADULTS 18 UE 245,740,000REACH/CUME/UNIQUESREACH%HOW OFTENUSAGE MINS/DAYDAYS/WEEK (USERS)HOW SERS)AAAVG%AUDIENCELive DVR/TimeShifted TV216,530,344 AM/FM Radio228,518,000 ConnectedDevices115,209,545 net on aComputer122,406,071 49.8%4.2417289,419,515,4773647313.6%8,870,984Video on 81.4%3,397,616Streaming Audioon a 1,145Social Networkingon a 5%1,184,984App/Web ona Smartphone203,863,329 Video on aSmartphone127,682,053 g Audioon a Smartphone114,182,732 46.5%3.32259,466,430,95739830.4%939,130Social Networkingon a Smartphone180,113,326 b ona Tablet90,807,780 37.0%4.7013959,310,349,9452416532.4%5,883,963Video on a Tablet49,262,698 20.0%2.54394,902,978,501201000.2%486,407Streaming Audioon a Tablet40,275,136 16.4%2.90212,439,124,34410610.1%241,977Social Networkingon a Tablet70,537,129 28.7%3.79349,145,041,822371300.4%907,246Copyright 2017 The Nielsen Company (US), LLC. Confidential and proprietary. Do not distribute.9
COMPARABLE METRICS - PERSONS 18-34AVERAGE WEEK MARCH 28, 2016 - JUNE 26, 2016HOW MANYP18-34UE 72,850,000REACH/CUME/UNIQUESREACH%HOW OFTENUSAGE MINS/DAYDAYS/WEEK (USERS)HOW SERS)AAAVG%AUDIENCELive DVR/TimeShifted %8,002,191AM/FM 829,182,508,1584016784.0%2,895,090Internet on 93.7%2,690,769Video on 91.5%1,067,575Streaming Audioon a ,994Social Networkingon a %342,325App/Web ona 878.7%6,335,548Video on .4%291,039Streaming Audioon a .6%470,628Social Networkingon a 52.8%2,035,055App/Web ona Tablet28,826,988 39.6%4.8810715,098,470,5602075242.1%1,497,864Video on a Tablet17,426,237 23.9%2.74361,736,863,231241000.2%172,308Streaming Audioon a Tablet13,174,630 18.1%3.60361,697,261,741231290.2%168,379Social Networkingon a Tablet22,603,362 31.0%4.07363,356,679,991461490.5%333,004Copyright 2017 The Nielsen Company (US), LLC. Confidential and proprietary. Do not distribute.10
COMPARABLE METRICS - PERSONS 18-34AVERAGE WEEK MARCH 27, 2017 - JUNE 25, 2017HOW MANYP18-34UE 73,460,000REACH/CUME/UNIQUESREACH%HOW OFTENUSAGE MINS/DAYDAYS/WEEK (USERS)HOW SERS)AAAVG%AUDIENCELive DVR/TimeShifted ,994,535AM/FM 132,286,409,9924406904.4%3,203,017Internet on 72.8%2,043,920Video on 51.8%1,316,261Streaming Audioon a 7Social Networkingon a %220,660App/Web ona 125311.2%8,256,716Video on 0.8%582,741Streaming Audioon a 6%422,687Social Networkingon a 73.0%2,221,862App/Web ona Tablet27,056,682 36.8%4.4413015,594,717,0492125762.1%1,547,095Video on a Tablet15,619,217 21.3%2.61512,075,272,436281330.3%205,880Streaming Audioon a Tablet12,812,989 17.4%2.9223875,475,12012680.1%86,853Social Networkingon a Tablet20,125,993 27.4%3.62352,524,051,634341250.3%250,402Copyright 2017 The Nielsen Company (US), LLC. Confidential and proprietary. Do not distribute.11
COMPARABLE METRICS - PERSONS 35-49AVERAGE WEEK MARCH 28, 2016 - JUNE 26, 2016HOW MANYP35-49UE 60,700,000REACH/CUME/UNIQUESREACH%HOW OFTENUSAGE MINS/DAYDAYS/WEEK (USERS)HOW SERS)AAAVG%AUDIENCELive DVR/TimeShifted 3%10,477,540AM/FM 315,240,884,7672514612.5%1,511,993Internet on 05.0%3,031,659Video on 1.3%794,233Streaming Audioon a 893Social Networkingon a %449,973App/Web ona 548.8%5,350,609Video on .3%164,649Streaming Audioon a .5%320,302Social Networkingon a 12.8%1,679,025App/Web ona Tablet33,267,638 54.8%5.2211219,415,131,0603205843.2%1,926,104Video on a Tablet19,181,083 31.6%2.73311,614,239,58827840.3%160,143Streaming Audioon a Tablet12,521,555 20.6%3.52261,160,645,43519930.2%115,143Social Networkingon a Tablet28,115,225 46.3%4.32334,067,790,740671450.7%403,551Copyright 2017 The Nielsen Company (US), LLC. Confidential and proprietary. Do not distribute.12
COMPARABLE METRICS - PERSONS 35-49AVERAGE WEEK MARCH 27, 2017 - JUNE 25, 2017HOW MANYP35-49UE 60,730,000REACH/CUME/UNIQUESREACH%HOW OFTENUSAGE MINS/DAYDAYS/WEEK (USERS)HOW SERS)AAAVG%AUDIENCELive DVR/TimeShifted %9,756,761AM/FM 017,644,941,5422914892.9%1,750,490Internet on aComput NCELive DVR/TimeShifted 778,883,3832585182.6%374,889Internet on .6%385,873Video on cial Networkingon a ,393App/Web ona 96.2%911,111Video on 41,968Streaming Audioon a 67,031Social Networkingon a .6%234,529App/Web ona 215,474Video on a 22Streaming Audioon a ng Audioon a ComputerSocial Networkingon a TabletRadio measurement includes Asian Americans but cannot be separated from the total audience at this timeCopyright 2017 The Nielsen Company (US), LLC. Confidential and proprietary. Do not distribute.20
COMPARABLE METRICS - ASIAN AMERICAN 18 AVERAGE WEEK MARCH 27, 2017 - JUNE 25, 2017HOW MANYASIANAMERICAN 18 UE 15,537,000REACH/CUME/UNIQUESREACH%HOW OFTENUSAGE MINS/DAYDAYS/WEEK (USERS)HOW SERS)AAAVG%AUDIENCELive DVR/TimeShifted 111,734,0052654882.6%407,910Internet on .3%353,132Video on ocial Networkingon a ,332App/Web ona 1488.5%1,321,982Video on %74,994Streaming Audioon a 4,312Social Networkingon a .6%250,210App/Web ona 63,773Video on a 389Streaming Audioon a ial Networkingon a 2Streaming Audioon a ComputerRadio measurement includes Asian Americans but cannot be separated from the total audience at this timeCopyright 2017 The Nielsen Company (US), LLC. Confidential and proprietary. Do not distribute.21
DIGITAL AUDIENCE MEASUREMENTIncludesDoes Not IncludeInternet on a ComputerComputer measurement of URLsand Internet ApplicationsNon-browser requested URLs on-InternetApplications such as office apps, most games,and email apps, banking information, private/incognito browsingVideo on a ComputerBoth active (tagged) andpassive (non-tagged) publishermeasurementUntagged content where audio is not presentStreaming Audio on aComputerSites and Internet Applicationsspecifically designed to provideaudio content when they are in theforeground (Ex. Pandora, Spotify,iHeartRadio)Audio content through YouTube, VEVO, andother sites that also provide video capabilities.Duration is not credited if the page is in thebackground or the user is inactive for over 30minutes (Excludes Internet applications likeSpotify or Apple Music)Social Networking on aComputerAll sites in the Member Communities Redd
Copyright 2017 The Nielsen Company (US), LLC. Confidential and proprietary. Do not distribute. 22 DIGITAL AUDIENCE MEASUREMENT Includes Does Not Include