Transcription
POLICY BRIEFJULY 2022 No. UH 011Evaluation of the Community YouthDevelopment Program in TexasBy Rabia Telli, Texas Policy Lab, Rice UniversityTExecutive Summaryhe purpose of this study is to evaluate the impact of one of Texas’s long-standing positiveyouth development programs. The CommunityYouth Development (CYD) program, created in 1995and implemented at the zip code level, aims to preventjuvenile delinquency and improve school performanceand engagement. In this study, we empirically investigate to what extent being eligible for the CYD programinfluences behavioral and academic outcomes using individual-level administrative data sets and employinga difference-in-differences strategy. We find no significant evidence that being eligible for the CYD programpositively impacts behavioral and academic outcomes.BackgroundThe Community Youth Development (CYD) programwas created in 1995 to prevent conditions that lead tojuvenile delinquency. The Texas Department of Family and Protective Services (DFPS) administers andfunds programs that provide prevention-based services such as tutoring, mentoring, recreation, and after-school activities in communities with the highestincidence of juvenile crime. Eleven zip codes were initially selected. The program expanded to 13 zip codesin 1998, then 15 zip codes in 2000. CYD launched seven additional zip codes in 2017 and two more in 2020,for a total of 25 as of 2020.1 (See box on the next pagefor a list of zip codes.) Since 2008, the Prevention andEarly Intervention division of DFPS has administeredthe CYD program to an average of 17,400 youth eachyear.21 The original zip code 76106 was split into two zip codes by theUSPS in 2007 as 76106 and 76164.2 Data are compiled from the Texas DFPS annual reports anddata books.KEY FINDINGSBeing eligible for the CYD program has a smallnonsignificant effect on students’ behavioraloutcomes. It is associated with a small reduction in the absence rate, a 0.25 percentagepoint decrease. In contrast, it is associatedwith a small increase in the suspension rate,a 0.15 percentage point increase.Program eligibility has a negativenonsignificant effect on students’ testperformance, decreasing by about 0.02standard deviations in the mean standardizedmath and reading test scores.Our findings do not imply that the CYD program is ineffective. For further research, itis necessary to collect data that tracks andmonitors program participants and nonparticipants. It is not possible with our employedmethodology and available data to determinewhether the CYD program reaches its targetgroup living in disadvantaged neighborhoodsand changes this group’s behavior and academic outcomes.CYD program services are provided to youth ages6 to 17 who live or attend public school in oneof the designated zip codes, with the target agebeing 10 to 17 years old. The program includesrecreational services such as sports, music, arts,and cultural activities; academic support services
POLICY BRIEFsuch as tutoring, learning techniques, and college/career preparation; and life skills classes such asconflict resolution, anger management, and timemanagement. CYD services are designed to addresscommunity needs and conditions that lead to juvenile crime. Hence, communities select and fundspecific prevention services according to their localneeds. While the distribution of funds and programcontent may vary from site to site, the basic program structure and activities remain similar. Theseservices are provided at no fee without regard tofamily income, and participation is voluntary.Few studies have evaluated the impact of positiveyouth development (PYD) programs designed as randomized controlled trials (RCT). Even though a vastliterature has documented that interventions aimedat early childhood are more effective at promotinghuman capital, hence creating larger improvementsat a later age in long-term life outcomes (Attanasio et al., 2020; Cunha & Heckman, 2007; Cunha etal., 2010; Heckman et al., 2013), recent research onprograms designed to promote positive youth development during adolescence provides promising evidence on their effectiveness (Cook et al., 2014; Helleret al., 2017; Lavecchia et al., 2020; Oreopoulos et al.,2017; Rodríguez-Planas, 2012; Rodríguez-Planas,2017; Schwartz et al., 2021). However, most PYDprograms are not subject to an RCT and have notbeen rigorously evaluated. The impact of these programs on educational and labor market outcomesis still relatively unknown. This research is the onlystudy that causally evaluates the effect of the CYDprogram and contributes to relatively small literature evaluating the impact of PYD programs.CYD PROGRAM ZIP CODESCommunity Youth Development administersmultiple programs in several counties:Harris County: one in Houston (77081) and onein Pasadena (77506)Dallas County: four in the city of Dallas (75216,75217, 75210, and 75241)Hidalgo County: one in McAllen (78501) and onein Pharr (78577).Cameron County: Brownsville City (78520)Bexar County: San Antonio (78207)El Paso County: city of El Paso (79924)Galveston County: city of Galveston (77550)Nueces County: Corpus Christi (78415)Potter County: Amarillo (79107)Travis County: Austin (78744)McLennan County: two in Waco (76707 and 76705)Webb County: Laredo (78046)Lubbock County: three in the city of Lubbock(79415, 79403, and 79404)Tarrant County: two Fort Worth zip codes (76106and 76164)Willacy County: Lyford (78569) andRaymondville (78580)Data are compiled from the Texas DFPS annualreports and data books.Data and MethodologyThe analysis focuses on 1) the effect of being eligible for the CYD program on students’ absence andsuspension rates and 2) the effect of being eligiblefor the CYD program on students’ performance onstandardized tests. This analysis requires understanding what would have happened to the youtheligible for the CYD program if the program wasnot implemented. Since we do not observe eitherprogram participation status or zip code of residency, we follow several steps to conduct thisanalysis: First, we restrict our analysis to the zip2codes where CYD was implemented in 1998, 1999,and 2000.3 This restriction allows us to have stu-3 These zip codes are McLennan County, Waco (76707),where the program was in effect in the school year 1997–1998;Lubbock County, the city of Lubbock (79415), where theprogram was in effect in the school year 1998–1999; and DallasCounty, the city of Dallas (75217), and Harris County, Pasadena (77506), where the program was in effect in the school year2000–2001.University 0f Houston Education Research Center
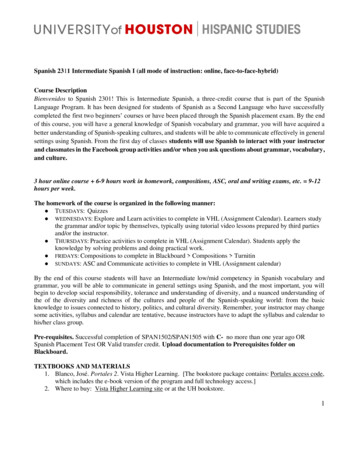
POLICY BRIEFTABLE 1Descriptive Statistics for the Matched School SampleNon-CYD SchoolsMeanStd. Dev.MeanStd. Dev.MeanDifferencep-valueTotal Number of 50.94White120.20180.4491.84104.140.40Hispanic (percent)57.68%24.82%63.55%19.75%0.23Black (percent)27.04%25.15%25.03%20.78%0.68White (percent)14.47%14.40%10.83%9.72%0.19Free Lunch Eligible486.05161.46567.53204.740.02Free Lunch 25.5450.1426.080.95FTE TeacherNumber of Schools92dent-level data for earlier years to employ a difference-in-differences strategy. Second, we obtaindata on school characteristics and the zip codeinformation of schools from the Common Coreof Data (CCD), a database maintained by the National Center for Education Statistics. We use theCCD to select the schools in CYD zip codes (CYDschools) and the comparison school sample in nonCYD zip codes (non-CYD schools). Specifically, wematch public schools in CYD zip codes that had theprogram implemented in 1998, 1999, or 2000 to acomparable control group of schools in non-CYDzip codes using the following matching variablesderived from the CCD: total number of students, racial/ethnic categories (the percentages of Hispanicstudents, students who are Black, and students whoare White), the percentage of students who are free-3CYD Schools32lunch eligible, and the full-time equivalent numberof teachers within the school. We require completeagreement on several variables between CYD andnon-CYD schools, such as the type of the localschool district, school type, school level, highestgrade offered in the school, and the school’s locality(urban vs. rural).4Table 1 reports the descriptive statistics for the4 We match the schools by using the school year 1996–1997 as the base year of matching for the zip code 76707;1997–1998 for the zip code 79415; and 1999–2000 for the zipcodes 75217 and 77506. We match CYD schools to the nearestnon-CYD schools according to the Mahalanobis distance measure as described in Rubin (1980). We choose five matches perCYD school and consider matching with replacement so everynon-CYD school can be selected as a match for more than oneCYD school.University 0f Houston Education Research Center
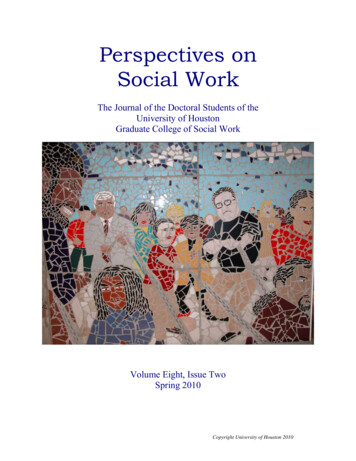
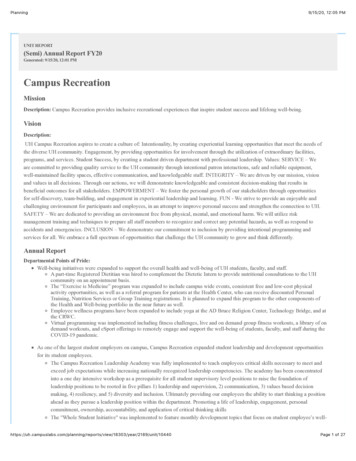
POLICY BRIEFschool sample after discarding non-CYD schoolsthat are not selected as matches and CYD schoolsthat are not matched. On average, the student bodyin CYD schools was 64% Hispanic, 25% Black, and11% White. Our comparison schools closely matchthe percentage of Hispanic, Black, and White students with 58%, 27%, and 14% respectively. Approximately 70% of students were eligible for thefree-lunch program in CYD schools, relative to64% in non-CYD schools. The full-time equivalentnumber of teachers was almost identical betweenCYD and non-CYD schools. We cannot reject thehypothesis that the difference of the means in thevariables between the two groups is not differentfrom zero, except for the number and percentageof free-lunch eligible students based on the p-values. Altogether, the statistics suggest that there areno systematic differences on average.As a next step, we merge the school sample to thestudent-level data housed at the University ofHouston Education Research Center to identifystudents who attend the selected matched schools.The student sample includes students born between 1980 and 1995 whose public-school outcomes are observed from grade three to grade eightbetween the school years 1994–1995 (1998–1999for suspension rates) and 2007–2008. We restrictthe sample to students who have at least one validobservation of an academic or behavioral outcomeduring grades observed in the selected schools.We focus on several behavioral and academic outcomes: absence rate, suspension rate, and mathand reading test scores. Absence rate is defined asthe percentage of school days the student was absent. Suspension rate is defined as the percentageof school days the student was in suspension. Wenormalize all math and reading scores to have amean of zero and a standard deviation of one ineach year for each grade level and test type for theentire state of Texas.55 Texas students took the Texas Assessment of AcademicSkills (TAAS; 1994–2002) and the Texas Assessment of Knowledge and Skills (TAKS; 2003–2008) exams during our analysisperiod. Students attending public schools are required to takethe math and reading tests from third through eighth grades.Students might take the exams multiple times in a school year.We use the highest score among them.4Program-eligible studentsare more likely to be Hispanic(57% non-eligible versus 61%eligible) and less likely to beWhite (15% non-eligible versus8% eligible).Table 2 describes the time-invariant characteristics of four different groups: students attendingnon-CYD schools, students attending CYD schools,non-eligible students (control group), and eligiblestudents (treatment group). Students attendingCYD and non-CYD schools are not quite differentfrom each other at the mean. However, programeligible students are more likely to be Hispanic (57% non-eligible versus 61% eligible) and lesslikely to be White (15% non-eligible versus 8% eligible). Students born before 1985 are not eligiblefor the CYD program because of the program’s eligibility criteria and implementation year.Finally, we use a difference-in-differences methodology to estimate the effect of being eligible forthe CYD program. We compare the difference inthe outcomes of students who attend schools inthe CYD zip codes before and after the program’simplementation to the difference in the outcomesof students from the selected non-CYD schools.The validity of this research design requires thatstudent outcomes would have followed a similarpattern as in the non-CYD schools if CYD had notbeen implemented. We conduct an event studyanalysis to check whether this identification assumption is satisfied. We regress the outcomes ofinterests on variables that indicate the time relative to CYD implementation and their integrationwith the CYD indicator. Figures 1 and 2 plot thecoefficients and 95% confidence intervals fromrobust standard errors clustered by schools fromthese regressions. They show that absence rate,suspension rate, and test scores did not trend dif-University 0f Houston Education Research Center
POLICY BRIEFTABLE 2Descriptive Statistics of Time-Invariant Characteristics of theStudent SampleCYD SchoolsControl GroupTreatment Group(CYD 0)(CYD 1)(CYD#post CYD 0)(CYD#post CYD Gender 1940.0350.1840.0390.1930.0360.186Home 20.463Home 10.480Birth Year 19800.0060.0770.0060.0750.0070.08100Birth Year 19810.0200.1410.0170.1300.0220.14600Birth Year 19820.0340.1810.0290.1680.0370.18800Birth Year 19830.0430.2030.0400.1960.0470.21200Birth Year 19840.0530.2230.0560.2300.0590.23600.008Birth Year 19850.0640.2440.0680.2520.0720.2580.0010.025Birth Year 19860.0790.2690.0800.2710.0870.2820.0070.083Birth Year 19870.0800.2710.0830.2750.0860.2800.0340.181Birth Year 19880.0810.2720.0900.2860.0850.2780.0650.246Birth Year 19890.0810.2720.0890.2850.0810.2730.0920.289Birth Year 19900.0870.2810.0920.2890.0830.2760.1270.333Birth Year 19910.0870.2820.0910.2880.0800.2720.1540.361Birth Year 19920.0820.2750.0710.2570.0730.2600.1430.350Birth Year 19930.0790.2700.0690.2540.0700.2550.1380.345Birth Year 19940.0740.2610.0660.2480.0650.2470.1320.339Birth Year 19950.0530.2240.0540.2250.0470.2110.1080.310Sample Size5Non-CYD Schools263,24067,305296,93133,614University 0f Houston Education Research Center
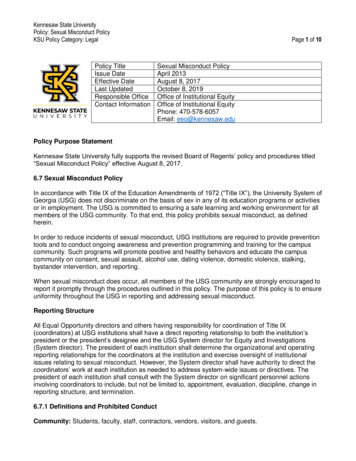
POLICY BRIEFFIGURE 1Event Study: Behavioral Outcomes1.51AbsenceRateAbsence RateSuspensionRateSuspension Rate1.5.501.50-.5-.5-1-1012345Year Relative to Implementation678-5-4Year Relative to Implementation-3-2-101234Year Relative to Implementation5678Year Relative to ImplementationFIGURE 2Event Study: Academic Outcomes.4.2Reading TestReadingTestMathTestMath Test.20.10-.1-.2-.2-5-4-3-2-101234Year Relative to Implementation5678Year Relative to Implementationferently in the CYD and non-CYD schools beforethe program’s implementation.ResultsTable 3 presents results for the effect of CYD program eligibility on behavioral and academic outcomes. It shows the estimated coefficients on theCYD indicator, equal to one for the students observed in the CYD schools after the program implementation, zero otherwise. All specificationscontrol for baseline student characteristics: gender,6-5-4-3-2-101234Year Relative to Implementation5678Year Relative to Implementationrace, language spoken at home, immigrant status,free and reduced-price lunch eligibility, and birthyear. They also include grade, school, and time-fixedeffects. Column 1 indicates that program eligibilityhas a small negative effect on the absence rate—a0.25 percentage point reduction in the absence rate.In contrast, column 2 shows a positive impact on thesuspension rate—a 0.15 percentage point increasein suspension rate. Both effects are not significantlydifferent from zero. We should note that the sample size counts differ for each specification sinceUniversity 0f Houston Education Research Center
POLICY BRIEFTABLE 3Effect of CYD Eligibility on Academic and Behavioral OutcomesDependent VariableAbsenceRate(1)SuspensionRate(2)Math TestScore(3)Reading 0.038)(0.040)CovariatesYesYesYesYesFixed 25266,737Adj. R-squared0.1290.1000.1570.144Community YouthDevelopmentsuspension rates are observed from the 1998–1999school year. Columns 3 and 4 indicate that program eligibility has a negative effect on test performance. There is a nonsignificant decrease by about0.02 standard deviations in the mean standardizedmath and reading test scores. Sample-size countsfor these outcomes reflect that not all students takethe tests. We also check whether CYD eligibility hasa differential effect by race, gender, and free and reduced-price lunch eligibility status. The results arenot reported here and are quite similar. It is stillunclear whether the program eligibility positivelyimpacts different gender, race, and economicallydisadvantaged student subgroups.We also explore whether being eligible for CYDgenerated similar effects when it was expanded in2017 to seven new zip codes by using students bornbetween 2000 and 2007.6 The results for this complementary analysis also suggest that it is unclearwhether the CYD program is effective at the mean.6 For this analysis, we should keep in mind that there areonly two years of after-program data. This fact might precludedrawing precise conclusions.7Overall, we cannot detect a significant effect of program eligibility on youth attending schools in thedesignated CYD zip codes.Policy RecommendationsWe need to stress that our findings do not implythat the CYD program is ineffective. The majormethodological challenge for our analysis is thatwe do not observe either program participationstatus or zip code of residency. Since the CYDprogram is open to students attending school orresiding in one of the designated zip codes, students residing in one of the treated zip codes (CYDzip codes) might be enrolled in one of the controlschools (non-CYD schools in our school sample).This fact implies that our estimates may be underestimating the impact of CYD eligibility. For further research, it is necessary to collect data thattracks and monitors program participants andnonparticipants. It is not possible with our employed methodology and available data to determine whether the CYD program reaches its targetgroup living in disadvantaged neighborhoods andchanges this group’s behavior and academic outcomes.University 0f Houston Education Research Center
POLICY BRIEFReferencesAttanasio, O., Cattan, S., Fitzsimons, E., Meghir, C., & Rubio-Codina, M. (2020). Estimating the production function forhuman capital: Results from a randomized controlled trial in Colombia. American Economic Review, 110(1), 48–85.Cook, P. J., Dodge, K., Farkas, G., Fryer Jr., R. G., Guryan, J., Ludwig, J., Mayer, S., Pollack, H., & Steinberg, L. (2014). The(surprising) efficacy of academic and behavioral intervention with disadvantaged youth from a randomized experiment in Chicago.Institute for Policy Research, Northwestern University.Cunha, F., & Heckman, J. (2007). The technology of skill formation. American Economic Review, 97(2), 31–47.Cunha, F., Heckman, J. J., & Schennach, S. M. (2010). Estimating the technology of cognitive and noncognitive skill formation. Econometrica, 78(3), 883–931.Heckman, J., Pinto, R., & Savelyev, P. (2013). Understanding the mechanisms through which an influential early childhood program boosted adult outcomes. American Economic Review, 103(6), 2052–86.Heller, S. B., Shah, A. K., Guryan, J., Ludwig, J., Mullainathan, S., & Pollack, H. A. (2017). Thinking, fast and slow? Somefield experiments to reduce crime and dropout in Chicago. The Quarterly Journal of Economics, 132(1), 1–54.Lavecchia, A. M., Oreopoulos, P., & Brown, R. S. (2020). Long-run effects from comprehensive student support: Evidencefrom Pathways to Education. American Economic Review: Insights, 2(2), 209–24.Oreopoulos, P., Brown, R. S., & Lavecchia, A. M. (2017). Pathways to education: An integrated approach to helping at-riskhigh school students. Journal of Political Economy, 125(4), 947–84.Rodríguez-Planas, N. (2012). Longer-term impacts of mentoring, educational services, and learning incentives: Evidencefrom a randomized trial in the United States. American Economic Journal: Applied Economics, 4(4), 121–39.Rodríguez-Planas, N. (2017). School, drugs, mentoring, and peers: Evidence from a randomized trial in the US. Journal ofEconomic Behavior & Organization, 139, 166–81.Rubin, D. B. (1980). Bias reduction using Mahalanobis-metric matching. Biometrics, 36, 293–98.Schwartz, A. E., Leos-Urbel, J., McMurry, J., & Wiswall, M. (2021). Making summer matter: The impact of youth employment on academic performance. Quantitative Economics, 12(2), 477–504.Disclaimer: This policy brief is a result of approved research conducted using data through the University of HoustonEducation Research Center (UH ERC). Results, opinions, recommendations or points of view expressed in this policy briefrepresent the work and consensus of the authors and do not necessarily represent the official position or policies of theUniversity of Houston, the UH ERC and/or its funding organizations.8University 0f Houston Education Research Center
Lubbock County, the city of Lubbock (79415), where the program was in effect in the school year 1998-1999; and Dallas County, the city of Dallas (75217), and Harris County, Pasade-na (77506), where the program was in effect in the school year 2000-2001. CYD PROGRAM ZIP CODES Community Youth Development administers