Transcription
Industry Insights ReportQuarterly overview of consumer credit marketTHIRD QUARTER 2019
Industry Insights Report Q3 2019Executive SummaryThe third quarter results of consumer credit market show the continued development oftrends seen in the first half of the year, as lenders and consumers continue to adjust tomoderating macro-economic conditions.Consumer credit growth is concentrated inconsumption lending categories including credit cards and personal loans. Demand forhome loans and loans against property fell, while demand for consumption lendingproducts increased. Overall delinquency rates showed a marginal increase, with largevariances in performance across product types.Balances: Overall balances across all major consumer lending products increased by13.1% year-on-year (YoY), compared to 23.2% YoY growth the prior year in Q3 2018.Although still strong, this is now the sixth consecutive quarter where growth in creditbalances has decelerated. This growth is not uniform across all of the major consumerlending categories. The consumption lending categories of credit cards and personalloans recorded growth rates of 40.7% and 28.0%, respectively, YoY in Q3 2019, whereasauto loans, loans against property (LAP) and home loans recorded comparatively moremoderate rates of balance growth at 10.3%, 11.6% and 10.0%, respectively.Originations: Overall origination volumes grew 32.1% YoY in Q3 2019, but this averagebelies a much more diverse story across categories. Personal loan new accountorigination volumes recorded dramatic YoY growth of 133.9% in Q3 2019. Non-bankingfinancial companies (NBFCs), which have grown their share of personal loan originationsin recent years, continue to focus on acquiring smaller value personal loans. Credit cardorigination volumes grew a healthy 20.9% YoY in Q3 2019, while LAP origination volumesgrew marginally by 1.2% YoY in Q3 2019. Meanwhile, home loans (-12.9%) and autoloans (-1.0%) saw YoY declines in originations.Growth in overall origination balances of installment credit products remained broadly flatin Q3 2019, compared to an increase of 15.1% in Q3 2018. Origination balances ofconsumption lending categories (personal loans and consumer durable loans) grew at24.1% YoY, while those of asset finance products (auto loans, two-wheeler loans, LAP,home loans) declined by 8.4% YoY. The share of consumption products to total balancesoriginated increased to 31.2% in Q3 2019, compared to 25.1% in Q3 2018.Consumer inquiry volumes for personal loans and credit cards increased significantly overthe period, whereas inquiries were broadly unchanged or slightly down for loans againstproperty and home loans.2 2020 TransUnion CIBIL Limited All Rights Reserved
Industry Insights Report Q3 2019Delinquency: Overall balance-level serious delinquencies showed a relatively smallincrease of 10 basis points (bps) YoY in Q3 2019. As with other measures, the increasein delinquency rates was not uniform and was most pronounced for LAP (up 52 bps),home loans (up 13 bps) and credit cards (up 10 bps). Overall delinquencies actuallyimproved for auto loans (down 22 bps) and personal loans (down 5 bps).Overall delinquency rates have increased by 51 bps YoY in Q3 2019 for NBFCs, whichcontinue to show signs of stress. At the same time, delinquency rates for public sector(PSU) and private sector (PVT) banks have declined by 26 bps and 9 bps, respectivelyYoY.Vintage analysis showed encouraging signs for the home loan and LAP categories, withimprovements of 312 bps and 205 bps, respectively, indicating better credit selection.Credit cards and personal loans also showed an improvement of 78 bps and 55 bpsrespectively. However, the same vintage analysis for auto loans did show an increase of151 bps in delinquencies.3 2020 TransUnion CIBIL Limited All Rights Reserved
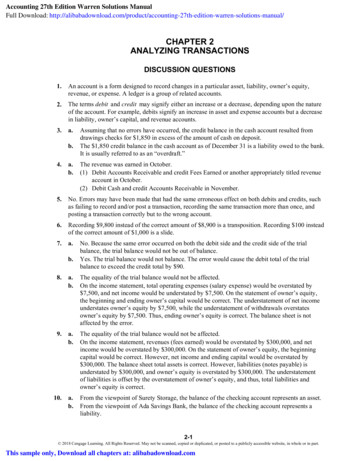
Industry Insights Report Q3 2019Credit Card SummaryConsumers’ willingness and ability to spend propelled another strong quarter oforigination and balance growth for credit cards. Balance level delinquencies saw asmall increase.Q3 2019Y-O-YCHANGEOutstanding Balance (INR Billions)1,09040.7%Number of Accounts (Millions)44.5329.8%Number of Consumers Carrying a Balance (Millions)28.5623.5%248.4%3.9120.9%Balance-Level Delinquency Rate (30 DPD)4.93%21Balance-Level Delinquency Rate (90 DPD)1.95%10Account-Level Delinquency Rate (30 DPD)2.38%-2Account-Level Delinquency Rate (90 DPD)0.85%-2CREDIT CARD METRICSAverage Balance per Account (INR '000)Origination Volumes (Millions)Credit card balances and number of accounts increased YoY by 40.7% and 29.8%respectively taking total balances to INR 1090 billion and number of active cards incirculation to 44.5 million. Balances of PVT card issuers increased by 50.7% YoY whilefor other card issuers increased by 26.9% YoY.Balances in semi-urban and rural areas increased by 52.3% YoY in Q3 2019 indicatingincreased usage of cards as a payment option in these locations.The average balanceper account as on Q3 2019 was INR 24.5 thousand, up from INR 22.6 thousand as onQ3 2018.Credit card origination volumes increased by 20.9% YoY in Q3 2019 compared to 22.3%YoY increase in Q3 2018. There is no significant shift observed in credit card originationsfrom consumers in below prime segment. Proportion of new to credit consumers inoriginations dropped to 18.6% in Q3 2019 compared to 26.2% in Q3 3019.4 2020 TransUnion CIBIL Limited All Rights Reserved
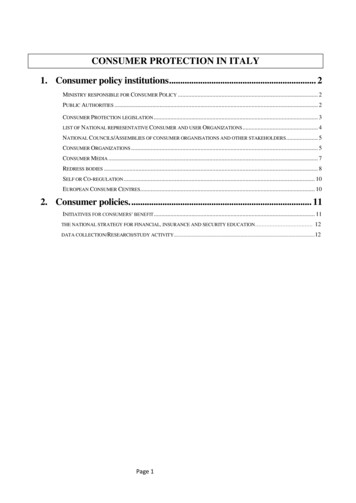
Industry Insights Report Q3 2019Consumers in the age group 25 to 35 years continue to be the focus for card issuers withthis segment constituting 46.4% of total origination volumes in Q3 2019.Both, balance-level 30 and 90 delinquencies have increased YoY by 21 bps and 10bps respectively. These delinquency increases are observed in the portfolio of non PVTcard issuers. However, credit card vintage delinquency shows improvement across cardissuers indicating better customer selection.Personal Loan SummaryPersonal loan continued it’s strong momentum in Q3 2019 with NBFCs focusing onoriginating small value personal loans. Serious delinquencies have improved forPSU and PVT banks.Q3 2019Y-O-YChangeOutstanding Balance (INR Billions)4,29228.0%Number of Accounts (Millions)23.5948.1%Number of Consumers Carrying a Balance (Millions)20.7735.2%Average Balance per Account (INR '000)182-13.6%Origination Balances (INR Billions)86428.2%Origination Volumes (Millions)7.28133.9%Average New Account Balance (INR '000)119-45.2%Balance-Level Delinquency Rate (30 DPD)2.21%10Balance-Level Delinquency Rate (90 DPD)0.58%-5Account-Level Delinquency Rate (30 DPD)3.82%58Account-Level Delinquency Rate (90 DPD)1.49%26PERSONAL LOAN METRICSPersonal loans balances increased YoY by 28.0% in Q3 2019. Balances in semi-urbanand rural locations increased by 31.5% YoY and in metro and urban locations by 25.8%YoY. The continued focus of NBFCs on smaller value personal loans over last one year5 2020 TransUnion CIBIL Limited All Rights Reserved
Industry Insights Report Q3 2019has resulted in NBFC balances and number of loan accounts in micro loan size segment(loans up to INR 25000) growing by more than 5 times in a year.With almost 7.3 million personal loan accounts originated in Q3 2019, the originationvolumes have more than doubled over Q3 2018. This growth in origination volumes isprimarily driven by NBFCs. NBFCs originated 5.3 million personal loans in Q3 2019compared to 1.6 million in Q3 2018. Of these, 78% were from micro segment (loan sizeup to INR 25000).Almost 42.6% of personal loan acquisitions are from consumers in the age group 18-30years. Origination volumes in this age group have increased by 2.9 times in Q3 2019 overQ3 2018.New to credit consumers comprise of 16.5% of total originations in Q3 2019 compared to17.3% in Q3 2018. There has been a marked increase in originations for consumers inthe below-prime risk segment. Almost 34.7% of personal loan originations in Q3 2019were to borrowers considered below-prime – representing increases of 8.3% over Q32018.Balance-level 90 delinquency improved marginally in Q3 2019. This improvement isseen only for PSU and PVT banks. Vintage delinquency also shows a YoY improvementof 55 bps.6 2020 TransUnion CIBIL Limited All Rights Reserved
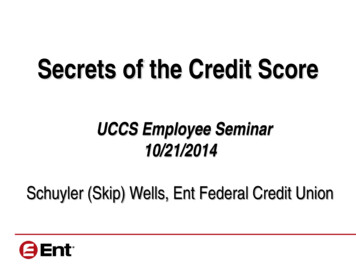
Industry Insights Report Q3 2019Auto Loan SummaryDecline in growth of passenger vehicle sales continued to impact auto loan growth.Origination volumes and balances declined. Originations from consumers in belowprime risk segment increased in Q3 2019. Balance-level delinquencies haveimproved.Q3 2019Y-O-YChangeOutstanding Balance (INR Billions)4,38110.3%Number of Accounts (Millions)12.2111.0%Number of Consumers Carrying a Balance (Millions)15.0711.2%Average Balance per Account (INR '000)359-0.6%Origination Balances (INR Billions)502-3.5%Origination Volumes (Millions)1.02-1.0%Average New Account Balance (INR '000)490-2.5%Balance-Level Delinquency Rate (30 DPD)7.80%-41Balance-Level Delinquency Rate (90 DPD)3.09%-22Account-Level Delinquency Rate (30 DPD)10.01%-128Account-Level Delinquency Rate (90 DPD)4.21%-89AUTO LOAN METRICSAuto Loan balances increased by 10.3% YoY in Q3 2019 compared to 16.8% YoYincrease in Q3 2018. NBFC auto loan balances showed better growth in Q3 2019,increasing by 16.3% YoY.Origination volumes and origination balances declined by -1.0% and -3.5% YoYrespectively in Q3 2019 compared to an increase of 4.5% and 0.8% YoY in Q3 2018. Thedecline in origination balances is seen across lender types.The overall origination average ticket size (ATS) in Q3 2019 remained at same levels asQ3 2018 at INR 490-500 thousand. While ATS has improved by 8.9% and 2.8% for PSUand PVT banks, it came down by -16.9% for NBFCs.7 2020 TransUnion CIBIL Limited All Rights Reserved
Industry Insights Report Q3 2019There has been an increase in originations from consumers in the below-prime risksegment. Almost 30.5% of auto loan originations in Q3 2019 were to borrowersconsidered below-prime – an increase of 3.5% over Q3 2018.Both balance-level 30 and balance-level 90 delinquency improved by 41 bps and 22bps YoY. This improvement in balance-level 30 and 90 delinquency is seen only forPSU and PVT banks. NBFCs balance-level 30 and 90 delinquency rates haveincreased by 36 bps and 16 bps respectively. Vintage delinquency has improved for PSUbanks (-18 bps) but has increased for PVT banks ( 50 bps) and NBFCs ( 218 bps)resulting in an overall increase in vintage delinquency.Home Loan SummaryCredit growth in home loans continues to decelerate as aspiring buyers are puttingoff purchase decisions because they lack confidence. Originations volumes andbalances continued to decline YoY in Q3 2019. Delinquencies also saw a small YoYincrease.Q3 2019Y-O-YChange19,07310.0%Number of Accounts (Millions)14.203.8%Number of Consumers Carrying a Balance (Millions)19.606.1%Average Balance per Account (INR '000)1,3436.0%Origination Balances (INR l Delinquency Rate (30 DPD)5.38%-14Balance-Level Delinquency Rate (90 DPD)1.82%13Account-Level Delinquency Rate (30 DPD)8.20%-62Account-Level Delinquency Rate (90 DPD)3.36%-7HOME LOAN METRICSOutstanding Balance (INR Billions)Origination Volumes (Millions)Average New Account Balance (INR '000)8 2020 TransUnion CIBIL Limited All Rights Reserved
Industry Insights Report Q3 2019Home loans that constitutes almost 50% of the total consumer credit portfolio, saw slowergrowth in balances in Q3 2019. Home loan balances grew at 10.0% YoY as compared to20.3% in Q3 2018. Balance growth has slowed down for housing finance companies(HFC) with their balances increasing YoY by 7.9% in Q3 2019 as against an increase of23.2% in Q3 2018. Affordable housing segment, defined as loan size up to INR 2.5 million,saw lowest YoY growth of 4.1% in Q3 2019.Home loan origination volumes and origination balances declined YoY by 12.9% and7.8% respectively in Q3 2019. Balances originated by PSU and PVT banks increased by8.0% and 2.8% YoY respectively while those of HFCs declined by -20.6% YoY in Q32019. Share of PSU banks in total balances originated increased by 5.6% over Q3 2018.Origination balances in affordable segment declined by 11.6% YoY. PVT banks haveincreased their focus in the affordable housing segment. Balances originated by PVTbanks from affordable segment increased YoY by 14.4% in Q3 2019. Also, of the totalvolumes originated by PVT banks in Q3 2019, 63.5% were from affordable housingsegment as compared to 59.3% in Q3 2018.An increased focus by PVT banks on affordable housing segment has resulted in theirorigination average loan sizes coming down marginally to INR 3.2 million from INR 3.4million in Q3 2018.Balance-level 90 delinquency rates have increased by 13 bps in Q3 2019. Balance-level90 delinquency rates have gone up by 49 bps for HFCs. PSU bank 90 balance leveldelinquency rates have improved by 24 bps and PVT bank’s delinquency rates haveremained at same levels YoY.9 2020 TransUnion CIBIL Limited All Rights Reserved
Industry Insights Report Q3 2019Loans Against Property SummaryCredit growth in loans against property (LAP) has been limited due to lower creditoff-take in self-employed segment who largely avail LAP for their business orcapital expenditure needs. LAP balance-level delinquencies continued to increaseYoY in Q3 2019.Q3 2019Y-O-YChange4,59111.6%Number of Accounts (Millions)2.2718.7%Number of Consumers Carrying a Balance (Millions)3.6820.1%2,026-6.0%Origination Balances (INR Billions)384-18.5%Origination Volumes (Millions)0.191.2%2,070-19.4%Balance-Level Delinquency Rate (30 DPD)8.42%59Balance-Level Delinquency Rate (90 DPD)3.75%52Account-Level Delinquency Rate (30 DPD)8.28%-85Account-Level Delinquency Rate (90 DPD)3.59%-3LOANS AGAINST PROPERTY METRICSOutstanding Balance (INR Billions)Average Balance per Account (INR '000)Average New Account Balance (INR '000)LAP balances grew at 11.6% YoY in Q3 2019 compared to 29.0% in Q3 2018. Balancesof PVT banks grew by at a healthy rate of 28.1% YoY thereby increasing their marketshare by 4.4% over previous year. Balances of PSU banks and NBFCs increased YoYby 11.3% and 3.2% respectively.While origination volumes saw a small increase of 1.2% YoY in Q3 2019, originationbalances declined by -18.5%. Other than PVT banks whose origination balancesincreased by 14.9% YoY, all other lender categories witnessed a decline in originationbalances in Q3 2019.10 2020 TransUnion CIBIL Limited All Rights Reserved
Industry Insights Report Q3 2019ATS for PVT banks has dropped to INR 4.44 million in Q3 2019 from INR 4.76 million inQ3 2018. Similarly, ATS for NBFCs dropped to INR 1.20 million in Q3 2019 from INR 1.93million in Q3 2018.There is no shift in originations from consumers in below prime segment across lendertypes. Of the total originations in Q3 2019, 15.2% were from new to credit consumerscompared to 23.3% in Q3 2018.Balance-level 30 and 90 delinquency rates have increased YoY by 59 and 52 bpsrespectively in Q3 2019. This increase in delinquency rates is seen for NBFCs whose 30 and 90 delinquency rates have increased YoY by 135 bps and 59 bps respectively.Delinquency rates (balance-level 30 and 90 ) have improved on a YoY basis for PSUbanks and remained stable for PVT banks. However, vintage delinquency rates haveimproved across lender types, indicating better credit selection by lenders.11 2020 TransUnion CIBIL Limited All Rights Reserved
Industry Insights Report Q3 2019Report Overview and DefinitionsThe TransUnion CIBIL Industry Insights Report is a quarterly overview summarizing dataand trends and providing insights on the Indian consumer lending industry.All trends originate from TransUnion CIBIL’s consumer credit database of more than 600million files, which profiles nearly every credit-active consumer in India. The reportanalyzes all accounts reported to TransUnion CIBIL that have been verified in the past10 years.The report provides a full view of all data records (not a sample) over the nine most recentquarters.Both account-level and consumer-level views of key metrics and trends are included inthe report.The report covers data and trends for the national population overall, as well asbreakdowns within consumer credit-score risk tiers.The report analyzes individual consumer loan product types—credit card, auto loan,home loan, loans against property and personal loan i.e. unsecured personal installmentloan — while looking at aggregate views of all important retail lending products.For purposes of this report, retail lending includes the following products: auto loans(including used car loans), home loans, loans against property, personal loans, consumerdurable loans, education loans, credit cards and two wheeler loans.Delinquency rates are measured as percentage of accounts / balances in 90 to 179 dayspast due for personal loans, consumer durable loans, education loans, credit cards andtwo wheeler loans and as percentage of accounts / balances in 90 to 900 days past duefor auto loans, home loans and loans against property.Vintage analysis looked at all accounts originated in Q1 2018 and Q1 2019 and compared30 DPD delinquency rates of those new accounts 6 months later. Positive numbersindicate higher delinquencies for the more recent vintage, while negative numbersindicate lower delinquencies for the recent vintage.12 2020 TransUnion CIBIL Limited All Rights Reserved
Industry Insights Report Q3 2019Risk Tier DefinitionsRISK TIERTRANSUNIION CIBIL CREDIT VISION (CV) SCORERANGESuper prime791–900Prime plus771–790Prime731–770Near prime681–730Subprime300–680Note: Below prime refers to the 300 to 730 range, the union of near prime andsubprime.Product DefinitionsPRODUCTCATEGORYDEFINITIONCredit cardRevolving account, open account or line of credit reportedby a bank; loan types include credit card, business creditcard, secured credit card and cards with no preset spendinglimit (flexible spending)Auto loansLoans reported as an auto loan or auto lease. Includes autoloans provided for financing of pre-owned carsHome loansHome loans and installment (non-revolving) loans with aloan type including home equity, home improvement, realestate junior lien or second mortgagePersonal loansInstallment (non-revolving) loans with a loan type includingunsecured, note loan and consolidationLoans AgainstPropertyInstallment (non-revolving) loans with a loan type includingloans against property13 2020 TransUnion CIBIL Limited All Rights Reserved
Industry Insights Report Q3 2019Data DefinitionsDATA CATEGORYDEFINITIONTotal accountvolumesTotal number of accounts that are open and have a reportingwith the bureau in the last six months, at quarter endTotal accountbalancesTotal Rupee amount of accounts that are open and have areporting with the bureau in the last six months, at quarterendAverage accountbalanceTotal account balances, divided by the total accountvolumes, at quarter endUnit delinquency rates Total number of delinquent open accounts at quarter end,divided by the total account volumesRupee delinquencyratesTotal Rupee amount of delinquent open accounts at quarterend, divided by total account balancesTotal new accountvolumesTotal number of new accounts reported opened during thecalendar quarterTotal new accountbalancesSanctioned Rupee amount of new accounts reported openedduring the calendar quarterAverage new accountbalanceTotal new account balances, divided by the number of newaccounts reported opened during the calendar quarterNumber of consumers Total number of consumers with access to at least one openwith access to anrevolving-type account, including authorized account users,active tradeat quarter endNumber of consumers Total number of consumers with at least one open or closedwith a balanceaccount with a balance greater than zero, not includingpresentauthorized users, at quarter endPercentage ofborrowerswith a delinquentbalanceTotal number of consumers with at least one open accountwith a past-due balance greater than zero (90 days pastdue), divided by the number of consumers with at least oneopen account, at quarter end14 2020 TransUnion CIBIL Limited All Rights Reserved
Industry Insights Report Q3 2019DATA CATEGORYDEFINITIONAverage number ofaccounts perconsumerTotal number of open accounts, divided by the total numberof consumers with at least one open account, at quarter endAverage total balanceper consumer, ofconsumerswith a balanceTotal rupee balances of all open accounts, divided by thenumber of consumers with at least one open account with abalance, at quarter end15 2020 TransUnion CIBIL Limited All Rights Reserved
DisclaimerThe TransUnion CIBIL Industry Insights Report is prepared by TransUnion CIBIL Limited (TU CIBIL). By accessing and using the Report the useracknowledges and accepts such use is subject to this disclaimer. This Presentation is based on collation of information, substantially, provided by creditinstitutions who are members with TU CIBIL. While TU CIBIL takes reasonable care in preparing the Presentation , TU CIBIL shall not be responsiblefor errors and/or omissions caused by inaccurate or inadequate information submitted to it by credit institutions. Further, TU CIBIL does not guaranteethe adequacy or completeness of the information in the Presentation and/or its suitability for any specific purpose nor is TU CIBIL responsible for anyaccess or reliance on the Presentation and that TU CIBIL expressly disclaims all such liability. This Presentation is not a recommendation for rejection /denial or acceptance of any application nor any recommendation by TU CIBIL to (i) lend or not to lend; (ii) enter into or not to enter into any financialtransaction with the concerned individual/entity. The Information contained in the Presentation does not constitute advice and the user should carry outall the necessary analysis that is prudent in its opinion before making any decisions based on the Information contained in this Presentation. The use ofthe Presentation is governed by the provisions of the Credit Information Companies (Regulation) Act, 2005, the Credit Information CompaniesRegulations, 2006, Credit Information Companies Rules, 2006. No part of the report should be copied, circulated, published without prior approvals. 2020 TransUnion CIBIL LimitedAll Rights Reserved
consumption lending categories (personal loans and consumer durable loans) grew at 24.1% YoY, while those of asset finance products (auto loans, two-wheeler loans, LAP, home loans) declined by 8.4% YoY. The share of consumption products to total balances originated increased to 31.2% in Q3 2019, compared to 25.1% in Q3 2018.