Transcription
New York State and LocalEmployees' Retirement SystemPolice and Fire Retirement SystemPublic Employees’ Group Life Insurance PlanThomas P. DiNapoli, ComptrollerANNUAL REPORTTO THE COMPTROLLERONACTUARIAL ASSUMPTIONSMichael R. DutcherRetirement Systems ActuaryAugust 2019
Table of ContentsPartPageI.Executive SummaryII.Economic Assumptions3A) Inflation (CPI-U) and theCost of Living Adjustment (COLA)5B) Investment Rate of Return5C) Salary Scales6III.Asset Valuation Method7IV.Demographic AssumptionsA) Pensioner Mortality8B) Mortality Improvement8C) Active Member Decrements9V.Effect on Contributions10VI.Gain/Loss Analysis11VII.Summary of Recommendations11VIII.Historical Employer Contribution Average Rate12IX.Risk Disclosures132
I. Executive SummaryFiscal year 2019 (FY 2019) was the fourth in the current five year experience study cycle. The August2015 report based on experience studies for the period April 1, 2010 through March 31, 2015recommended changes in virtually all of the assumptions. This year’s report displays the FY 2019experience and recommends that the current assumptions be maintained with the exceptions of updatingmortality improvement scale MP-2014 to MP-2018 and reducing the assumed investment return from7.0% to 6.8%.Summary of Assumptions and MethodsAssumption or MethodRecommendation2.5 % / 1.3%Inflation / COLAInvestment Return6.8 %4.2 % average (using FY 2015 data) Indexed by ServiceERS Salary Scale5.0 % average (using FY 2015 data) Indexed by ServicePFRS Salary Scale5 year level smoothing of gains or losses above or belowAsset Valuation Methodthe assumed return applied to all assets and cash flowsGender/Collar specific tables based upon FY 2011-2015Pensioner Mortalityexperience with Society of Actuaries’ Scale MP-2018loading for mortality improvement.Basedupon FY 2011-2015 experienceActive Member DecrementsThis recommendation has been shared with the Systems’ Actuarial Advisory Committee (AAC) for theirreview and comment. This Committee is composed of current or retired senior actuaries from majorinsurance companies or pension plans.In addition to oversight provided by the AAC, the work of the Systems’ actuaries is periodically reviewedby a number of organizations, including the Systems’ financial statement auditors, internal auditors of theOffice of the State Comptroller, examiners from the New York State Department of Financial Services(DFS), and a quinquennial review by an independent actuarial firm. The most recent review by anindependent actuarial firm was completed in July 2018 by Grant Thornton, LLP.The reviewed and finalized actuarial assumptions will be presented to Comptroller Thomas P. DiNapolifor certification for the purpose of developing employer contribution rates, payable on 2/1/2021, for themany different plans covered by the Employees’ Retirement System (ERS) and the Police and FireRetirement System (PFRS).3
It is customary to avoid assumption changes between quinquennial experience studies (conducted in yearsdivisible by five), where the five most recent years of system experience are combined and used as a basisfor new assumptions. Annual tinkering with assumptions belies the long-term nature of pension funding.However, it has been five years since the adoption of Society of Actuaries’ Scale MP-2014 for mortalityimprovement. I recommend adopting scale MP-2018, the most recently available. This results in valuationgains, which I recommend be absorbed by a reduction in the assumed rate of return from 7.0% to 6.8%.4
II. Economic AssumptionsA. Inflation (CPI-U) and the Cost of Living Adjustment (COLA)The table below displays the applicable CPI-U CPI-UIncrease 2%238.1320.85%1.0%236.119As a result, the COLA minimum of 1.0% will be applied in September of 2019, which is 0.3% less thanthe current assumption. (Note that COLA applies to the first 18,000 of the pensioner’s single-lifepension. Spousal beneficiaries are entitled to one-half of the pensioner’s COLA.)B. Investment Rate of Return (Discount Rate)The FY 2019 investment rate of return, as reported by the Division of Pension Investment and CashManagement, is 5.23%. The 3, 5, 10, and 20 year returns are 9.32%, 7.00%, 10.34%, and 6.64%respectively.The data below is taken from the National Association of State Retirement Administrators (NASRA)website and represents the investment return assumption distribution for public systems in their database.Number of Public SystemsiFebruary 2019May 2015March 2010 5
The gains from the change in mortality improvement scale MP-2014 to MP-2018, along with the newentrant gains, provides an opportunity to join the growing group of public systems with an assumed returnassumption below 7%. The most recently (2015) provided and relied on asset/liability study using PensionInvestment and Cash Management (PICM) approved capital market assumptions and the InvestmentAdvisory Committee endorsed asset allocation portfolio resulted in an expected arithmetic return of7.34% and an expected geometric return of 6.58%. The 0.20% reduction moves the assumption from themiddle into the lower half of the geometric/arithmetic range and closer to the 20 year return of 6.64%.PICM plans to provide a new asset/liability study in time for the setting of the 4-1-2020 valuationassumptions.C. Salary ScalesThe tables below display the actual and expected salary increases for full-time employees, under theassumptions set in 2018.FY 2016Actual ExpectedERS3.696%4.228%PFRS7.202%5.161%Combined 4.168%4.354%FY 2017A/EActual Expected0.8742 4.848%4.307%1.3954 5.104%5.196%0.9571 4.883%4.430%FY 2018A/EActual Expected1.1255 4.348%4.341%0.9823 4.706%5.227%1.1023 4.396%4.462%A/E1.00160.90020.9853FY 2019FY 2016-FY2019Actual Expected A/EActual Expected A/EERS4.943%4.423% 1.1176 4.464%4.326% 1.0320PFRS5.314%5.596% 0.9496 5.565%5.298% 1.0505Combined 4.993%4.585% 1.0891 4.614%4.459% 1.0347Note that the expected salary experience using the current assumptions do not perfectly match theaggregated figures (using FY 2015 data) of 4.2% in ERS and 5.0% in PFRS. The implemented salaryscale assumptions are indexed by years of service. Aggregating a service indexed salary scale will notyield the same result each year as the demographics of the valuation cohort (service, age, and plan)changes from year to year.6
III. Asset Valuation MethodThe values since FY 2000 are given below (in billions):Market Value (MVA) v. Actuarial Value of Assets (AVA)GASB 25UALEANRatioAVA/ ALEAN ‐20.0 122.1%AVA2000 128.9 110.6 90.62001114.0119.498.0‐21.4 121.9116.32002112.7125.1103.9‐21.2 �1.2 101.02005128.0123.7120.0‐3.7 103.12006142.6132.0126.6‐5.4 104.3112.62007156.5142.5134.6‐7.9 105.9116.32008155.8151.7141.3‐10.4 107.4110.32009110.9148.9146.7‐2.1 114.692.297.42015189.3184.2196.512.493.7 6.1FYALEAN0.6202099.4bTPLGASB 67RatioMVA/ TPLEAN142.3%aMVAEANUseALEANas aproxy90.7104.0106.7229.9a) Financial Statement Plan Net Position (i.e. Invested Assets Receivables)[both the MVA & AVA exclude funds for group term life insurance]b) Entry Age Normal Total Pension Liability (TPLEAN) is similar to Accrued Liability (ALEAN),the chief difference being that TPL is projected from the valuation one year earlier toallow sufficient time for financial statement auditors to audit the data and calculationsc) The equity smoothing was ‘restarted’; MVA AVAas the market value of the fixed income portfolio exceeded the amortized cost.7
IV. Demographic AssumptionsA. Pensioner Mortality Experience (annual option 0 in millions)SystemRetirementActualFY .052293.957286.0471.028Male Laborer*44.73342.2721.058162.535157.7571.030Female Clerk*71.29766.1791.077253.056243.2491.040Female 873919.0231.032ERSDisabilityERS &PFRSFY 2019Male Clerk*ServicePFRSRetireeBeneficiary**All Pensioner Mortality* Clerk refers to White Collar while Laborer refers to Blue Collar** Beneficiary dollars reflect actual pension receivedB. Mortality ImprovementIt has been five years since the adoption of Society of Actuaries’ Scale MP-2014 for mortalityimprovement. I recommend that NYSLRS actuarial valuations update Society of Actuaries’ MortalityImprovement Scale MP-2014 to MP-2018, the most recently available.8
C. Active Member Decrement ExperienceFY 2019DecrementFY 2016-2019ExposuresActualExpectedA/E *ExposuresActualExpectedA/E 80 Srv 289,28516,09915,6201.031329,10952,65657,2890.9192 Srv 329,5143,0213,2650.925101,05510,41611,1630.9333 Srv 422,7331,8861,8821.00279,7866,6036,5741.0044 Srv 518,3051,3201,1461.15267,2614,7014,1831.1245 Srv 1060,5932,9362,2551.302260,56411,7789,8641.19410 4615,6310.956493,30959,34863,8260.9300 Srv 2028163561.1332,1033943990.98820 Srv 3020066581.1331,4563984150.95830 Service395112901.2402,8798026901.1630 Srv 2060,0634,6634,7750.977253,68719,48919,8000.98420 Srv 3035,3444,7835,2890.904144,20618,91421,0300.89930 2Tiers 1,2All Service3212.6534121102.177Tiers 3,5,6All Service2,8807545331.41514,4543,1782,6331.207All TiersAll Service1,0852192051.0694,7341,0398901.167PFRS Service o additionsAll Service1,8893192361.3517,6591,1139201.210with add’l 60thsAll Service4,9266925641.22820,5482,4752,2721.089State PoliceAll dental458,102050.0001,818,4413200.152Regular r PlanPFRSAll PlansAll ServiceERS Service RetirementTier 1Regular PlanTiers 2,3,4,5,6State COCounty CO20 Year PlansDisability Retirements and DeathsERSDisabilityRetirementPFRSDeathsPFRS* reflects quotient of unrounded Actual and Expected counts9
V. Effect on ContributionsThe table below summarizes the projected average employer contribution rates for the most recentvaluations.2005LocalEmployerBillingDate 2/12007200620089.616.62.6 / 6.8200720098.515.82.5 / 7.2200820107.315.12.3 / 7.7OriginalOriginal2009201111.9 (0.4)18.2 (0.1)3.6 / 8.59.5%17.5%2010201216.3 (0.4)21.6 (0.0)4.9 / 8.910.518.52011201318.9 (0.4)25.8 (0.1)5.5 / 9.511.5Alternate19.5Alternate 0.32012201420.9 (0.4)28.9 (0.0)6.2 / 10.012.512.0%20.520.0%1.12013201520.1 (0.4)27.6 (0.1)6.1 / 62017201820192020202118.2 (0.5)15.5 (0.4)15.3 (0.4)14.9 (0.5)14.6 (0.4)14.6 (0.5)24.7 (0.0)24.3 (0.0)24.4 (0.1)23.5 (0.0)23.5 (0.0)24.4 (0.0)5.5 / 11.14.8 / 11.54.9 / 12.14.9 / 12.84.9 / 13.45.0 / 3.34.14.23.83.32.9Valuation4/1ERS(reg planGLIP)PFRS(GLIP)10.7%17.0%Total EmployerContributions/FY Benefits(billions) 2.7 / 6.4Contribution Stabilization Program (CSP)Mitigated Rates(does not apply to GLIP,strikethrough no amortizing)ERSPFRSCSPBalance(billions)The peak total employer contributions followed the Global Financial Crisis of 2008 (the lag due to assetsmoothing) with employer contributions at 62% of benefit payments. This is expected to relax to 36% asthe system steadily recovers from the crisis.The 3/31/2019 CSP amortization balance is 1.82b state 1.03b local 2.85b total.In ERS the associated new entrant rate for the valuation cohort is 12.2%, and 14.6%/12.2% 120%.In PFRS the associated new entrant rate for the valuation cohort is 20.6%, and 24.4%/20.6% 118%.Note that the average new entrant rates for the valuation cohort increased from 3/31/2018 (ERS 12.0%and PFRS 20.4%) due to the combined effect of the update from MP-2014 to MP-2018 and change from7.0% to 6.8%.The associated new entrant contribution is 4.2b. The additional 0.8b is 7.1% of the UALEAN of 11.2b.The new entrant rate for the tier 6 valuation cohort is 8.4% in ERS and 14.0% in PFRS.10
VI. Gain/Loss Analysis2020 Estimated Contributions (2/1/20 Payment)Changes Due to Gains/Losses In:FY 2015 Investment Performance (7.2% v 7.5%)FY 2016 Investment Performance (0.2% v 7.0%)FY 2017 Investment Performance (11.5% v 7.0%)FY 2018 Investment Performance (11.4% v 7.0%)FY 2019 Investment Performance (5.2% v 7.0%)Mortality Improvement Scale MP-2014 to MP-2018Assumed return reduction from 7.0% to 6.8%Non-Investment Assumptions(Demographic, Salary Scale, COLA)Tier 6 New EntrantGLIP, Administrative ContributionsMiscellaneousNet Change2021 Estimated Contributions (2/1/21 0.1%-0.1%0.0%14.6%-0.8%0.1%0.1%0.9%24.4%In a nutshell, the assumed return reduction puts upward pressure on the system average rates. New tier 6members with less lucrative benefits and the change from mortality improvement scale MP-2014 to MP2018 puts downward pressure on the rates. In ERS all gains and losses summed to 0 while in PFRS wherethe assumed return reduction has more leverage due to the maturity of the system, there was a net rateincrease.VII. Summary of RecommendationsI recommend that the mortality improvement assumption be updated from Scale MP-2014 to MP-2018and the investment return assumption be decreased from 7.0% to 6.8%. I recommend all otherassumptions be maintained. I am a Member of the American Academy of Actuaries and meet theAcademy’s Qualification Standards to issue this Statement of Actuarial Opinion.This recommendation was reviewed by the Actuarial Advisory Committee (AAC) in a meeting onAugust 8, 2019.11
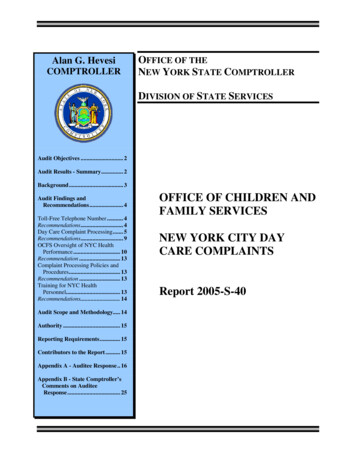
VIII. Historical Employer Contribution Average RateAverage 996199719981999200020012002200320042005Average 12201320142015201620172018201920202021Average 24.315.324.414.923.514.623.514.624.4Employer Contribution Average Rate Trend4035Average Rate as a Percent3025201510501972 1975 1978 1981 1984 1987 1990 1993 1996 1999 2002 2005 2008 2011 2014 2017 2020Contribution YearERSPFRS12
IX. Risk DisclosuresWhy should a governmental entity take on defined benefit (DB) pension risk? DB plans are aneconomically efficient means of attracting and retaining employees. For example, in the matter of publicsafety, special plans that offer half-pay at 20 or 25 years of service guarantee income in later middle agewhen physicality may wane while tasks remain grueling. During the career, disability and death benefitsprovide income protection to those who risk their lives in service to the public.Optimizing the economic efficiencies of a DB plan requires prefunding the benefit promises, ideally byway of smooth employer contribution rates. Actuarial Standard of Practice No. 51 (ASOP 51“Assessment and Disclosure of Risk Associated with measuring Pension Obligations and DeterminingPension Plan Contributions”) requires assessment and disclosure of risks inherent in the funding of DBplans. The two primary forms of risk are 1) insufficient employer contributions to fund the benefits, and2) intolerable volatility in the employer contribution rate.Employer Contribution Sufficiency RiskContribution Fulfillment RiskIn NYS, employers are required to pay the actuarially determined contribution. Employers who aredelinquent are pursued and interest is charged on any late payments. Thus there is very little risk thatemployer contributions will not be paid. This is the most significant component of a well-funded DB plan.Poorly funded DB plans invariably have a stretch of time when employer contributions are neglected.Actuarial AssumptionsActuarial assumptions and methods determine the allocation of benefit costs over time; they do not,however, determine the ultimate benefit costs. The ultimate cost of benefits is based on the lucrativenessof the promises and the performance of the assets.The expected long term employer contribution rate is the rate that would be charged if all assumptionswere met annually. As experience deviates from what was assumed, the employer contribution ratesdeviate from the expected long term rate. When billing rates are greater than the expected long term rates,the current taxpayer is funding benefits earned in prior years. When billing rates are less than the expectedlong term rates, the current taxpayer is benefiting from contributions collected in prior years. The moreconservative a set of assumptions, the more quickly contributions are collected, possibly levying too greata cost to current taxpayers. The less conservative a set of assumptions, the more likely contributions willincrease, possibly levying too great a cost to future taxpayers. The best assumptions decrease thelikelihood of deviations in one direction persisting over long periods. In so doing, governmental servicesare compensated by the taxpayers benefitting from those services (i.e. there is intergenerational equity).New York State Retirement and Social Security Law (NYS RSSL) requires a review of all assumptions atleast once every five years. To comply, the New York State and Local Retirement System (NYSLRS)undertakes a quinquennial comprehensive experience study and update of assumptions with areasonableness review every year. Any emerging trends that are believed to continue in the future maywarrant an assumption adjustment between quinquennial studies. Assumptions are reviewed annually bythe Comptroller’s Actuarial Advisory Committee and quinquennially by a consulting firm. The annualonline publishing of the actuarial assumptions provides transparency to interested parties.13
Assumed Investment Return Expectation RiskEmployer contribution rates are most sensitive to the assumed investment return. This report recommendsdecreasing this assumption from 7.0% to 6.8% for the 4-1-2019 actuarial valuation. The following tableshows the FY 2021 system average billing rates and tier 6 expected long term billing rate (aka new entrantrate) for various assumed investment returns using the 4-1-2019 valuation cohort. The exceedance columnshows the probability of exceeding the assumed return over a 30 year period using the capital marketassumptions and policy asset allocation approved by Pension and Investment Cash Management (PICM)in 2015, the year of the most recently provided comprehensive asset/liability Employees’ Retirement SystemFY 2021Tier 6System AverageNew Entrant RateBilling 4%12.2%7.9%Police and Fire Retirement SystemFY 2021Tier 6System AverageNew Entrant RateBilling 4.0%21.3%13.2%Probability ofAssumed ion and Salary Scale Expectation RiskThe inflation assumption is used to compute COLA (cost of living adjustment) payments to retirees andbeneficiaries. The COLA program provides payments equal to one half of the inflation rate based on thefirst 18,000 of the single life allowance. There is a floor of 1% and a cap of 3% so there is little risk ofsignificant gains or losses in this valuation component.The salary scale assumption is used to project future increases in a member’s salary to estimate the finalaverage salary at retirement as well as determine billable salary over a member’s career. If membersreceive greater salary increases than assumed, greater benefits will be paid out in the future than expected,requiring an increase in employer contributions to make up for the shortfall. Salary increases vary withina relatively narrow range, so there is minor risk of significant gains or losses in this valuation component.Demographic Expectation RisksDemographic assumptions estimate member behavior with regard to decrements (i.e. change in status)such as retiring, withdrawing or dying. Since NYSLRS is large (over 1.1 million participants), theseassumptions are developed with a high degree of credibility using NYSLRS own experience.Actual/Expected (A/E) ratios are displayed on pages 8 and 9 earlier in this report to show how actualpensioner mortality and active member decrements track expectations. Decrements vary within arelatively narrow range, so there is minor risk of significant gains or losses in this valuation component.NYSLRS is not large enough to develop in-house mortality improvement assumptions and thus relies onmortality improvement scales based on nationwide experience derived from data collected from the SocialSecurity Administration by the Society of Actuaries (SOA). This report recommends using scale MP2018 for the 4-1-19 valuation. The SOA’s initial scale, MP-2014, now looks to have been a bit optimistic.More recent tables vary within a relatively narrow range, so after this year’s recommended change, thereis minor risk of significant gains or losses in this valuation component.14
Employer Contribution Volatility RiskInvestment Volatility RiskEmployer contribution rate smoothness is most sensitive to the investment return experience. We canevaluate exposure to investment volatility risk using the following Asset Leverage Ratio:𝐴𝑠𝑠𝑒𝑡 𝐿𝑒𝑣𝑒𝑟𝑎𝑔𝑒 𝑅𝑎𝑡𝑖𝑜𝑀𝑎𝑟𝑘𝑒𝑡 𝑉𝑎𝑙𝑢𝑒 𝑜𝑓 𝐴𝑠𝑠𝑒𝑡𝑠 𝑀𝑉𝐴𝑃𝑟𝑒𝑠𝑒𝑛𝑡 𝑉𝑎𝑙𝑢𝑒 𝑜𝑓 𝑉𝑎𝑙𝑢𝑎𝑡𝑖𝑜𝑛 𝐶𝑜ℎ𝑜𝑟𝑡 𝐵𝑖𝑙𝑙𝑎𝑏𝑙𝑒 𝑆𝑎𝑙𝑎𝑟𝑦 𝑃𝑉𝐵𝑆The following table displays the ratio and it components in the middle of the last four decades and for themost recent year (dollar amounts in billions).ERSPFRSFYEMVAPVBSRatio1985 22.8 102.022%1995 53.3 158.234%2005 108.7 176.162%2015 161.2 203.179%2019 182.7 239.276%MVAPVBSRatio 4.1 11.935% 9.8 16.560% 19.3 27.071% 28.2 30.991% 32.5 37.686%The ratio is zero at plan inception, but increases as assets accumulate. Poor investment performance in anew plan is not problematic as there was not much to lose and plenty of billable salary to collectcontributions and accumulate assets before benefits become due. In a more mature fund with a high assetleverage ratio, investment volatility has a greater impact on the employer contribution rate. NYSLRS isnow a mature plan with the associated significant exposure to investment volatility risk.Mitigating Employer Contribution Volatility RiskNYSLRS currently employs two methods to reduce employer contribution rate volatility. An industry andGASB standard level five year asset smoothing method is used to dampen annual investment returnvolatility. Any deviations from the current expected return of 6.8% are recognized in equal incrementsover a period of five years.The Contribution Stabilization Program (CSP signed into law in 2010 - the Alternate Program was signedin 2014 and had a one year opt-in window) provides an optional additional layer of employer contributionrate smoothing. Under the CSP, on the billing date, a participating employers is required to remit a gradedrate contribution and permitted to amortize over a 10 year period the balance between the actuarialcontribution and the graded (12 year period for the Alternate Program). The graded rate increases ordecreases up to 1% each year (0.5% for the Alternate Program) in the direction of the system averagecontribution rate. During “ordinary” investment periods, the actuarial and graded rates converge. Largedeviations may occur when there is extraordinary asset performance, such as after the Global FinancialCrisis of 2008.15
Pensioner Mortality Gender/Collar specific tables based upon FY 2011-2015 experience with Society of Actuaries' Scale MP-2018 loading for mortality improvement. Active Member Decrements Based upon FY 2011-2015 experience This recommendation has been shared with the Systems' Actuarial Advisory Committee (AAC) for their review and comment.