Transcription
LEARN ROAD ESTIMATEA Software for Quantity Estimation &Cost, Project Control for RoadBy :Y.A. Agboatwala &Fatima.Y. Agboatwala1802, Jamuna Amrut,219, Patel Estate, S.V.Road,Jogeshwari(W), Mumbai - 400102Phone: 09820792254 , (022) 26783525Url: www.supercivilcd.com,www.agboatwala.comEmail : cd@gmail.com
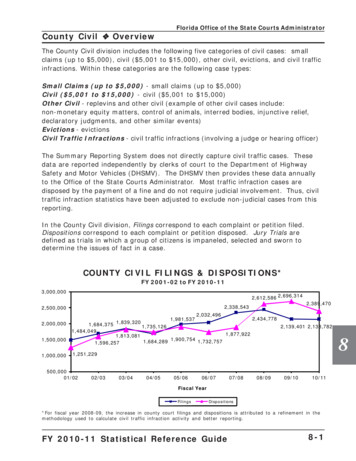
LEARN ROAD ESTIMATECreate New FileSTEP NO. 1Edit ItemsSTEP NO. 2Add RecordSTEP NO. 3Edit Quantities (Records)STEP NO. 4Edit Material CoefficientsSTEP NO. 5Edit Labour CoefficientsSTEP NO. 6Summary (Display Results)STEP NO. 7Display Pie / Bar ChartsSTEP NO. 8Area / VolumeSTEP NO. 9Typical Forms/FormatsSTEP NO. 10Copy, Delete, Edit & Export to Excel.STEP NO. 11Monthly Cash Flow, Material, menSTEP NO. 12Consumption & S Curve.Earthwork Quantity CalculationsSTEP NO. 13
LEARN ROAD ESTIMATE STEP BY STEPSTEP NO. 1When Program starts, the graphics above is displayed. The Menu bar contains followingoptions.I. FileII. Edit ItemsIII. Add RecordIV. Copy Edit QuantitiesV. Edit CoefficientsVI. SummaryVII. GraphicsVIII. Area VolumeClick the FILE option in the MENU bar. The following window will open.Now click "Make New File" option. The following window will open.
You must create a separate Folder / Directory to store your files.I have created a Directory called " 1RoadEstimate " in C drive to store myROAD ESTIMATE files.Now go to this folder & give a file name to your project. I have given " test " as the name ofmy new project file. Click the save button.When you click the save button, following window will open.
The window requires various project details. Whatever values you will fill here will serve asdefault values for the project.I have filled up the above values as required by my new project "test".You can change these values now OR later by clicking "Edit Project File" option in File Menu.Now click the OK button, following window will appear.Click OK button. Now project File creation is complete.The above window gives the following two vital information.1. Use Edit Item Menu to Fill Rates of various Items &2. Use Add Record Menu to add Quantities of various Items.STEP NO. 1 IS OVER.
LEARN ROAD ESTIMATE STEP BY STEPSTEP NO. 2Refer the graphics above. The Menu bar contains following options.I. FileII. Edit ItemsIII. Add RecordIV. Copy Edit QuantitiesV. Edit CoefficientsVI. SummaryVII. GraphicsVIII. Area VolumeIX. Forms 1X. Forms 2Click the Edit Item option in the MENU bar. The following window will open.
Now click "test" file & click open. A new window with all Sections will appear as follows. Theheading is Edit / Delete Items - Double Click any option. This we will call Item Menu.Now double click " CHAPTER - 1 : CARRIAGE OF MATERIALS ".A new window will appear as follows. This is main window which can perform the followingfunctions.Display all items.Print all items.Add your own items.Delete any existing item.Add Material, Labour, Subcontractor & Equipment Rates.One more field called " Item ID " is given, in case you want to identify items apart from theexisting Item No.You can select any item from 1.1 to 1.10 by taking the Blue cursor to that item row or justclicking with the mouse on any item row.
We will select item 1.1Enter Labour Rate 1.0Material Rate 2.0 or leave it as it is.Subcontractor Rate 1.0 or leave it as it is.Equipment Rate 1.0 or leave it as it is.Now Click UPDATE button.You will see that Item Rate (With Pink background) will change to 6.2Final window will look like as follows.
Similarly you can give Rates of more items, which are likely to be used in the project. Alwaysclick UPDATE button to see the final rate. This final Item Rate is arrived at after addingOverheads, Taxes & Profit margin.Now Click the EXIT button to leave this window.You are back to Item Menu. Here you can select other sections by double clicking any section& add the item rates of various items which you think will be required for your project.STEP NO. 2 IS OVER.
LEARN ROAD ESTIMATE STEP BY STEPSTEP NO. 3Refer the graphics above. The Menu bar contains following options.I. FileII. Edit ItemsIII. Add RecordIV. Copy Edit QuantitiesV. Edit CoefficientsVI. SummaryVII. GraphicsVIII. Area VolumeIX. Forms 1X. Forms 2Click the Add Record option in the MENU bar. The following window will open.
Now click "test" file & click open. A new window with all Sections will appear as follows. Theheading is Add Quantities - Double Click any Section. This we will call Add Menu.Now double click " CHAPTER-1 : CARRIAGE OF MATERIALS".A new window will appear, which will display all the items under CHAPTER - 1, as shown infollowing graphics.Now DB click the item " 1.1 Loading/unloading of boulder/aggregate/sand/moorum ".A new menu will appear with the heading of Add Quantities, as shown below.
Fill the various fields in the above window & click ADD QTY button.If you want to deduct any QTY then give " Numbers " field a negative number.If you want to add another record then press " NEXT " button.Press " EXIT ITEM " button to exit this item.Now you will be back to item menu. You can select another item for adding record OR youcan exit this menu by pressing " EXIT " button.Now you will be back to Add menu. You can select another Section for adding record OR youcan exit this menu by pressing " EXIT " button.For quick and Fast additions of same Item use " Copy Edit Quantities " option from themain menu.
I have added various information to various fields. The final window will look like thegraphic shown above.STEP NO. 3 IS OVER.
LEARN ROAD ESTIMATE STEP BY STEPSTEP NO. 4Refer the graphics above. The Menu bar contains following options.I. FileII. Edit ItemsIII. Add RecordIV. Copy Edit QuantitiesV. Edit CoefficientsVI. SummaryVII. GraphicsVIII. Area VolumeIX. Forms 1X. Forms 2Click the Copy Edit Quantities option in the MENU bar. The following window will open.
Now click " test " file & click open. A new window with all Sections will appear as follows. Theheading is Edit / Delete / Copy Menu - Double Click any option.Now double click " CHAPTER-1 : CARRIAGE OF MATERIALS ".A new window will appear as follows, listing all the quantity records. Since I have added onlyone record, the following graphics will displays that record.
The above window is very important tool, which can perform the following functions.By Clicking " COPY" button, the selected record will get appended at the bottom of List.By Clicking " REMOVE " button, the selected record will be deleted.By Clicking " MOVE UP " or " MOVE DOWN " buttons, the selected record will move up ordown.By Clicking " PRINT " button, all the records will be printed.The most important option available here is Editing. At the base of window there is aheading in RED which says " Edit Record no. 1 ".Just change the various fields (Values in the text boxes) & it will get reflected in the selectedROW above.Click " UPDATE " button to recalculate quantities.I have changed the various fields, the final display is given in following graphics.Now Click the EXIT button to leave this window.You are back to Edit Menu.Similarly you can display / Edit / Copy / Delete records from other sections by double clickingthe required section.
STEP NO. 4 IS OVER.
LEARN ROAD ESTIMATE STEP BY STEPSTEP NO. 5NOTE: DO NOT EDIT MATERIAL OR LABOUR COEFFICIENTS UNLESS YOU HAVE SOME VALID REASONS TO DO SO.THE MATERIAL COEFFICIENTS ARE USED FOR CALCULATION OF TOTAL CEMENT, SAND, AGGREGATE & BITUMENQUANTITIES ONLY.THE LABOUR COEFFICIENTS ARE USED FOR CALCULATION OF TOTAL MASON, CARPENTER, SKILLED LABOUR,UNSKILLED LABOUR & FOREMAN QUANTITIES.THE ABOVE COEFFICIENTS ARE ALSO USED IN CALCULATION OF MONTHLY MATERIAL, LABOUR & CASH FLOWREQUIREMENTS AFTER USER HAS PREPARED THE PROJECT BAR CHART.Refer the graphics above. The Menu bar contains following options.I. FileII. Edit ItemsIII. Add RecordIV. Copy Edit QuantitiesV. Edit CoefficientsVI. SummaryVII. GraphicsVIII. Area VolumeIX. Forms 1X. Forms 2Click the Edit Coefficients option in the MENU bar. Here you will have two options.Material CoefficientsLabour CoefficientsClick the Material Coefficients option. The following window will open.
Now click " test " file & click open. A new window with all Sections will appear as follows. Theheading is Edit / Delete Material Coefficients - Double Click any option.Now double click " CHAPTER-12 : FOUNDATIONS ".A new window will appear as follows, listing Material Coefficients of items having Cement,Sand, Aggregate & Bitumen Components.
The above window can perform the following functions.By Clicking " PRINT " button, all the records will be printed.The most important option available here is Editing. At the base of window there is aheading in RED which says " Edit Material Coefficients 12.23 ".Just change the various fields (Values in the text boxes) & it will get reflected in the selectedROW above.Click " UPDATE " button to refresh changes.Now Click the EXIT button to leave this window.You are back to Section Menu.Similarly you can Edit materials Coefficients of other sections by double clicking the requiredselected section.STEP NO. 5 IS OVER.
LEARN ROAD ESTIMATE STEP BY STEPSTEP NO. 6NOTE: DO NOT EDIT MATERIAL OR LABOUR COEFFICIENTS UNLESS YOU HAVE SOME VALID REASONS TO DO SO.THE MATERIAL COEFFICIENTS ARE USED FOR CALCULATION OF TOTAL CEMENT, SAND, AGGREGATE & BITUMENQUANTITIES ONLY.THE LABOUR COEFFICIENTS ARE USED FOR CALCULATION OF TOTAL MASON, CARPENTER, SKILLED LABOUR,UNSKILLED LABOUR & FOREMAN QUANTITIES.THE ABOVE COEFFICIENTS ARE ALSO USED IN CALCULATION OF MONTHLY MATERIAL, LABOUR & CASH FLOWREQUIREMENTS AFTER USER HAS PREPARED THE PROJECT BAR CHART.Refer the graphics above. The Menu bar contains following options.I. FileII. Edit ItemsIII. Add RecordIV. Copy Edit QuantitiesV. Edit CoefficientsVI. SummaryVII. GraphicsVIII. Area VolumeIX. Forms 1X. Forms 2Click the Edit Coefficients option in the MENU bar. Here you will have two options.Material CoefficientsLabour CoefficientsClick the Labour Coefficients option. The following window will open.
Now click " test " file & click open. A new window with all Sections will appear as follows. Theheading is Edit / Delete Labour Coefficients - Double Click any option.Now double click " CHAPTER-12 : FOUNDATIONS ".A new window will appear as follows, listing Labour Coefficients of items having Mason,Carpenter, Skilled Labour, Unskilled Labour & Foreman Components.
The above window can perform the following functions.By Clicking " PRINT " button, all the records will be printed.The most important option available here is Editing. At the base of window there is aheading in RED which says " Edit Labour Coefficients for item no. 12.23 ".Just change the various fields (Values in the text boxes) & it will get reflected in the selectedROW above.Click " UPDATE " button to refresh changes.Now Click the EXIT button to leave this window.You are back to Section Menu.Similarly you can Edit Labour Coefficients of other sections by double clicking the requiredselected section.STEP NO. 6 IS OVER.
LEARN ROAD ESTIMATE STEP BY STEPSTEP NO. 7Refer the graphics above. The Menu bar contains following options.I. FileII. Edit ItemsIII. Add RecordIV. Edit QuantitiesV. Copy Edit CoefficientsVI. SummaryVII. GraphicsVIII. Area VolumeIX. Forms 1X. Forms 2Click the Summary option in the MENU bar. The following options will open up.All the above options display the various quantities & cost aspect of a given project. I haveadded random quantities & appropriate rates to various items in sections.When I click the " Total Cost " option, following window is displayed.
Click QTY file & click open. A new window with all Sectional costs appear as follows.
Similarly when you click other options appropriate window will open & display the requiredparameters.STEP NO. 7 IS OVER.
LEARN ROAD ESTIMATE STEP BY STEPSTEP NO. 8Refer the graphics above. The Menu bar contains following options.I. FileII. Edit ItemsIII. Add RecordIV. Copy Edit QuantitiesV. Edit CoefficientsVI. SummaryVII. GraphicsVIII. Area VolumeIX. Forms 1X. Forms 2Click the Graphics option in the MENU bar. The following window will open up.
Click " test " file & click open. A new window will open Displaying Chart Menu as under.All the above options display the various quantities & cost aspect of a given project in Pie orBar Chart form.When I double click the " Total Cost : Pie Chart " option, following Pie Chart is displayed.Similarly when you double click other options, appropriate windows will open & display therequired Pie / Bar Chart.
STEP NO. 8 IS OVER.
LEARN ROAD ESTIMATE STEP BY STEPSTEP NO. 9Refer the graphics above. The Menu bar contains following options.I. FileII. Edit ItemsIII. Add RecordIV. Copy Edit QuantitiesV. Edit CoefficientsVI. SummaryVII. GraphicsVIII. Area VolumeIX. Forms 1X. Forms 2Click the Area Volume option in the MENU bar. The following options will open up.AREA / VOLUME CALCULATION
Click the 3rd option viz; " Area And Volume ".The following options will open up.Area CalculationArea & Volume of Cut / Fill on Horizontal GroundArea & Volume of Cut / Fill on Slopping GroundContour Grading & Volume CalculationContour Software.Area CalculationArea & Volume of Cut / Fill on Horizontal GroundArea & Volume of Cut / Fill on Sloping GroundVolume of Longitudinal SectionVolume of Longitudinal Section with Transverse SlopeContour Grading & Volume CalculationCONTOUR SOFTWARE :The above programs are self explanatory.Click on any of the above Link & Appropriate Program will Commence.For " X sec in AutoCAD " and " L sec in AutoCAD " refer Step no. 13 and 14.STEP NO. 9 IS OVER.
LEARN ROAD ESTIMATE STEP BY STEPSTEP NO. 10Refer the graphics above. The Menu bar contains following options.I. FileII. Edit ItemsIII. Add RecordIV. Copy Edit QuantitiesV. Edit CoefficientsVI. SummaryVII. GraphicsVIII. Area VolumeIX. Forms 1X. Forms 2Click the Forms 1 option in the MENU bar. The following options will open up.
If you click the Forms 2 option then following graphics will appear.The Forms 1 & Forms 2 options display various typical forms, formats or templatesgenerally used in construction industry. A typical quantity measurement sheet is displayedas under.
All the above Forms / Formats / Templates are in M. S. WORD format.In case of any difficulty in opening the above documents, user can directly access the abovefiles from C: \ Program files \ ROAD ESTIMATE \ Form directory.STEP NO. 10 IS OVER.
LEARN ROAD ESTIMATE STEP BY STEPSTEP NO. 11Refer the graphics above. The Menu bar contains following options.I. FileII. Edit ItemsIII. Add RecordIV. Copy Edit QuantitiesV. Edit CoefficientsVI. SummaryVII. GraphicsVIII. Area VolumeIX. Forms 1X. Forms 2Click the FILE option in the MENU bar. The following window will open.Now click Copy File option. A new window will appear as follows, asking for the name of theFile to be copied.
Now click " test " file & click open. A new window will appear as follows, asking for thename of the destination file.Give the destination file name as P 231. Press " OK " button. A new message window willappear as follows.The above message confirms the copying of all respective files to new P 231 file. Note thatoriginal file " test " is intact. Press " OK " button to exit.Again Now click Delete File option. A new window will appear as follows, asking for thename of the File to be deleted.
Select P 231 file & click " Open " button. A new window will open as follows, requiringconfirmation.Click the " OK " button, again a new window will open as follows, confirming deletion ofP 231 qty & item files.Now click Edit Project File option. A new window will appear as follows, asking for the nameof the project File to be Edited.
Now click " test " file & click open. A new window will appear as follows, enabling user tochange the various project parameters.After you have completed editing the various project parameters click " EXIT " button.
Now click Export QTY to EXCEL option. A new window will appear as follows, asking for thename of the project File to be Exported to EXCEL.Now click " test " file & click open. A new window will appear as follows, indicating that allthe quantity files are copied to a new file with .TXT extension.User can open this Text file in EXCEL as comma separated Text File.STEP NO. 11 IS OVER.
LEARN ROAD ESTIMATE STEP BY STEPSTEP NO. 12Refer the graphics above. The Menu bar contains following options.I. FileII. Edit ItemsIII. Add RecordIV. Copy Edit QuantitiesV. Edit CoefficientsVI. SummaryVII. GraphicsVIII. Area VolumeIX. Forms 1X. Forms 2Click the FILE option in the MENU bar. The following window will open.Now click Gnatt Chart / Cash Flow option. A new window will appear as follows, asking for thefile name.
Now click " test " file & click open. A new window will appear as follows, showing emptyGnatt / Bar Chart.Now let us start constructing Gnatt / Bar Chart.Click " Material Carriage " button situated at the left bottom corner of chart. Thefollowing window will appear asking for " Enter Start of Material Carriage ". Type 0 & press " OK ".
Again a new window will appear asking for " Enter End of Material Carriage ". Type 1 & press "OK ". This window is displayed as under.Now you will see a RED BAR is displayed between 0 and 1 on the " Material Carriage " ROW.Similarly you can prepare the complete GNATT / BAR CHART by clicking various activitybuttons such as Clear Site, Earthwork, Bases, Surfacing etc. I have completed the BARCHART for the whole project as follows.
In case you have made any mistake or wants to change the Bar Chart, just click" Edit Bar Chart " button. Following window will appear.Just Edit Bar Start or Edit Bar End and click on UPDATE button to register changes.Note that bar end should always be greater then bar start.If you want to delete any activity, (BAR) just take mouse to that ROW & click (select) andpress the " REMOVE " button. Now you will notice that the selected activity has disappearedfrom this edit menu as well as the corresponding RED BAR has also been removed from theBAR CHART.Click Exit.Click on the " Cash Flow / Material / Men distribution : " Button to display these parameters.A new window will appear as shown in following 3 nos. of graphics.
The project duration of maximum of 24 months is allowed at a time. Note thatCash Flow / Material / Men distribution is entirely dependent on Gnatt Chart. If you prepare aBar Chart of 12 months duration & only few required activities thenCash Flow / Material / Men distribution will correspond to 12 months duration & thoseselected activities.Lastly Click on the " S CURVE " button. The " S CURVE " will be displayed as under.
Click EXIT " 3 " times to return to main menu.STEP NO. 12 IS OVER.
LEARN ROAD ESTIMATE STEP BY STEPSTEP NO. 13Refer the graphics above. The Menu bar contains following options.I. FileII. Edit ItemsIII. Add RecordIV. Copy Edit QuantitiesV. Edit CoefficientsVI. SummaryVII. GraphicsVIII. Area VolumeIX. Forms 1X. Forms 2Click the Area Volume option in the MENU bar. The following drop down menu appears.Click on Eathwork Quantities Option.The following window will open.
Now click "test" file & click open."Earthwork Quantities" is for calculation of Area / Volume of Road Longitudinal Section &Cross Section & AutoCAD Drawing.Following Window will open up.
The Ground Level (G.L) & Formation Level (F.L) data should be entered at fixed X & Y Intervals.Enter the X and Y Interval, Start X, Start Y, End X & End Y Values in Metres (M).Next Enter the Datum.All Data should be entered in Metres(M) , unless specified.ENTERING G.L AND F.LThe G.L and F.L at various x and y distances can be entered using Road Estimate Interface or canbe imported from AutoCAD or Excel.Import from Excel :The Data Entered in Excel File should be in the Following Format.The First Row should be heading.The Name of the Sheet should be "Sheet1".Save the Excel File in xls Format.In order to import the G.L and F.L at various x and y distances select Excel from Importfrom Autocad/ Excel option as shown below.
Next Click on Browse to select the Excel File.Click on Import.The X, Y, G.L and F.L values will be displayed in the G.L & F.L tab.Import from AutoCAD :The G.L and F.L values should be entered in Grid Format.Draw the Grid in AutoCAD as shown below.The Grid should be drawn to scale in the Layer "GRID".Every Horizontal and Vertical Line should be a complete line and not broken at an intersection.
Next Draw the G.L text at every Grid Intersection in the Layer "G.L".Next Draw the F.L text at every Grid Intersection in the Layer "F.L".Next Save the AutoCAD Drawing in dxf Format.In order to import the G.L and F.L at various x and y distances select AutoCAD from Importfrom Autocad/ Excel option as shown below.
Next Click on Browse to select the dxf File.Click on Import.The X, Y, G.L and F.L values will be displayed in the G.L & F.L tab.AUTO CREATION OF G.L AND F.L TABLE :To Auto Generate the G.L and F.L Table.Enter the X and Y Interval, Start X, Start Y, End X & End Y Values in Metres (M).Next, Click on Create Table Button.The Table Containing the X and Y Coordinates will be Auto Generted as shown below.The Existing Data will be overwitten.
Next the G.L and F.L data may be entered.DATA ENTRY ERROR :If an Error as shown below is Generated, mentioning "Data at an X, Y interval is missing".It indicates that either the Data is missing or not an extra Data is entered between the Given X, Y Inetrvals,which does not correspond to the Fixed Grid Intervals.In the Example Below Data, at X 0 and Y 15 is missing
In the Example below, Extra Data (0, 17) is entered between fixed interval points (0, 15 and 0, 20),Hence an Error of Missing data at X 0 and Y 20, will be generated.Next Enter the Pavement Width and Thickness Details for Rigid / Flexible Pavement.
Next, To calculate Earthwork Quantities Click on Calculate Earthwork Quantities Button.View the L & X Section Quantties in the L Section & X Section Quantities TabL Section Quantites:The L section quantities shows Average Quantiites at Mid Y Value.
X Section Quantites:Road Thickness Quantites:
View Longitudnal & Cross Section In AutoCAD:The AutoCAD Script File is saved in the same Folder as the Project FileStart AutoCAD.In AutoCAD click on Tools. From the drop down menu click on Run Script.A window dialogue box appears .Click on test.scr and Click on open.
.It will take a few seconds for the script to run, after which the Road Logitudnal & Cross Sectionwill appear in the form of AutoCAD drawing . The display will be as follows.
The Corresponding L Section table is also drawn in AutoCAD.Cross Sections are drawn at all IntersectionsShown below is Road Cross Section at chainage 0
The Corresponding X Section table at that chainage is also drawn in AutoCAD.Please note that the above drawing is Editable in AutoCAD.The above drawing is drawn in the following layers , they are1) Formation : It denotes the formation level.2) Ground : It denotes the ground level.3) hdist : It denotes the horizontal distance.4) vdist : It denotes the Vertical distance.5) texthead : It denotes the text.The layers can be turned Off / On at any time for convenience.just go to format option and click on layer from the drop down menu.Save the above Drawing in AutoCAD i.e. (.dwg) format
PROFILE CORRECTION :CUT FILLUse this Option to Obtain a Formation Level at which Cut Volume Fill VolumeTo Get the Optimim Formation Level Value at which Cut Volume Fill Volume ,select Cut Fill Option , as shown belowNext, Click on Calculate F.L button.Following Window is displayed.
If Yes is clicked, the Formation Level Values in the G.L & F.L table will be replaced with theOptimim Values at which Cut Fill.Next to calculate the Quantities at the Optimum F.L Click on "Calculate EarthworkQuantities" Button.As seen below, the L Section quantities show that Cut Volume Fill Volme.Similarly X Section Quantities show that Cut Volume Fill Volme.LIMIT FILL DEFICIT
Use this Option to Obtain a Formation Level to restrict the Soil Deficit (Fill Volume - CutVolume) to a particular value.Let us calculate the Formation Level at which Soil Deficit 100 M3To Get the Optimim Formation Level Value at which Soil Deficit 100 M3 ,select Limit Fill Deficit Option, and enter the required value in the box, as shown belowNext, Click on Calculate F.L button.Following Window is displayed.If Yes is clicked, the Formation Level Values in the G.L & F.L table will be replaced with theOptimim Values at which Soil Deficit 100 M3Next to calculate the Quantities at the Optimum F.L Click on "Calculate EarthworkQuantities" Button.As seen below, the X Section quantities show that Soil Deficit 100 M3LIMIT EXCESS CUT
Use this Option to Obtain a Formation Level to restrict the Excess Cut Volume (Cut Volume Fill Volume) to a particular value.Let us calculate the Formation Level at which Excess Cut 80 M3To Get the Optimim Formation Level Value at which Excess Cut 80 M3 ,select Limit Excess Cut Option, and enter the required value in the box, as shown belowNext, Click on Calculate F.L button.Following Window is displayed.If Yes is clicked, the Formation Level Values in the G.L & F.L table will be replaced with theOptimim Values at which Excess Cut 80 M3Next to calculate the Quantities at the Optimum F.L Click on "Calculate EarthworkQuantities" Button.As seen below, the X Section quantities show that Excess Cut 80 M3PRINT EARTHWORK QUANTITIES
In order to Print Earthwork Quantities click on Print button.Page 1 0f 4 (G.L & F.L)Page 2 0f 4 (L Section Quantities)
Page 3 0f 4 (X Section Quantities)
OTHER SOFTWARES:SUPER CIVIL CD - Single Point Solution To Your Civil Engineering NeedsSUPER RATE ANALYSIS - Rate Analysis Of 1299 Nos. Of Civil Engineering Items2D FRAME ANALYSIS - Discover The Beauty Of Structural AnalysisR C F ‐ A Software for Analysis, Design, Estimation & Costing of RCC FloorsS S F - Analysis, Design, Estimation & Costing of Steel Buildings, revised as per IS 800 : 2007Q T Y - Quantity Estimation & Cost, Project ControlSUPER REAL VALUATION - A Software For Immovable PropertiesROADS - Pavement Design & Rate Analysis Of Road ItemsELECTRIC COST - Costing, Project Control & MDS For Electrical ProjectsHVAC COST - Costing, Project Control & Design For HVAC EngineersBILLING JI - A Database Management Software For General BillingRA BILL - A Database Management Software For Item Rate Contract BillingBUILDERS BILL- A Database Management Software for Billing of Lump sum ContractsBID ANALYSIS - A Software For Technical & Commercial Tender AnalysisRAFT FOUNDATION -Analysis, Design, Estimation, Costing & Drawing of RCC Raft FoundationSTEEL 2007 - Limit State design of Steel as per IS 800 : 2007SITE CONTROL - A Management Software for Resource Control At Site.DESIGN & DRAWING CONTROL - A DBM Software for Control of Design & Drawing Manhours.COMPOSITE- A Software for Analysis, Design, Costing & Drawing of Composite Floor BuildingsINSTA COST- A Software for Estimating Project Cost & Tender SOQ InstantlyFLAT SLAB - A Software for Analysis, Design, Estimation, Costing & Drawings of Flat SlabsFLAT RAFT- A Software for Analysis, Design, Estimation, Costing & Drawings of Rigid RCC Flat RaftsOPTIMIZE BAR- A Software for Optimization of Reinforcements from Existing Bar Bending ScheduleOPTIMIZE STEEL - A Software for Optimization of Steel Sections from Existing Fabrication DrawingAutoQty - A Software for Automatic Quantity & Cost Estimation from AutoCAD Drawings
LEARN ROAD ESTIMATE Create New File STEP NO. 1 Edit Items STEP NO. 2 Add Record STEP NO. 3 Edit Quantities (Records) STEP NO. 4 Edit Material Coefficients STEP NO. 5 Edit Labour Coefficients STEP NO. 6 Summary (Display Results) STEP NO. 7 Display Pie / Bar Charts STEP NO. 8 Area / Volume STEP NO. 9 Typical Forms/Formats STEP NO. 10 Copy, Delete, Edit & Export to Excel.