Transcription
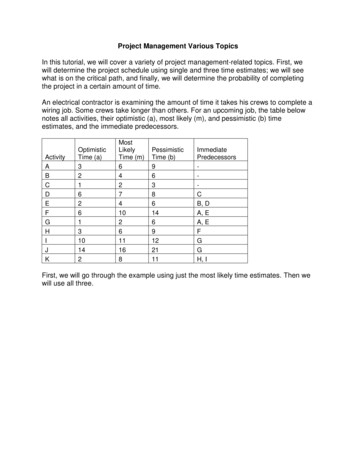
Project Management Various TopicsIn this tutorial, we will cover a variety of project management-related topics. First, wewill determine the project schedule using single and three time estimates; we will seewhat is on the critical path, and finally, we will determine the probability of completingthe project in a certain amount of time.An electrical contractor is examining the amount of time it takes his crews to complete awiring job. Some crews take longer than others. For an upcoming job, the table belownotes all activities, their optimistic (a), most likely (m), and pessimistic (b) timeestimates, and the immediate predecessors.ActivityABCDEFGHIJKOptimisticTime (a)3216261310142MostLikelyTime (m)64274102611168PessimisticTime (b)963861469122111ImmediatePredecessorsCB, DA, EA, EFGGH, IFirst, we will go through the example using just the most likely time estimates. Then wewill use all three.
For the first example, using a single time estimate, open Excel QM, click on the ExcelQM tab Alphabetical Project Management Predecessor List (AON).A Spreadsheet Initialization window will appear. This time, as shown below, we willselect 1 time estimate, 11 activities, and 2 as our max # of predecessors. Leave Graphchecked.
Click OK. A spreadsheet table and Gantt Chart will display.In the Data table, enter the times and predecessors from the table at the beginning ofthis tutorial. NOTE: you need to enter each predecessor individually in the columns.Once you have correctly entered the data, the results are automatically calculated.
In this example, our project will take 24 days in length and our critical activities are C, D,E, G, J. Excel QM gives us a Gantt chart as a graphical representation of this project:Gantt ChartABCDEFGHIJK051015202530TimeCritical ActivityNoncritical ActivitySlackClick here to download the completed spreadsheet table so you can compare it toyours.
If we use our three time estimates, just like before, we open Excel QM, click on theExcel QM tab Alphabetical Project Management Predecessor List (AON).This time, in the Spreadsheet Initialization window, we will select 3 time estimate, 11activities, and 2 as our max # of predecessors.
You can see from the table below, you need to enter each predecessor individually inthe columns.
Once you have correctly entered the data, the results are automatically calculated. Wenow have a critical path including C-D-E-F-H-K, and an estimated project completiontime of 36.5 days with a variance of 5.69 and standard deviation of 2.39 days.Click here to download the completed spreadsheet table so you can compare it toyours.We can use that information to determine the probability that we finish our project inless than three days using our NORMDIST function using 38 days, our length of 36.5,our standard deviation of 2.39, and 1. Just select any empty cell on your spreadsheetand enter NORMDIST(38,36.5,2.39,1). Our probability is .7349 that we can completethe project in less than 38 days.
If we want a network diagram, the best place is in POM QM for Windows. SelectModule Project Management (PERT/CPM).Then click File New Single time estimate.
Enter 11 for Number of activities; make sure Immediate predecessor list is selected.Click OK. Again, it’s vital to enter one predecessor per column.
After entering the data correctly, click Solve. The Window dropdown menu will appear.Select 2 Charts.We can click on the Precedence Graph tab in our solution to get the following:
You can see that the critical path is highlighted in red and is the same as the path wecalculated using Excel QM. Click here to download the graph so you can compare it toyours.POM QM works better at creating the graphs. If we look at the other solutions in QM forWindows, we can see that it is the exact same as what we obtained from our Exceloutput.This concludes the tutorial on project management various topics.
calculated using Excel QM. Click here to download the graph so you can compare it to yours. POM QM works better at creating the graphs. If we look at the other solutions in QM for Windows, we can see that it is the exact same as what we obtained from our Excel output. This concludes the tutorial on project management various topics.