Transcription
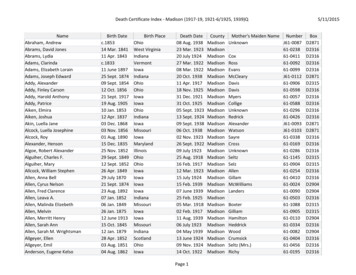
MADISON DIVIDEND INCOMEJune 30, 2021 Separately Managed Account Investment Strategy LetterMadison’s philosophy revolves around the principle of “Participate and Protect ”, which means we strive to build portfolios thatparticipate as fully as possible in favorable markets and, more importantly, protect principal in difficult markets with the goal ofoutperforming the Russell 1000 Value and the S&P 500 Index over a full market cycle. To pursue our goals, we own high qualitystocks with above-average dividends that have sustainable competitive advantages and strong balance sheets. We use our RelativeYield process to identify when a stock is out of favor and reaches an attractive valuation. An attractive relative yield candidate isa stock with a relative yield near the high end of its historical range and a long dividend paying history with a consistent recordof dividend increases. We then construct a diversified portfolio of high quality stocks with these characteristics.For the second quarter, the Madison Dividend Income portfolio returned 4.85% (gross) and 4.65% (net**),which compared to the S&P 500, Russell 1000 Value and Lipper Equity Income Index gains of 8.55%, 5.21% and 5.50%, respectively.The Dividend Income portfolio is a conservatively managed equity strategy that owns a high-quality portfolioof above-average dividend stocks with strong balance sheets and sustainable competitive advantages. We believethat owning high-quality stocks is the best way to generate attractive long-term returns over a full marketcycle while limiting drawdowns in bear markets and market corrections. We also believe it is important to staydisciplined to the investment process throughout the full market cycle despite changing short-term dynamics.As we discuss in the next section, we employ a repeatable and sustainable investment process. We expect thestrategy to outperform in falling markets, flat markets, and normally rising markets. We expect the strategyto underperform in rapidly rising or speculative markets, and we believe the first half of the year can becharacterized as a rapidly rising and speculative market.There are a few statistics we’d like to highlight that support our view it is a speculative market environment:XThe S&P 500 had its second-best first-half of the year since 1998, trailing only 2017’s 17% return.1XAn all-time high of almost 350 billion has been raised in initial public offerings in first half of 2021.2XDuring the past 12 months, almost 750 money-losing firms have sold shares in the secondary market,exceeding those that make profits by the biggest margin since at least 1982, according to data compiled bySundial Capital Research.3**Net returns are calculated using the highest Madison annual fee of 0.80%, calculated quarterly. They do not reflect any third-party investment advisory fees or other expenses that may be incurred in the management of the account. Such fees and expenses will reduce the actual returns of the account. Actual fees and expenses willvary depending on each individual agreement, so readers should consult their advisors for additional details. See each entity’s Part 2A Disclosure Brochure for moreinformation. Actual returns may vary depending on a particular account’s inception date, trading platform and trading discretion. Any differences in the timing oftrades may result in various performance outcomes for Madison’s separately managed accounts versus model manager accounts.1. Source: Forbes article dated June 30, 2021: Stock Market Posts Second-Best First Half In 23 Years—With S&P 500 Hitting New High2. Source: Bloomberg article dated June 27, 2021: The Global IPO Market Has Never Been Hotter Than It Is Right Now3. Source: Bloomberg article dated June 27, 2021: Record Stock Sales From Money-Losing Firms Ring the Alarm Bells
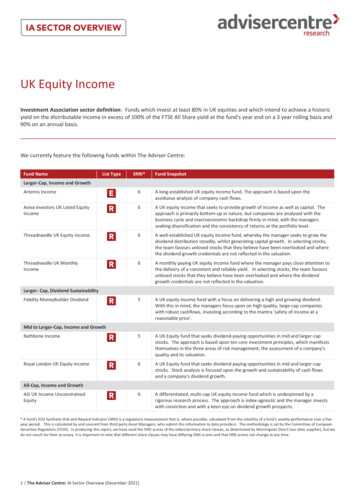
MADISON DIVIDEND INCOMEJune 30, 2021 Separately Managed Account Investment Strategy LetterExhibit 1:# of profitable firms with secondary offering# of unprofitable firms with secondary offeringNumber of FirmsSource: Bloomberg. As of June 27, 2021.We believe this speculative market environment has created an attractive opportunity to invest in high-quality stockswith above average dividends at discounted valuations. As shown, quality companies are trading at their biggestdiscount to the overall market as measured by the Russell 1000 Index in two decades. The last time quality stockstraded at a similar discount, those stocks went on to significantly outperform over the subsequent few years.Exhibit 2:High Quality Stocks vs Russell 1000Source: BlackRock via Financial Times article dated June 25, 2021: Rising Market Uncertainties to Test Investors.Valuation is based on 12 month forward PE for top quintile of quality stocks based on BlackRock metrics and Russell 1000MADISONFUNDS.COMMADISONINVESTMENTS.COM 2
MADISON DIVIDEND INCOMEJune 30, 2021 Separately Managed Account Investment Strategy LetterWe define high-quality objectively by using financial strength ratings from Standard & Poor’s and moat ratings fromMorningstar. At the end of the quarter, 80% (or 35 out of 44) of portfolio holdings were rated A- or better by S&Pcompared to 32% (or 141 out of 443*) for the S&P 500 Index and 21% (or 134 out of 643*) for the Russell 1000Value Index.4 All portfolio holdings were investment grade rated, which is a BBB- rating or better by S&P.For Morningstar Economic Moat Ratings, 70% (or 30 of 44) of portfolio holdings were rated wide moat byMorningstar compared to 25%, or 125 out of 358** for the S&P 500 Index and 16%, or 111 out of 410** for theRussell 1000 Value Index.4 The portfolio also had an above-market dividend yield of 2.3%, which was higher thanthe S&P 500 Index dividend yield of 1.35% and the 10-year Treasury yield of 1.45%. For investors that want ahigh-quality portfolio with above-average dividend yield, we believe now is a good time to invest in those stocks.Rated A- or Better byStandard & Poor's# of HoldingsMadison Dividend Income80%35 out of 44S&P 500 Index32%141 out of 443*Russell 1000 Value Index21%134 out of 643*Rated Wide Moat byMorningstar# of HoldingsMadison Dividend Income70%30 out of 44S&P 500 Index25%125 out of 358**Russell 1000 Value Index16%111 out of 410**Source: Factset, Morninstar, as of 6/30/2021.*Among the companies in the index with ratings by S&P. Not every index constituent has an S&P rating, and these statistics onlyinclude companies with ratings.**Among the companies in the index with moat ratings by Morningstar. Not every index constituent has a Morningstar moatrating, and these statistics only include companies with ratings.OUR APPROACH TO INVESTING – REL ATIVE YIELD STRATEGYThe Madison Dividend Income goal is to achieve long-term outperformance over a full market cycle while takingbelow average risk. To pursue this objective, we employ a relative yield strategy where we buy stocks that have adividend yield at least 1.1x the S&P 500. Relative yield is defined as a stock’s dividend yield divided by the marketdividend yield. An attractive relative yield candidate is a stock with a relative yield near the high end of its historicalrange and a long dividend paying history with a consistent record of dividend increases. Once we identify highrelative yield stocks, we then analyze a company’s business model, balance sheet and cash flow profile to assess itsability to continue paying dividends. We want to find stocks that have low valuations with potential for valuationmultiple expansion, while avoiding stocks that may have high dividend yields but face secular challenges.This quarter we are highlighting Aflac (AFL) as a relative yield example in the Financial sector. AFL is a leadingprovider of life and supplemental medical insurance in Japan and the U.S. AFL products offer financial protectionagainst loss of income for policy holders based on qualifying health events. Aflac Japan generates approximately70% of total revenues, and the company has dominant market share in Japan. In the U.S., AFL provides voluntary4. Financial strength and moat ratings data is not aggregated for the Lipper Equity Income peer group. The Morningstar Economic MoatRating represents a company’s sustainable competitive advantage. Morningstar has identified five sources of economic moats: intangibleassets, switching costs, network effect, cost advantage, and efficient scale.MADISONFUNDS.COMMADISONINVESTMENTS.COM 3
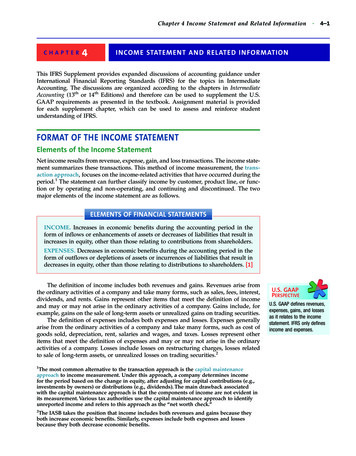
MADISON DIVIDEND INCOMEJune 30, 2021 Separately Managed Account Investment Strategy Letterinsurance for policy holders at businesses with products sold through payroll deduction by its large sales force whichsells primarily through face-to-face interactions. We believe AFL’s dominant market position in Japan and its largeU.S. sales force create a sustainable competitive advantage for the company.Our thesis on AFL is that its sales will recover from the impact of the COVID pandemic, and it will returnsignificant amount of capital to shareholders. Sales were negatively impacted in both Japan and the U.S. but appearto be in early stages of recovering. We believe sales will improve further as economies open and new products areintroduced in Japan. In the U.S., agents will be able to return to face-to-face interactions as people get vaccinated,something that was restricted last year.In terms of capital returns, AFL committed to returning 8-9 billion between 2020-2022, which is expected tobe 75% of operating earnings. The company returns capital via share buybacks and dividend increases. AFL is aDividend Aristocrat5 that has increased its dividend 39 years in a row including 10% annually over the last five years;it also recently announced an 18% dividend increase. Other favorable attributes include an A- rated balance sheet byStandard and Poor’s and an attractive valuation with a relative yield near the high end of its historical range.Dividend Yield and Relative Dividend Yield History for Aflac (AFL)Dividend Yield (%)Dividend Yield Relative to S&P 500 (%)Source:FactSetWe believe its valuation is cheap with its forward expected Price/Earnings (P/E) ratio just 9x and a relative P/E of0.4x versus the S&P 500 despite an industry leading return on equity. At the time of purchase, AFL had a dividendyield of 2.5% and its relative dividend yield vs. the S&P 500 was 1.8x, as shown. Some risks to the thesis include aprolonged economic downturn, loss of market share due to unsuccessful new product roll outs and potential lossesin its investment portfolio.Thank you for your continued trust and your investment.MADISONFUNDS.COMMADISONINVESTMENTS.COM 4
MADISON DIVIDEND INCOMEJune 30, 2021 Separately Managed Account InvestmentLetterPerformanceStrategy& CharacteristicsPortfolio Characteristics may help you understand how the portfolio, taken as a whole, is situated relative to other portfolios or thebenchmark. See the Definitions section on the last page for more details about each metric presented below.Sector Distribution (%)Portfolio ndIncome1S&P500 IndexRussell1000 Value44505842Communication Services7.0211.148.20 152.4B 542.8B 152.7BConsumer Discretionary8.0312.285.98Dividend yield2.33%1.35%1.87%Consumer Staples10.245.867.20Turnover 821.53Health ation Technology13.4027.4210.58Materials5.372.603.79Real -Number of holdingsWeighted avg. market capMadison vs. S&P 500 Index (%)5-Year Up Capture Ratio85.495-Year Down Capture Ratio87.71Active Share83.61Madison vs. Russell 1000 Value Index (%)5-Year Up Capture Ratio94.685-Year Down Capture Ratio74.285-Year Risk/RewardActive Share80.28Please Note: Actual management fees willvary depending on each individual agreement.See footnote on the following page for moreinformation.S&P 500 RussellIndex1000 ValueMadison GrossMadison Net**S&P 500Russell 1000 ValueLipper Equity IncomeAnnualized(%)Annualized ReturnReturn StandardDeviation(%)(%)Gross Return8 .I9E7N1 C. 7E1 3D5R I V MDAI SDOI NIN5 5 O8 8SCE ,AMSONV, EWS IT 5M3E7N1 1T S . C O MMADISONFUNDS.COM888.971.7135Net ReturnMADISONINVESTMENTS.COM 1 5MADISONINVESTMENTS . C O M 071221PERDIVNW-
MADISON DIVIDEND INCOMEJune 30, 2021 Separately Managed Account InvestmentLetterPerformanceStrategy& CharacteristicsPortfolio Performance may help you understand how the portfolio, taken as a whole, is situated relative to other portfolios or thebenchmark. See the Definitions section contained in these materials for more details about each metric presented below.Trailing Returns (%)Experienced ManagementMADISONS&P 500 RussellLipperIndex 1000 Value .6511.8712.06Since Inception*14.1613.2615.9412.8412.07John Brown, CFAPortfolio ManagerIndustry since 1983Drew Justman, CFAPortfolio ManagerIndustry since 2001*Figures are annualized.Annual Total Returns (%)MADISONLipperS&P 500 RussellIndex 1000 Value 7.0218.402.804.58**Net returns are calculated using the highest Madison annual fee of 0.80%, calculated quarterly. They do notreflect any third-party investment advisory fees or other expenses that may be incurred in the management of theaccount. Such fees and expenses will reduce the actual returns of the account. Actual fees and expenses will varydepending on each individual agreement, so readers should consult their advisors for additional details. See eachentity’s Part 2A Disclosure Brochure for more information. Actual returns may vary depending on a particular account’s inception date, trading platform and trading discretion. Any differences in the timing of tradesmay result in various performance outcomes for Madison’s separately managed accounts versus model manageraccounts.8 .I9E7N1 C. 7E1 3D5R I V MDAI SDOI NIN5 5 O8 8SCE ,AMSONV, EWS IT 5M3E7N1 1T S . C O M 2 6M A D I S O N I N V E S T M E N T SPERDIVNW. C O M 071221
MIASDDEI SV I&DEI NI TCIOOMDC ILSOOSNURDNEDFINNESJune30, 2021 SeparatelyManagedStrategyLetter1.Informationis basedon a model portfoliowhich Accountis intended toInvestmentprovide a generalillustrationof the investment strategy. Individual clientportfolios in the program may vary.All or some of the information is presented as “supplemental information” included as part of the GIPS compliant performance presentationfor the Madison Dividend Income Composite on the following page, which must be included with this material Unless otherwise noted,references to “Madison” are to that composite and references to inception date refer to performance since 10/31/2011. Past performance isno guarantee of future results. Year-to-date, quarterly and annualized performance figures are considered "preliminary" as of the date of thispiece. GIPS is a registered trademark of CFA Institute. CFA Institute does not endorse or promote this organization, nor does it warrant theaccuracy or quality of the content contained herein.Indices are unmanaged. An investor cannot invest directly in an index. They are shown for illustrative purposes only, and do not represent theperformance of any specific investment. Index returns do not include any expenses, fees or sales charges, which would lower performance.The S&P 500 Index is an unmanaged index of large companies and is widely regarded as a standard for measuring large-cap and mid-capU.S. stock-market performance. Results assume the reinvestment of all capital gain and dividend distributions. An investment cannot bemade directly into an indexThe Russell 1000 Value (R1000V) index measures the performance of the Russell 1000’s value segment, which is defined to include firmswhose share prices have lower price/ to/book ratios and lower expected long/term mean earnings growth rates. Russell Investment Groupis the source and owner of the trademarks, service marks and copyrights related to the Russell Indexes. Russell is a trademark of RussellInvestment Group.2. The Lipper Equity Income Fund Index (Lipper) tracks funds that seek relatively high current income and growth of income by investing atleast 65% of their portfolio in dividend-paying equity securities.RiskAll investing involves risks including the possible loss of principal. There can be no assurance the portfolios will achieve their investmentobjectives. The portfolios may invest in equities which are subject to market volatility. Equity risk is the risk that securities held by theportfolio will fluctuate in value due to general market or economic conditions, perceptions regarding the industries in which the issuers ofsecurities held by the portfolio participate, and the particular circumstances and performance of particular companies whose securities theportfolio holds. In addition, while broad market measures of common stocks have historically generated higher average returns than fixedincome securities, common stocks have also experienced significantly more volatility in those returns.Please consult with your financial advisor to determine your risk tolerance and investment objectives.It should not be assumed that recommendations made in the future will be profitable or will equal the performance of the securities in thislist.DefinitionsHoldings may vary depending on account inception date, objective, cash flows, market volatility, and other variables. Any securitiesidentified and described herein do not represent all of the securities purchased or sold, and these securities may not be purchased for a newaccount. There is no guarantee that any securities transactions identified and described herein were, or will be profitable. Any securitiesidentified and described herein are not a recommendation to buy or sell, and is not a solicitation for brokerage services.Upon request, Madison may furnish to the client or institution a list of all security recommendations made within the past year.Wtd. Avg. Market Cap: measures the size of the companies in which the portfolio invests. Market capitalization is calculated by multiplyingthe number of a company’s shares outstanding by its price per share.Dividend Yield: the portfolio’s weighted average of the underlying portfolio holdings and not the yield of the portfolio.Active Share: the percentage of a portfolio that differs from its benchmark index. Active Share can range from 0% for an index portfolio thatperfectly mirrors its benchmark to 100% for a portfolio with no overlap with an index.Portfolio Turnover: a measure of the trading activity in an investment portfolio—how often securities are bought and sold by a portfolio. Therange represents the typical turnover of the portfolio.Standard Deviation: a statistical measurement of dispersion about an average, which, for a portfolio, depicts how widely the returns variedover a certain period of time. Investors may use the standard deviation of historical performance to understand the range of returns for aportfolio. When a portfolio has a higher standard deviation than its benchmark, it implies higher relative volatility. Standard deviation hasbeen calculated using the trailing monthly total returns for the appropriate time period. The standard deviation values are annualized and arecalculated using gross of fee performance only.Downside Capture Ratio: a portfolio’s performance in down markets relative to its benchmark. The security’s downside capture return isdivided it by the benchmark’s downside capture return over the time period.Upside Capture Ratio: a portfolio’s performance in up markets relative to its benchmark. The security’s upside capture return is divided by thebenchmark’s upside capture return over the time period.“Madison” and/or “Madison Investments” is the unifying tradename of Madison Investment Holdings, Inc., Madison Asset Management,LLC (“MAM”), and Madison Investment Advisors, LLC (“MIA”), which also includes the Madison Scottsdale office. MAM and MIA areregistered as investment advisers with the U.S. Securities and Exchange Commission. Madison Funds are distributed by MFD Distributor,LLC. MFD Distributor, LLC is registered with the U.S. Securities and Exchange Commission as a broker-dealer and is a member firm of theFinancial Industry Regulatory Authority. The home office for each firm listed above is 550 Science Drive, Madison, WI 53711. Madison’stoll-free number is 800-767-0300.Any performance data shown represents past performance. Past performance is no guarantee of future results.Non-deposit investment products are not federally insured, involve investment risk, may lose value and are not obligations of, or guaranteedby, any financial institution. Investment returns and principal value will fluctuate.This report is for informational purposes only and is not intended as an offer or solicitation with respect to the purchase or sale of anysecurity.8 .I9E7N1 C. 7E1 3D5R I V MDAI SDOI NIN5 5 O8 8SCE ,AMSONV, EWS IT 5M3E7N1 1T S . C O M 37M A D I S O N I N V E S T M E N T SPERDIVNW. C O M 071221
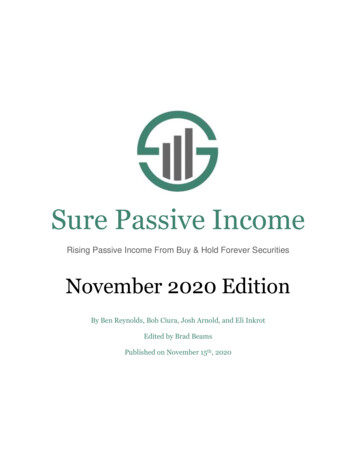
DIVIDEND INCOME MODEL - Transactions vs. S&P 5003/31/2021 to 6/30/2021AverageTop Contributors to ReturnWeight (%)Nucor Corporation4.20BlackRock, Inc.3.97Northern Trust Corporation3.21American Tower Corporation1.74Analog Devices, Inc.2.01Contribution toRelative Return (%)0.520.260.070.060.04Bottom ContributorsCaterpillar Inc.Verizon Communications Inc.Travelers Companies, Inc.Dominion Energy IncCVS Health CorporationAverageWeight (%)2.323.183.291.971.24Contribution toRelative Return (%)-0.29-0.28-0.25-0.20-0.20MIASDI NI TCIODC ILSOOSNU RDEI SV I&D EDNEDFINOMNESJune30, 2021 nis basedon a model portfoliowhich isintended toInvestmentprovide a generalillustrationof the investment strategy. Individual clientportfolios in the program may vary.DIVIDENDMODEL - Transactionsvs. Russell1000 ValueAllor some INCOMEof the informationis presentedas “supplementalinformation” included as part of the GIPS compliant performance presentation3/31/2021to 6/30/2021forthe MadisonDividend Income Composite on the following page, which must be included with this material Unless otherwise noted,Contribution toContribution toAverageAveragereferencesto “Madison”date referto performance since 10/31/2011.Past performanceisTop Contributorsto Return are to that composite and references to inceptionBottomContributorsReturn (%) performance figures are considered "preliminary"Return(%)Weight(%) RelativeWeight (%)no guarantee of future results. Year-to-date,quarterlyand annualizedas of Relativethe dateof thisNucor GIPS Corporation4.20Institute. CFA0.63Institute doesCaterpillarInc.2.33nor does it warrant-0.21piece.is a registered trademark of CFAnot endorseor promote this organization,theBlackRock,orInc.0.35Verizon Communications Inc.3.18-0.16accuracyquality of the content contained3.97herein.Northern Trust Corporation3.210.17Travelers Companies, Inc.3.29-0.15Indicesare unmanaged. An investor cannot 1.73invest directly inan index. Theyare shown for illustrative purposes only,1.23and do not representtheAmerican Tower Corporation0.14CVS Health arges,whichwouldlowerperformance.Analog Devices, Inc.2.010.10Dominion Energy Inc1.97-0.12The S&P 500 Index is an unmanaged index of large companies and is widely regarded as a standard for measuring large-cap and mid-capU.S. stock-market performance. Results assume the reinvestment of all capital gain and dividend distributions. An investment cannot bemade directly into an indexAlthoughtheinformationin this reporthas been obtainedfrom sourcesthat the firmbelievesbe reliable,weisdonot guaranteeits firmsTheRusselland1000 (R1000V)indexthe performanceof the1000’svalueintosegment,whichdefinedto includeaccuracy,anyValuesuch lowerinformationmay measuresbe incompleteor condensed.All Russellopinionsincludedthisreportconstitutethe rates.RussellInvestmentGroupthesourcedate ofthisreportandare subject t tois forinformationalpurposesonlyandis not intendedas ussellIndexes.Russell isatrademarkofRusselloffer or solicitationInvestmentGroup. with respect to the purchase or sale of any security.is notintendedto Fundprovideinvestmentadvice directlyto investors.Opinionsstated areinformationalonlyofandshouldbe dsthatseek (whetherrelativelyhigh currentincomeand growthincomeby notinvestingtakenas investmentrecommendationor adviceof tracksanysecurities.kindwhatsoeverimpartialor otherwise).least65%of their portfolioin dividend-payingequityGross performance results do not reflect the deduction of investment advisory fees. Your returns will be reduced by advisory fees and otherexpenses that may be incurred in the management of your investment advisory account. Investment advisory fees are described in ourRiskdisclosureAllinvestingbrochure.involves risks including the possible loss of principal. There can be no assurance the portfolios will achieve their investmentOur expectationis that investorswillinparticipatein marketappreciationduringbull marketsand isbetheprotectedbearheldmarketsobjectives.The portfoliosmay investequities whichare subjectto marketvolatility.Equity riskrisk thatduringsecuritiesby thecomparedwithinvestorsin portfoliosholdingmarketmore speculativeandvolatile securities.Thereis no assurancethat theseexpectationswillofbeportfoliowillfluctuatein valuedue to generalor economicconditions,perceptionsregardingthe industriesin whichthe issuersrealized. held by the portfolio participate, and the particular circumstances and performance of particular companies whose securities thesecuritiesportfolio holds. In addition, while broad market measures of common stocks have historically generated higher average returns than fixedincomesecurities,volatilityin those returns.The LipperEquitycommonIncome stocksFundshaveIndexalsois aexperiencedtotal returnsignificantlyindex that ismoreutilizedas a comparisonbenchmark for all returns-based data andPleaseconsultwith yourfinancialto determineyour risk r advisorthe strategys,which compriseindex,andare notprovidedobjectives.by Thompson Reuters Corporation. Therefore,are madewherever applicable,on dataItbenchmarkshould not comparisonsbe assumed thatrecommendationsmade inbasedthe futurewillavailability.be profitable or will equal the performance of the securities in thislist. 2021 Morningstar, Inc. All Rights Reserved. The information, as noted as such, contained herein: (1) is proprietary to Morningstar;Definitions(2) may not be copied or distributed; and (3) is not warranted to be accurate, complete or timely. Neither Morningstar nor its contentHoldingsvary dependingon accountinceptiondate, objective,cashflows,volatility,andother variables.Any securitiesprovidersmayare describedresponsiblefor anyor lossesarisingfrom anypurchaseduse eofforfutureidentifiedandhereindodamagesnot representall ofthe securitiessold, and thesemay isnotnobeguaranteepurchaseda newresults.account. There is no guarantee that any securities transactions identified and described herein were, or will be profitable. Any securitiesidentified and described herein are not a recommendation to buy or sell, and is not a solicitation for brokerage services.5. Therequest,DividendAristocratsare S&Pto500for a stockto be a Dividendare:1) year.A stock must be aUponMadisonmay furnishthe indexclient constituents.or institutionQualificationsa list of all securityrecommendationsmadeAristocratwithin years.Wtd. Avg. Market Cap: measures the size of the companies in which the portfolio invests. Market capitalization is calculated by multiplyingthe number of a company’s shares outstanding by its price per share.Dividend Yield: the portfolio’s weighted average of the underlying portfolio holdings and not the yield of the portfolio.Active Share: the percentage of a portfolio that differs from its benchmark index. Active Share can range from 0% for an index portfolio thatperfectly mirrors its benchmark to 100% for a portfolio with no overlap with an index.Portfolio Turnover: a measure of the trading activity in an investment portfolio—how often securities are bought and sold by a portfolio. Therange represents the typical turnover of the portfolio.Standard Deviation: a statistical measurement of dispersion about an average, which, for a portfolio, depicts how widely the returns variedover a certain period of time. Investors may use the standard deviation of historical performance to understand the range of returns for aportfolio. When a portfolio has a higher standard deviation than its benchmark, it implies higher relative volatility. Standard deviation hasbeen calculated using the trailing monthly total returns for the appropriate time period. The standard deviation values are annualized and arecalculated using gross of fee performance only.Downside Capture Ratio: a portfolio’s performance in down markets relative to its benchmark. The security’s downside capture return isdivided it by the benchmark’s downside capture return over the time period.Upside Capture Ratio: a portfolio’s p
Source: BlackRock via Financial Times article dated June 25, 2021: Rising Market Uncertainties to Test Investors. Valuation is based on 12 month forward PE for top quintile of quality stocks based on BlackRock metrics and Russell 1000 Exhibit 2: High Quality Stocks vs Russell 1000.