Transcription
Sure Passive IncomeRising Passive Income From Buy & Hold Forever SecuritiesNovember 2020 EditionBy Ben Reynolds, Bob Ciura, Josh Arnold, and Eli InkrotEdited by Brad BeamsPublished on November 15th, 2020
2Table of ContentsOpening Thoughts - What Part Does Value Play In Buy & Hold Forever Investing? - . 3Sure Passive Income Top 10 - November 2020 . 4Analysis of Top 10 Securities . 5National Fuel Gas Co. (NFG) . 5General Dynamics Corp. (GD) . 8Hormel Foods Corp. (HRL) . 11Amgen Inc. (AMGN) . 14The Travelers Companies Inc. (TRV) . 17The Coca-Cola Co. (KO) . 20The Home Depot Inc. (HD) . 23Comcast Corp. (CMCSA) . 26The J.M. Smucker Co. (SJM) . 29American Tower Corp. (AMT) . 32Closing Thoughts - The ‘Aha’ Moment With Forever Rising Passive Income Investing - . 35Buying & Ranking Criteria . 36Portfolio Building Guide . 37Examples . 37Past Recommendations & Performance . 38List of Securities by Dividend Risk Score . 39
Opening Thoughts- What Part Does Value Play In Buy & HoldForever Investing? -3When you buy a security to hold for the long run, does valuation matter?The short answer is yes, valuation always matters for fundamental investors. But with that said,valuation does not matter as much for the truly long-term buy and hold investor.The value investing strategy is based around the idea of buying a dollar bill for only three quarters;paying less than what a security is ‘intrinsically’ worth. One then sells the security as it approachesits intrinsic value. There’s no reason to hold a security that was purchased because it was cheapafter it is no longer cheap.Value investing ultimately relies on perception. Negative perceptions about a security create adiscount to intrinsic value. When perceptions shift, valuation multiples rise.Long-term buy and hold investing is less reliant on value. Returns come from dividends andgrowth – from the strength of the operating business itself – and not from changes in the perceptionof the business.However, the entry price does matter for a buy and hold investment. Imagine a stock that pays a 2per share dividend. We’d much rather own that stock at 50 per share than 100. That’s thedifference between a 2% starting yield and a 4% starting yield.Valuation matters to the long-term buy and hold investor who is investing for rising passive incomebecause, in part, it determines the starting yield the investor receives. Note that this is differentthan attempting to arbitrage perception surrounding a security as is done in traditional valueinvesting.Starting with this edition of The Sure Passive Income Newsletter and going forward, we areinstituting a screen that requires any recommended security to be trading at equal to or greater thanits 10-year historical average dividend yield. This is in addition to the security trading at or abovethe S&P 500’s dividend yield.A dividend yield screen is also in line with the feedback we received on the inaugural edition ofThe Sure Passive Income Newsletter regarding having more consideration towards price/value.This screen means we will always be buying into quality dividend growth securities at ‘fair orbetter prices’ from a dividend yield perspective. Our recommendations in The Sure Passive IncomeNewsletter will still not be focused on traditional value investing metrics, but they will have anelement of timeliness in them as we take care to buy into securities that are trading at or above theirhistorical dividend yield.At the same time, this means we won’t be recommending securities trading below their 10-yearhistorical average dividend yield. This has the effect of preventing recommendations for securitiesthat have seen their share price appreciate much faster than their dividend over the last severalyears.The goal of The Sure Passive Income Newsletter remains the same; to practice buy and hold foreverinvesting into high-quality dividend growth securities for rising passive income over time. Pleasekeep reading to see this month’s Top 10 analyzed in detail.
4Sure Passive Income Top 10 - November 2020Name & TickerNational Fuel Gas (NFG)General Dynamics (GD)Hormel Foods (HRL)Amgen (AMGN)Travelers (TRV)Coca-Cola (KO)Home Depot (HD)Comcast (CMCSA)J.M. Smucker (SJM)American Tower (AMT)Div.RiskScoreAAABBBBBBBStockPrice 41 149 52 237 132 53 274 48 120 240# .0%8.0%7.5%7.0%7.0%5.0%6.0%Exp.Growth Div. otes: Data for the table above is from a spreadsheet during the past week of our Sure Analysis ResearchDatabase and general data over the same week. ‘Div.’ stands for ‘Dividend.’ ‘# Years Div. Increases’shows the consecutive years of dividend growth. ‘Payout Ratio’ is calculated using expected currentfiscal year adjusted earnings-per-share. ‘Exp. Growth’ means expected annualized growth rate over thenext five years.Disclosures: Ben Reynolds is long AMGN, & TRV from this month’s Top 10.We added a new screen to this month’s edition of The Sure Passive Income Newsletter that requiressecurities in the Top 10 be trading for equal to or greater than their historical 10-year average dividendyield at the time rankings were done. As a result, 9 out of this month’s Top 10 are newrecommendations. Coca-Cola (KO) is the lone exception.An equally weighted portfolio of the Top 10 has the following future expected total return estimatecharacteristics:Dividend Yield:Growth Rate:Payout Ratio:2.7%6.7%52%Note: Data for this newsletter was obtained between 11/9/20 and 11/13/20.
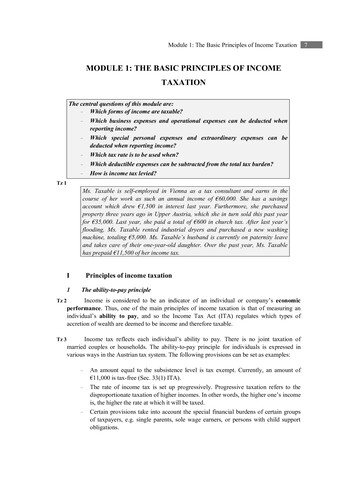
5Analysis of Top 10 SecuritiesNational Fuel Gas Co. (NFG)Overview & Current EventsNational Fuel Gas is a diversified energy company with upstream, midstream, and downstreamoperations. The company’s upstream assets located in the Marcellus and Utica shale formations haveproduction capacity of 800 million cubic feet of gas per day. Upstream represents approximately 42%of the company’s annual earnings before interest, taxes, depreciation, and amortization (EBITDA).Meanwhile, the midstream operations include pipeline infrastructure, and represent 37% of companyEBITDA. Finally, NFG’s downstream utility segment provides utility services to over 740,000customers and represents 21% of total EBITDA.In November, National Fuel Gas reported financial results for the fourth fiscal quarter and full fiscalyear. Adjusted earnings-per-share of 0.40 for the quarter were a 26% year-over-year decline, dueprimarily to weak commodity prices that impacted the company’s E&P segment. Partially offsettingdeclining oil and gas prices was a 14% increase in production, fueled by the recent acquisition ofupstream assets. Adjusted EBITDA increased 1.5% year-over-year.SafetyNational Fuel Gas’ competitive advantage is its combination of regulated and stable businesses(pipelines and utilities) with cyclical and potentially higher-growth sectors (exploration & production).This allows the company to endure difficult operating environments and downturns, such as thecoronavirus pandemic, with less difficulty than its peers which focus exclusively on more cyclical areasof energy.Despite operating in the highly cyclical and economically sensitive energy industry, National Fuel Gasperformed very well during the Great Recession. Earnings-per-share increased 10% from 2007-2009,with continued growth in the years after. This recession resilience has allowed the company to increaseits dividend for 50 consecutive years.Growth ProspectsWe expect 6% annual earnings-per-share growth over the next five years. Higher commodity priceswould be a meaningful boost, but even in the current environment we believe National Fuel Gas canproduce modest growth. The recent acquisition of Shell’s integrated upstream and midstream assets inPennsylvania for 541 million is expected to boost natural gas production by 215 million to 230million cubic feet per day. The company also raised fiscal 2021 guidance, and now expects a moremeaningful recovery next year with adjusted earnings-per-share in a range of 3.55 to 3.85.National Fuel Gas has increased its dividend for 50 consecutive years, which makes it a DividendKing. Continued dividend growth is very likely, due to the company’s durable competitive advantagesand diversified business model.Key Statistics, Ratios, & MetricsYears of Dividend Increases:Dividend Yield:Dividend Risk Score:504.4%A5-Year Growth Estimate:Most Recent Dividend Increase:Stock Price:Return to Top 10 List6.0%2.3% 41
6Income Statement MetricsYearRevenueGross ProfitGross MarginOperating ProfitOperating MarginNet ProfitNet MarginFree Cash FlowIncome 0%29914.2%(5)190201520161,761 1,4521,075 1,05561.0% 72.6%51553229.3% 36.6%(379)(291)-21.5% (1.09)2020-1.8%-6.0%-2.8%88.017.58(5.47)Balance Sheet MetricsYearTotal AssetsCash & EquivalentsAccounts ReceivableInventoriesGoodwill & Int. Ass.Total LiabilitiesAccounts PayableLong-Term DebtShareholder’s EquityD/E ity & Per Share MetricsYearReturn on AssetsReturn on EquityROICShares 6)20152016-5.7% -4.8%-17.1% -16.4%-9.2% -7.5%84.685.120.87 17.12(1.95)0.0920174.8%17.5%7.4%85.518.372.72Note: All figures in millions of U.S. Dollars unless per share or indicated otherwise.Return to Top 10 List
7Return to Top 10 List
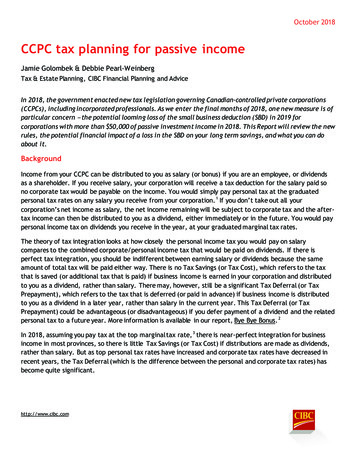
8General Dynamics Corp. (GD)Overview & Current EventsGeneral Dynamics is an aerospace & defense company that operates five business segments:Aerospace (23% of sales), Combat Systems (17%), Marine Systems (23%), Information Technology(23%), and Mission Systems (13%). The company’s Aerospace segment is focused on business jetsand services while the remainder of the company is defense. The company makes the well-known M1Abrams tank, Stryker vehicle, Virginia-class submarine, Columbia-class submarine, and Gulfstreambusiness jets. General Dynamics had revenue of nearly 40 billion last year.The company reported third-quarter results on October 28th. Total revenue declined 3.4% year-overyear, while diluted earnings-per-share declined 7.6%. Declines resulted from weakness in Aerospace,Information Technology, and Mission Systems. But, net debt is also declining and is now 3.2% lowerthan last quarter at 11.9 billion. New orders have strengthened, and the total backlog now stands at 81.5 billion, up 21% from the same quarter last year. Revenue increased 3.5% for Combat Systemsand 7.6% for Marine Systems. Information Technology revenue declined 2% while Mission Systemswas flat for the quarter.SafetyGeneral Dynamics is an entrenched military prime contractor. It has ground and marine platforms thatserve as the backbone for the U.S. Army, U.S. Navy and militaries around the world. This leads to acompetitive advantage as these platforms have decades-long life cycles and General Dynamics hasexpertise and experience to perform sustainment and modernization.These characteristics lead to a good degree of recession resistance. For example, from 2008-2010during the Great Recession, General Dynamics increased its earnings-per-share by 11%. GeneralDynamics also has a secure payout ratio at just 40% of expected fiscal 2020 adjusted earnings-pershare.Growth ProspectsWe expect 6% annual earnings-per-share growth over the next five years. This earnings-per-sharegrowth will be achieved through a combination of rising revenue as well as share repurchases. GeneralDynamics’ top and bottom lines have grown due to increasing U.S. defense spending and internationalsales. The business jet market is being negatively impacted in the near-term due to COVID-19 andtravel restrictions, but defense remains a much bigger portion of General Dynamics’ revenue andearnings. General Dynamics has established naval and ground platforms that support maintenance andmodernization contracts, as well as future prime contract wins.General Dynamics has increased its dividend for 28 consecutive years, which makes it a DividendAristocrat. Continued dividend growth is very likely due to the company’s durable competitiveadvantages and market leadership. We expect 8% compound annual dividend growth through 2025.Key Statistics, Ratios, & MetricsYears of Dividend Increases:Dividend Yield:Dividend Risk Score:283.0%A5-Year Growth Estimate:Most Recent Dividend Increase:Stock Price:Return to Top 10 List6.0%7.8% 149
9Income Statement MetricsYearRevenueGross ProfitGross MarginSG&A Exp.D&A Exp.Operating ProfitOp. MarginNet ProfitNet MarginFree Cash FlowIncome alance Sheet MetricsYearTotal AssetsCash & EquivalentsAcc. ReceivableInventoriesGoodwill & Int.Total LiabilitiesAccounts PayableLong-Term DebtTotal EquityD/E 54463062199235264316211930135770.88Profitability & Per Share MetricsYear201020112012201320142015Return on Assets8.2%7.5%-1.0%6.8%7.2%9.0%Return on Equity20.4% 19.0% -2.7% 18.2% 19.2% 26.9%ROIC16.0% 15.0% -2.0% 14.0% 14.8% 20.3%Shares Out.372356354353332311Revenue/Share84.2888.91 87.71 87.50 90.39 97.29FCF/Share6.797.566.147.579.696.24Note: All figures in millions of U.S. Dollars unless per share or indicated otherwise.Return to Top 10 26.8% 28.9%19.7% 16.9%297289101.67 120.9811.328.2220197.4%27.5%14.0%290135.36.86
10Note: General Dynamics has paid large special dividends in the past, two of which are truncated in this image for better readability of thenormal quartlerly dividend.Return to Top 10 List
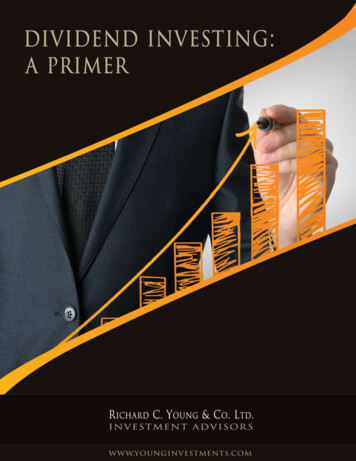
11Hormel Foods Corp. (HRL)Overview & Current EventsHormel Foods is a leader in the packaged and processed food products industry. The company wasfounded in 1891, so its operating history is long and storied. While it has acquired and divested manydifferent businesses since its founding, it has also kept to its core business of processed meat products,and its robust distribution chain. Hormel sells in more than 80 countries around the world, although itscore business is still centered in the U.S., and it produces about 10 billion in annual revenue. Thestock currently trades with a market capitalization of 28 billion, very near its all-time high set earlierthis year. Hormel is also a member of the prestigious Dividend Kings, having increased its dividendfor more than 50 consecutive years.Hormel reported third-quarter earnings on August 25th, and results were roughly in line withexpectations. Volumes were up 4% in Q3, as organic volume led the way with a solid 3% gain.Pricing and mix were lower, however, so organic revenue was up 2%.Grocery Products revenue was up 7% to 581 million, Refrigerated Foods revenue rose 5% to 1.36billion, Jennie-O was down 4% to 287 million, and the International segment was up 2% to 151million. Net retail sales in the U.S. were up 19%, but that was offset by a 19% decline in foodservicerevenue, as many restaurants remain shut.Operating margin declined year-over-year to 10.5% of revenue, and earnings-per-share was 37 cents,flat from the year-ago period. We continue to expect 1.65 in earnings-per-share for this yearfollowing Q3 results.SafetyHormel’s competitive advantage is that it has built a portfolio of nearly 40 products that are either firstor second in terms of market share in their respective categories. This sort of widespread marketdominance is difficult to come by in any industry, and the reason for this is that Hormel is highlyentrenched among consumers.Hormel has proven to be resistant to recessions as well, as its products offer good value and long shelflives to consumers. Hormel grew earnings during the Great Recession and is also weathering the stormin 2020 quite well. Hormel’s payout ratio has grown considerably in recent years thanks to robustdividend increases. However, we continue to see the dividend as very safe given the company’s stableearnings, and payout ratio of just 56%.Growth ProspectsHormel managed to grow its earnings-per-share in 7 out of the last 9 full fiscal years. We see 6%annual growth from 2020 levels as Hormel grows revenue and margins though organic and acquisitiondriven growth.Key Statistics, Ratios, & MetricsYears of Dividend Increases:Dividend Yield:Dividend Risk Score:541.8%A5-Year Growth Estimate:Most Recent Dividend Increase:Stock Price:Return to Top 10 List6.0%10.7% 52
12Income Statement MetricsYearRevenueGross ProfitGross MarginSG&A Exp.D&A Exp.Operating ProfitOperating MarginNet ProfitNet MarginFree Cash FlowIncome nce Sheet MetricsYearTotal AssetsCash & EquivalentsAccounts ReceivableInventoriesGoodwill & Int. Ass.Total LiabilitiesAccounts PayableLong-Term DebtShareholder’s EquityD/E 1561403476069932527213849543539980.11Profitability & Per Share MetricsYearReturn on AssetsReturn on EquityROICShares 52717.121.57Note: All figures in millions of U.S. Dollars unless per share or indicated otherwise.Return to Top 10 List201614.2%21.1%19.5%52817.561.45
13Return to Top 10 List
14Amgen Inc. (AMGN)Overview & Current EventsAmgen is the largest independent biotech company in the world. Amgen discovers, develops,manufactures, and sells medicines that treat serious illnesses. The company focuses on six therapeuticareas: cardiovascular disease, oncology, bone health, neuroscience, nephrology, and inflammation.Amgen announced earnings results for the third quarter on 10/28/20. Revenue increased 12% to 6.4billion, while adjusted earnings-per-share (EPS) increased 19.4% to 4.37. Revenue and EPS both beatconsensus estimates. The company had volume growth of 18%, which was partially offset by lowernet selling prices. Sales for Enbrel, which treats rheumatoid arthritis and remains Amgen’s topgrossing product, were down 3%. Enbrel lost market share in the quarter and was also impacted bylower growth in the rheumatology sector as a whole due to COVID-19. Offsetting this decline was thebone health drug, Prolia, which grew sales by 11%, due mostly to volume gains.The company also revised its guidance for the year, by narrowing its revenue forecast but raising itsearnings forecast. Amgen expects revenue of 25.1 billion to 25.5 billion, from 25 billion to 25.6billion previously. Adjusted EPS is now expected in a range of 15.80 to 16.15 for 2020, up from 15.10 to 15.75 previously.SafetyAmgen’s competitive advantages include its strong pharmaceutical assets as well as its robust pipeline.Amgen spent 18.1% of its 2019 sales on research and development. As a result, it has a well-stockedpipeline to fuel its future growth. The company has also demonstrated resilience during recessions, aspeople will seek treatment for their health issues regardless of economic conditions. The company alsohas a reasonably low payout ratio of 40% expected for 2020, which will allow it to continue to raise itsdividend going forward, even in a prolonged recession.Growth ProspectsWe expect 9% annual earnings-per-share growth over the next five years for Amgen. This earningsper-share growth will be achieved through a combination of rising revenue as well as sharerepurchases. While Amgen is struggling with falling sales for legacy products such as Neulasta andEnbrel, new products are generating growth for Amgen. For example, Repatha, which is used tocontrol cholesterol, grew sales by 22% in large part from a 60% increase in volume. Separately,Otezla, which is used to treat inflammatory diseases, generated 11% year-over-year sales growth.Lastly, share buybacks will boost earnings-per-share growth. Amgen repurchased 3 million shares atan average share price of 251 during the third quarter ( 0.5% of shares outstanding), and it still has 4.2 billion remaining on its share repurchase authorization.Key Statistics, Ratios, & MetricsYears of Dividend Increases:Dividend Yield:Dividend Risk Score:102.7%B5-Year Growth Estimate:Most Recent Dividend Increase:Stock Price:Return to Top 10 List9.0%10.3% 237
15Income Statement 22,84923,74723,362Gross ,78019,64619,006Gross %81.4%SG&A ,150D&A ,206Operating 639,674Op. %41.4%Net 47,842Net 33.6%Free Cash 89,150Income Tax6904676641844271,0391,4417,6181,1511,296Balance Sheet 9Total ,95466,41659,707Cash & 06,9456,037Acc. 52,7452,8342,9403,584Goodwill & 7022,14234,116Total 75154,71353,91650,034Accounts rm 4233,92929,903Total ,24112,5009,673D/E tability & Per Share 9Return on Return on %18.2%Shares 02Note: All figures in millions of U.S. Dollars unless per share or indicated otherwise.Return to Top 10 List
16Return to Top 10 List
17The Travelers Companies Inc. (TRV)Overview & Current EventsThe Travelers Companies was founded in 1864 in Connecticut by two businessmen. It began with lifeinsurance and accident insurance but has since expanded into all different kinds of property andcasualty insurance, becoming a leader in the space. Travelers offers protection products for consumers,auto insurance, home insurance, and various types of commercial products. Today, the companyproduces nearly 30 billion in annual revenue, and the stock trades with a market capitalization of 34billion. Travelers is also the only property and casualty insurance provider that is a constituent of theDow Jones Industrial Average.Travelers released its third-quarter earnings report on October 20th, and results were slightly better thanexpected on the top and bottom lines. Core earnings-per-share came to 3.12 in Q3, five cents aboveexpectations. Travelers saw a favorable development on its prior year reserves, higher underlyingunderwriting gains, and higher net investment income. The company once again suffered fromrelatively high catastrophe losses, but it wasn’t enough to offset the good news elsewhere.Net written premiums were up from 7.57 billion to 7.77 billion year-over-year, while the combinedratio fell from 94.1% to 91.5%; combined ratios are expenses including claims divided by premiumrevenue, so the lower, the better.Adjusted book value was 94.89 per share at the end of the period versus 90.09 in the same quarterlast year. We estimate 8.70 in earnings-per-share for 2020 following Q3 results.SafetyTravelers’ primary competitive advantages are its scale and its brand, both of which have been builtsteadily in the past century and a half. Travelers has a globally recognizable brand that stands forstability, and its scale affords it the ability to diversify in different types of products, not onlydiversifying risk away via differing revenue streams, but also allowing for cross-selling to customers,maximizing customer value.Travelers isn’t necessarily susceptible to economic slowdowns, as its policies are tied to specificevents, like catastrophes, rather than economic weakness. This gives Travelers a diversifying attributefor an investor’s portfolio.Travelers’ dividend ranks highly for safety as the payout ratio is just 39% on this year’s earnings. Wesee Travelers as having the capacity to raise the payout for years to come.Growth ProspectsWe expect Travelers to grow at 8% annually in the coming years, primarily from higher underwrittenpremium growth, better margins, and its well-funded buyback program. We note that unforeseencatastrophe losses could temporarily derail our bullish expectations.Key Statistics, Ratios, & MetricsYears of Dividend Increases:Dividend Yield:Dividend Risk Score:152.6%B5-Year Growth Estimate:Most Recent Dividend Increase:Stock Price:Return to Top 10 List8.0%3.7% 132
18Income Statement MetricsYearRevenueSG&A Exp.D&A Exp.Net ProfitNet MarginFree Cash FlowIncome 1436576326228.3%5205516Balance Sheet MetricsYearTotal Assets ( B)Cash & EquivalentsAcc. ReceivableGoodwill & Int.Total LiabilitiesAccounts PayableLong-Term DebtTotal EquityD/E Ratio2010105.6620054973867801814076611254070.2620
The goal of The Sure Passive Income Newsletter remains the same; to practice buy and hold forever investing into high-quality dividend growth securities for rising passive income over time. Please keep reading to see this month’s Top 10 analyzed in detail. 4 Sure Passive