Transcription
Electrical Fatal Incident DataAustralia & New Zealand 2015 - 2016ERAC Nov 2016
Definitions“Consumer Installation”“Distribution or Supply Equipment”“Electrical Fatal Incident”“Electrical Worker”“General Public”“Misuse/Interference”“Non Electrical Worker”“Supply Worker”“Work Practice”means all parts of an electrical installation pastthe point of supply on the consumer side.means equipment used in the generation,transmission, supply or distribution ofelectricity.means any fatal event that results from anelectrical shock, electrical burn or electrical arcburn except if linked to the initial event of anatural disaster, criminal activity or suicide.means a person who carries out electrical workand is licensed or authorised to do so.means a person who is not doing any work aspart of his or her employment or under acontract of work, or training at the time theincident occursmeans to damage, mishandle or use equipmentin a way that it is not intended, or for what it isdesigned.means a person who is in the process ofcarrying out their occupation and is not anelectrical worker.means a person who is employed by anetwork operator.means the process or method by which workis carried out.1
During 2015-16This report covers the 12 month period from 1 July 2015 to 30 June 2016. It is based on details ofincidents reported to electrical safety regulators in Australia and New Zealand.18 electrical deaths from 17 incidents were recorded in Australia and New Zealand in 2015‐16. This isequivalent to 0.63 deaths per million people (dmp) which is 0.2 dmp above the last year.Out of 18 deaths, 16 occurred in Australia and two occurred in New Zealand.There was one distribution network related death causedby an electrical accident.90% (105 of 117) of the number of deaths associated withthe electricity supply network from 2000-01 to 2015-16 (last16 years) involved contact with overhead conductors.17 deaths caused by 16 incidents involving customers’installations, appliances or equipment.Of the people who were electrocuted, 67% (12 of 18) wereeither non-electrical workers, or the general public.2
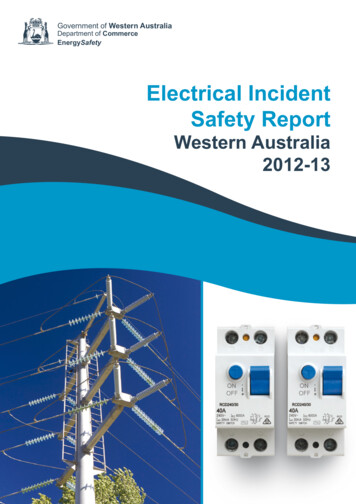
Trend AnalysisElectrical fatality information from the last 16 years (2000-01 to 2015-16 has been analysed for trendsand frequency.The electrical deaths over 16 years continue to show a decrease from an average (three years) of 1.79deaths per million people (dmp) in 2000-01 to 0.50 in 2015-16. An average rate of reduction is 0.08dmp. In Australia, the reduction is from 1.87 to 0.54 (0.083 per year) dmp, while for New Zealand thereduction is from 1.39 to 0.29 (0.069 per year).The most electrical deaths associated with electricity networks are as a result of working on or nearenergised overhead conductors. 89% (104 of 117) of electrical deaths associated with electricity supplynetworks involved overhead conductors.Consumer appliances/equipment were involved in nearly twice (241) the number of deaths than theelectricity supplier assets (117). Also, there was a large variation in the number of deaths involvingconsumer equipment from one year to the next than in deaths involving electrical supplier assets. Thedmp continued to decline over the last 16 years for both consumer and supplier assets.This report presents the information in a series of charts and tables3
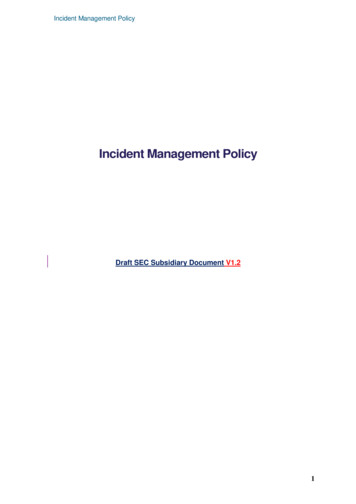
1. Regional FatalitiesGRAPH 1.1Electrical Deaths in Australia and New Zealand – 2015-16GRAPH 1.2Number of Electrical Deaths in Australia and New Zealand4
GRAPH 1.3Electrical Deaths per Million People from 2005-06GRAPH 1.4Trend in Electrical Deaths (Three Year Moving Average per Million People)5
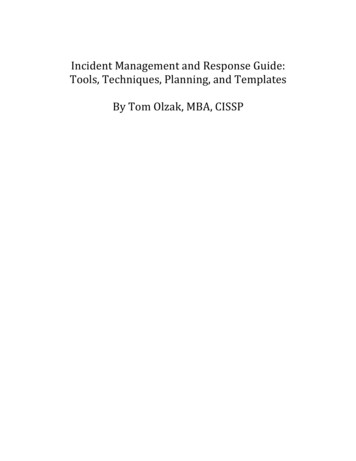
GRAPH 1.5Sensitivity Analysis for Fatality RateGRAPH 1.6Trend in Electrical Deaths (Three Year Moving Average per MillionPopulation) in Australia and New Zealand6
GRAPH 1.7Australia and New Zealand Victims Categories – 2015-16GRAPH 1.8Electrical Deaths: Work Place versus Non-Workplace – 2015-167
GRAPH 1.9 Electrical Deaths Sorted by Victim CategoriesGRAPH 1.10 Trends by Victim Categories with Three Year Moving Average8
GRAPH 1.11 Trends by Asset Type with Three Year Moving Average9
2. Fatalities involving Network AssetsGRAPH 2.1Deaths Involving Electricity Supply Assets Sorted by Victim categories –2015-16GRAPH 2.2 Deaths Involving Electricity Supply Assets: Work Place versus NonWorkplace – 2015-1610
GRAPH 2.3Deaths Involving Electricity Supply Assets Sorted by Asset Types– 2015-16GRAPH 2.4Deaths Involving Electricity Supply Assets by Victim Categories11
GRAPH 2.5Deaths Involving Electricity Supply Assets Sorted by Asset TypesGRAPH 2.6Deaths Involving Electricity Supply Assets: Work Place versus NonWorkplace12
3. Fatalities involving Consumer Installation and EquipmentGRAPH 3.1Deaths Involving Consumer Installations, Appliances or Equipment Sortedby Victim Categories – 2015-16GRAPH 3.2Deaths Involving Consumer Installations or equipment at work placeSorted by Location – 2015-1613
GRAPH 3.3 Contributing factors for Electrical Deaths Involving Consumer's Installationor Equipment – 2015-16GRAPH 3.4Deaths Involving Consumer Installations (Fixed Wiring) or Equipment 2015-1614
4. Fatal Electrical Accidents 39213520362430121628281413121218
5. Summary of ERAC Electrical Fatality Reports 2015-16Legend:ASupply WorkerBElectrical WorkerCNon Electrical WorkerDGeneral PublicELECTRICITY DISTRIBUTOR/SUPPLY AUTHORITY EQUIPMENTACTNSWNTQLDSAABCDABCDABCDABCDABCDOverhead Line00000000000000100000Underground BCDABCDABCDABCDOverhead ground TAL00016010
Legend:ASupply WorkerBElectrical WorkerCNon Electrical WorkerDGeneral PublicCONSUMER INSTALLATION (Installation of Fixed Equipment)ACTNSWNTQLDSAABCDABCDABCDABCDABCDWork practice00000100000000000000Installation FailureFailure Deterioration ofEquipment or se/Interference withEquipment or LTotalABCDABCDABCDABCDABCDWork nstallation FailureFailure Deterioration ofEquipment or Wiring000000100000000000101Misuse/Interference withEquipment or erTOTAL0000023001000200063312TOTAL0511721201
Legend:ASupply WorkerBElectrical WorkerCNon Electrical WorkerDGeneral PublicCONSUMER EQUIPMENT (Appliance or Accessories)ACTNSWNTQLDSAABCDABCDABCDABCDABCDWork practice00000000000000000000Installation FailureFailure Deterioration ofEquipment or se/Interference withEquipment or LTotalABCDABCDABCDABCDABCDWork tallation FailureFailure Deterioration ofEquipment or Wiring00000000000000000000000Misuse/Interference withEquipment or erTOTAL001000000000000000145TOTAL100180503
Electrical fatality information from the last 16 years (2000-01 to 2015-16 has been analysed for trends and frequency. The electrical deaths over 16 years continue to show a decrease from an average (three years) of 1.79 deaths per million people (dmp) in 2000-01 to 0.50 in 2015-16. An average rate of reduction is 0.08 dmp.