Transcription
Health Care Cost TrendsState and Market-Level Cost Growth in Oregon, 2013-2019July 2022
Executive SummaryOregon is taking bold steps to control the rising cost of health care. As the fourthstate to establish a health care cost growth target program, Oregon is shining a lighton the key drivers of health care costs and setting the stage to hold both the publicand private markets accountable for containing cost growth.To provide historical context ahead of future publications, this report presents a detailed look at health care costsand cost growth in Oregon between calendar years 2013 and 2019. This is the first report looking at Oregonspecific cost growth trends by market: commercial, Medicaid and Medicare.Chapter I explores health care cost growth in Oregon compared to inflation, income growth, and wage growth.This chapter also presents cost growth trends for commercial, Medicaid and Medicare markets. A summary ofenrollment trends and a closer look at Medicaid cost growth offer important context for interpreting cost growth.Chapter II presents cost and cost growth data for six major service categories: inpatient services, outpatientservices, professional services, pharmacy, emergency department, and other. This chapter reports trendsstatewide and by market.Chapter III identifies the primary drivers of health care costs in each market by highlighting what types of servicesare responsible for most of the cost growth.Oregon’s Sustainable Health Care Cost Growth Target ProgramIn 2019, the Oregon Legislature established the Sustainable Health Care Cost Growth Target Program, which sets a statewidetarget for the annual per person growth rate of total health care spending in the state. The program will also monitor andpublish reports on health care cost increases and factors driving these trends.For more information: https://go.usa.gov/xzFpXOregon Heath AuthorityHealth Care Cost Trends, 2013-20192
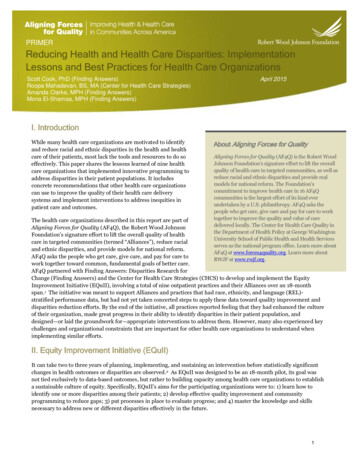
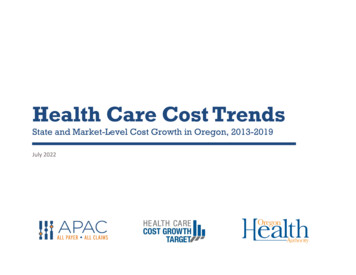
Key FindingsBetween 2013 and 2019, health care costs in Oregon grewfaster than the national average. Oregon’s health care costsalso grew faster than income and inflation. However, interms of a dollar amount, health care in Oregon in any givenyear is less expensive than the national average.Per person health care costs in Oregon grew by 49 percentfrom 2013 to 2019, which is an average of 6.9 percentannually.From 2013 to 2019, Medicare costs per person grew 58percent, Commercial costs per person grew 45 percent, andMedicaid costs per person grew the least at 32 percent.Per person annual health care costgrowth in Oregon is higher than thenational ulative growth in per person health care costs, by marketStatewide Commercial Medicaid Oregon Heath Authority2014201520162017Health Care Cost Trends, 2013-2019201820193
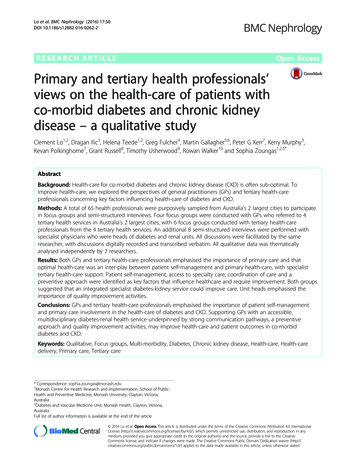
Overall, inpatient services were the highest costcategory, followed by professional services.Pharmacy and Emergency Department costs grewthe most between 2013 and 2019Pharmacy per person costs grew the most ofany service category from 2013 to 2019, drivenby a 20 percent annual growth in Medicare. 6,713Total 6,000Per person costsPer person costs presented in this report aredetermined by both the amount paid forservices (also known as price) and the numberof services delivered (also known as utilization).Future reports will present additional analysesabout price and utilization to determine whichwas more responsible for cost growth. 8,000PharmacyEmergency Dept 4,506 4,000Professional ServicesOutpatient 2,000InpatientOther 2013201420152016201720182019By Market Medicaid costs were generally the lowest and Medicare costs were the highest. In the commercial market, per person costs in the professional service category were the highest cost at 1,657 and contributed the most to overall cost growth between 2013 and 2019. In the Medicare market, inpatient per person costs were the highest cost category at 3,489 in 2019 andpharmacy per person costs in Medicare grew the most at 185 percent over the six years. In the Medicaid market, inpatient per person costs were the highest cost category at 1,250 in 2019 andprofessional services and pharmacy contributed the most to overall cost growth between 2013 and 2019.Oregon Heath AuthorityHealth Care Cost Trends, 2013-20194
Table of ContentsExecutive Summary. 2Key Findings . 3Table of Contents . 5Introduction . 6I.Cost Growth Trends . 9II.Cost Growth Trends by Service Category . 20III. Identifying Cost Growth Drivers. 29Cost Drivers in the Commercial Market. 30Cost Drivers in the Medicaid Market . 31Cost Drivers in the Medicare Market. 32Appendix 1. Data Tables . 33Appendix 2. Methodology . 39Oregon’s All Payer All Claims (APAC) database . 39Cost Trend Analysis Methodology . 40Appendix 3. Medicaid Cost Growth Measurements. 43Suggested Citation: Oregon Health Authority. Health Care Cost Trends: State and Market-Level Cost Growth in Oregon, 2013-2019.Portland, OR. July 2022.For questions about this report, please contact: HealthCare.CostTarget@odhsoha.oregon.gov.Oregon Heath AuthorityHealth Care Cost Trends, 2013-20195
IntroductionOregon is taking bold steps to control the rising cost of health care. As the fourth state to establish a health care cost growth targetprogram, Oregon is beginning to shine a light on the key drivers of health care costs and setting the stage to hold both the public andprivate markets accountable for containing cost growth.What’s in this report?This report provides a detailed look at health care cost growth in Oregon between calendar years 2013 and 2019 and for the firsttime, a look at cost growth trends by market (Medicaid, Medicare, and Commercial). Medicare includes both Medicare Advantageand traditional Medicare. Medicaid includes both Coordinated Care Organizations and Open Card. This report describes cost growthtrends in health care claims in Oregon prior to the COVID-19 pandemic and provides a foundation for understanding cost growthprior to the launch of the Sustainable Health Care Cost Growth Target Program. In addition to presenting data by market, this reportexplores different types of health care services to show which services are higher cost and which are growing more than others.This report is inspired by an analysis conducted by the Health Care Cost Institute (HCCI), which looks at trends in spending forindividuals with employer-sponsored insurance.1 HCCI found that Oregon had an 18.2 percent increase in commercial health carespending between 2014-2018, however HCCI only used claims data for four national health insurance plans – Aetna, Humana, KaiserPermanente, and United Healthcare – which doesn’t represent the full Oregon experience. Oregon Health Authority (OHA) usedOregon’s All Payer All Claims (APAC) database, which includes data from roughly 90 health insurance providers to provide a morecomprehensive look at spending across payers.The impact of COVID-19The COVID-19 pandemic has affected health care costs and may continue to have impacts in future years, although we don’t knowhow much or to what extent. Some experts predict savings from fewer patient visits and postponed services, while others predictcost increases from COVID hospitalizations and costs for testing, vaccines, and future treatments, as well as policy changes (e.g.,telehealth reimbursement). Provider closures, workforce shortages, premium rebate requirements, and the amount of pent-updemand that might drive future health care spending also create uncertainty. This report does not include data for 2020 or 2021;future reports will describe the impact of COVID-19 on health care costs, prices, and regon Heath AuthorityHealth Care Cost Trends, 2013-20196
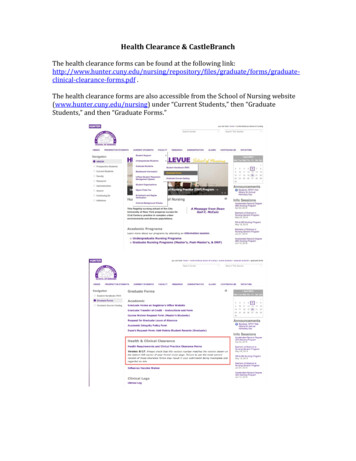
How does this report relate to Oregon’s cost growth target?This report uses claims data from Oregon’s All Payer All Claims (APAC) database to understand cost growth trends. Cost growthrefers to the change of the average per person cost of health care. For example, if the average cost of something is 100 one yearand 115 the next year, the cost has grown by 15 percent.This report does not include all health care cost data that will be submitted for Oregon’s Sustainable Health Care Cost Growth TargetProgram, such as pharmacy rebates, non-claims-based payments, and administrative costs. The data presented in this report canprovide foundational context for health care cost growth in Oregon, however, these data will not be used for calculating payer andprovider organizations’ performance relative to the cost growth target for 2021 and beyond.Oregon will produce similar reports under the Sustainable Health Care Cost Growth Target Program’s Data Use Strategy, leveragingthe APAC database and other data sources. Future reports will provide additional granularity, exploring cost growth and key costdrivers such as price and utilization, as well as detail at the payer and provider organization level.What does this report tell us about health equity?Health care costs in Oregon are growing at a rate that isnot sustainable. Health care costs are projected tocontinue growing faster than both the economy and wagesin the state. When the cost of health care grows faster thanthe economy and wages, it means that people in Oregonspend a larger percentage of their income on health care.Many struggle to afford their out-of-pocket costs and delayneeded care because of costs. Rising health care costs alsomean less money is invested in wages, retirement, criticalpublic services, and programs that address equity.2The percent of household income that goes toward health carecontinues to increase3Housing,utilities, fuels,furnishingHealth care30%20%OtherFood and Beverage10%TransportationRecreationApparel0%1930 1940 1950 1960 1970 1980 1990 2000 20102Anand, Priyanka. “Health Insurance Costs and Employee Compensation: Evidence from the National Compensation Survey.” Health Economics, volume 26,issue 12, December 2017, pages 1601-1616. c.3452Oregon Heath AuthorityHealth Care Cost Trends, 2013-20197
Data and MethodologyThis report uses data from Oregon’s APAC database for 2013-2019. APAC was established in 2009 and contains administrative healthcare data on topics such as insurance coverage, health service cost and utilization for Oregon’s insured populations. APAC providesaccess to timely and reliable data essential to assess the cost of health care, improve quality, reduce costs, and promotetransparency. For more information about APAC: -Payer-All-Claims.aspxCost growth trend data presented in this report was not adjusted for inflation. See Appendix 2 for additional information about thedata and methodology.This report presents data showing how much insurance companies and coordinated care organizations (CCOs) pay for theirmembers’ health care. This report does not show how much insurance companies receive in the form of premiums nor how muchCCOs receive from the Oregon Health Authority. In a given year, the amount that an insurance company or CCO receives and what itspends are two different things and are unlikely to exactly match.TerminologyCost Growth: Cost growth refers to the change of the average per person cost of health care. For example, if the average cost ofsomething is 100 one year and 115 the next year, the cost has increased by 15 percent.Market: This report uses “market” to refer to Commercial, Medicaid, and Medicare – also known as “line of business”.Payer: This report uses “payer” to refer to an entity that pays for an individual’s health care, such as a health insurance company.Oregon Heath AuthorityHealth Care Cost Trends, 2013-20198
I. Cost Growth TrendsAnnual Growth in Per Person Health Care Costs, StatewideFrom 2013 to 2019 in Oregon, per person health care costs rose an average of 6.9 percent annually, faster than health care costshave grown nationally, which has averaged 4.0 percent annually.3 The largest annual increase in per person health care costs inOregon was 8.3 percent in 2016. Even after including the change from 2012 to 2013, which was an overall cost reduction of healthcare costs in Oregon, the seven-year average growth was 5.4 percent, which is larger than the national average of 3.7 percent.In 2019, Oregon’s per person health care cost was 6,713, compared with 11,462 nationally. See Appendix 1 for data tables.Per person health care costs in Oregon arelower than national average 11,462Per person annual health care cost growth inOregon is higher than the national average7.6% 9,045 6,7134.4%4.3%3.8% 01820193National Health Expenditure Data from CMS, Table 1, National Health Expenditures Per Capita. ExpendData/NationalHealthAccountsHistorical. Data last modified December 15, 2021.Oregon Heath AuthorityHealth Care Cost Trends, 2013-20199
Oregon’s Cost Growth Relative to the Future Cost Growth TargetThe analysis presented in this report is not a baseline for Oregon’s new Sustainable Health Care Cost Growth Target Program.Oregon will not begin officially comparing annual health care cost growth performance to the target at the state and market leveluntil the 2021 measurement year and at the payer and provider level until the 2022 measurement year.However, Oregon’s historic annual per person health care cost growth can still be compared with the cost growth target value of 3.4percent. Since 2013, Oregon’s annual per person health care cost growth has been above 3.4 percent.Annual per person health care cost growth in Oregon, 2013-2019relative to the cost growth target7.6%7.1%8.3%6.7%7.3%Cost growth target of 3.4%2014Oregon Heath Authority201520162017Health Care Cost Trends, 2013-201920184.4%201910
Cumulative Growth in Per Person Health Care Costs, StatewideIn addition to looking at annual health care cost growth, which might be influenced by specific factors like a new expensive drugentering the market, we can also look at cumulative health care cost growth over time. Cumulative growth shows the effect ofcompounding, which means the cost growth percentage in a given year is in addition to the growth in previous years. Thecumulative per person health care cost growth varies depending on what year you use as the baseline, as illustrated below.2013-2019: per person health care costs increased by 49% in Oregon, compared with49.0%27% 19: Per person health care costs increased by 39% in Oregon, compared with22% 15-2018: Per person health care costs increased by 29% in Oregon, compared with16% gardless of what year is used as the baseline, per person increases in health care spending in Oregon are greater than the nationalaverage. The tables in this report use 2013 as the baseline. See Appendix 1 for data tables.Oregon Heath AuthorityHealth Care Cost Trends, 2013-201911
Cumulative Growth in Per Person Health Care Costs and Economic IndicatorsWhile wages and per person income have both grown in Oregon between 2013 and 2019, per person health care cost grew faster.Health care cost growth also outpaced national inflation, and inflation specific to medical care.42013-2019: per person health care costs inOregon grew faster than per personincome and average wages2013-2019: per person health care costs inOregon grew faster than inflation andinflation for medical care49.0%per personhealth carecosts49.0%per personhealth carecosts31.5%per 0152016201720182019See Appendix 1 for data tables.4Per person income and average wage data from the Oregon Economic Forecast data tables. v.aspx.Inflation is reported as the consumer price index (CPI) – all urban consumers, and CPI- medical care. https://fred.stlouisfed.org/series/CPIMEDSL#0. Data pulledMarch 14, 2022.Oregon Heath AuthorityHealth Care Cost Trends, 2013-201912
Cumulative Growth in Commercial Insurance Deductibles and PremiumsAs health care costs grow, the patient responsibility amounts are also increasing faster than inflation, income, and wages. Patientresponsibility costs include deductibles and premiums, as well as co-payments and other out-of-pocket spending. The graphs belowshow the cumulative growth in annual premiums and deductibles for people in Oregon with employer-sponsored insurancecoverage. Single coverage is a health insurance plan for one individual; family coverage is a health insurance plan for more than oneperson.In 2019, the average annual deductible for family coverage in Oregon was 3,634 (compared with 3,655 nationally) and the averageannual deductible for individual (single) coverage was 1,958 (compared with 1,931). The portion of insurance premiums paid bythe employee for family coverage was 5,404 in Oregon in 2019 (compared with 5,726 nationally) and 1,155 for single coverage(compared with 1,489). When combined, these patient responsibility amounts for Oregonians in 2019 were 10.1 percent of medianincome.Total growth of deductibles for individualswith employer-sponsored insurance between2013 - 2019, Oregon51.2%Single coverage39.8%Family coverageTotal growth of employee contributions topremiums for individuals with employersponsored insurance between 2013 - 2019,Oregon43.7%Single coverage24.9%Family 16201720182019Premium and deductible data from the Medical Expenditure Panel Survey (MEPS) Insurance Component. https://meps.ahrq.gov/mepsweb/Patient responsibility as share of median income from The Commonwealth Fund, State Trends in Employer and Premium Deductibles. Nov t/files/2020-11/Collins state premium trends 2020 db 1.pdf. Data pulled September 24, 2021.Oregon Heath AuthorityHealth Care Cost Trends, 2013-201913
Annual Growth in Per Person Health Care Costs, by MarketLooking only at health care costs trends at thestatewide level can hide variations by market, as theMedicare, Medicaid, and commercially insuredpopulations are very different in their health status,health care needs, and utilization patterns – all ofwhich affect health care costs.Per person health care costs, by marketStatewide Commercial Medicaid Medicare 12,000 11,333 10,000 8,000Enrollment data in APAC from 2019 shows 41percent of individuals had commercial coverage, 34percent had Medicaid and 24 percent had Medicare.While Oregon’s statewide per person health carecosts increased to 6,713 by 2019, Medicare costsare two and three times as much as commercial andMedicaid costs, respectively.Compared with the average annual increase in perperson health care costs for all payers between2013 and 2019 (6.9 percent), Medicare costsincreased faster (6.1 percent annually) thancommercial (4.4 percent annually) and Medicaid(4.4 percent annually). 6,713 6,000 5,132 4,000 3,594 2,000 2013201420152016201720182019Annual growth in per person health care costsStatewide Commercial Medicaid Medicare20%15%10%Notably, the costs reflected in the graphs do notinclude administration costs or profits.See Appendix 1 for data tables.5%0%-5%-10%2013Oregon Heath Authority20142015Health Care Cost Trends, 2013-2019201620172018201914
Cumulative Growth in Per Person Health Care Costs, by MarketStatewide, per person health care costs in Oregon have grown cumulatively by 49 percent between 2013 and 2019. Medicare perperson health care costs have grown over 57 percent in that time, compared with just over 45 percent for commercial and 32percent for Medicaid.Between 2013 and 2014, health care costs increased substantially in the commercial and Medicare markets. Nationally, this wasdriven by the expansion of health insurance coverage under the Affordable Care Act, including enrollment in commercialMarketplace plans. There was also rapid growth in spending on retail drugs, including the introduction of new drug treatments forhepatitis C, and those used to treat cancer and multiple sclerosis.5Medicaid cumulative per person health care costs initially lagged Medicare and Commercial growth, as new enrollees were addedduring the Medicaid expansion in 2014. The new Medicaid enrollees in 2014 tended to be healthier compared with the previouslyenrolled Medicaid participants. Medicaid experienced sharper growth between 2017 and 2019. See A Closer Look at Enrollment andA Closer Look at Medicaid Cost Growth sections for more detail.Cumulative growth in per person health care costs, by marketStatewide Commercial Medicaid 2014201520162017201820195Martin, Anne B. et al. “National Health Spending In 2014: Faster Growth Driven By Coverage Expansion And Prescription Drug Spending.” Health AffairsNumber 1 (2016): 150-160. 2015.1194Oregon Heath AuthorityHealth Care Cost Trends, 2013-201915
A Closer Look at EnrollmentPer person health care costs are calculated basedon the number of people who are enrolled ineach market. Changes in enrollment affect perperson health care cost trends.The graph to the right shows the cumulativechange in enrollment, by market, between 2013and 2019, as measured in member months, acommon way to standardize health insuranceenrollment. For example, Medicaid membermonths increased by 57 percent between 2013and 2017.80%Cumulative changes in member months, 2013-2019Statewide Commercial Medicaid Methods: a member month represents one member enrolled for one month. Forexample, a person who is a member of a health plan for a full year generates 12member months. Using member months helps account for people who may havemultiple insurance types during a year, or who may only be insured for part of ayear.In 2014 and 2015, Medicaid enrollment in Oregonincreased dramatically, due to the AffordableCare Act and the Medicaid expansion. There wasa corresponding decline in the number of uninsured.6 Additionally, in 2017 and 2018, Medicaid completed a redeterminationprocess, identifying individuals who no longer met income eligibility criteria, which resulted in a drop in Medicaid enrollment afterthe increased enrollment in 2014-2016.The graph also shows commercial enrollment decreasing in 2015 and 2016. The decline is due to a March 2016 ruling by the U.S.Supreme Court titled Gobeille v. Liberty Mutual Insurance Company, after which self-insured plans regulated by the federalEmployment Retirement Income Security Act of 1974 (ERISA) became exempt from mandatory data submission to APAC and otherall payer claims databases across the country.Lastly, Medicare enrollment continues to grow as more individuals become eligible for Medicare. Many of these individuals leavetheir commercial insurance when they become Medicare eligible.6Oregon Health Insurance Survey, https://go.usa.gov/xuPQZ.Oregon Heath AuthorityHealth Care Cost Trends, 2013-201916
A Closer Look at Medicaid Cost GrowthMedicaid costs have seen two periods of notable changes. Thefirst, in 2014, was due to approximately 400,000 individualsgaining Medicaid coverage because of the Affordable CareAct. The increase of enrollment resulted in a reduction in theper person cost because many of the new enrollees wererelatively healthier and did not need as much medical care.The second notable change in per person cost growthoccurred in 2017 and 2018, when OHA conducted a thoroughredetermination process for Medicaid enrollees. The numberof Medicaid enrollees decreased by approximately 13percentage points, but the average per person cost increasedby 9.1 percent and 9.8 percent in 2017 and 2018, respectively,because the remaining Medicaid enrollees were relatively lesshealthy, and therefore more costly. In other words, Medicaidmembers’ health care costs increased due to the effect of theredeterminations.7 The redetermination process in 2017 and2018 shows that total program costs can decrease while perperson costs are increasing.Annual per person costs of Medicaid enrollees from 2013 to2019 were lower than both commercial and MedicareAdvantage. From 2013 to 2019, per person costs grew from 2,715 to 3,594.Annual Per Person Medicaid Costs, 2013 - 2019Statewide Commercial Medicaid Medicare 12,000 10,000 8,000 6,000 4,000 2,000 3,594 3,135 2,755 2,715 -2013201420152016201720182019Annual change in per person health care costsStatewide Commercial Medicaid .8%See Appendix 1 for data tables.-10%201372014201720182019See OHA Rate Certification documents, Appendix I.E: Redetermination Factors, 2018 (https://go.usa.gov/xuPn6) and 2019 (https://go.usa.gov/xuPnh).Oregon Heath AuthorityHealth Care Cost Trends, 2013-201917
Multiple state and federal policy changes have led to Medicaid cost growth between 2013 and 2019. In addition to the AffordableCare Act in 2014, which resulted in many people becoming eligible for Medicaid, many of these policy changes resulted in anexpansion of benefits for Medicaid enrollees, which translated to program cost growth.Unlike in commercial health insurance, where costs from expanded benefits may be off-set by member cost-sharing such ascopayments, Oregon Medicaid enrollees do not pay any cost-sharing. Some of the Medicaid cost growth drivers include: Expansion of high-cost hepatitis Cdrug coverage, particularly in 2017and 20188Implementation of CertifiedCommunity Behavioral Health ClinicsImplementation of the ReproductiveHealth Equity Act (RHEA)Adjusted reimbursement forprofessional and hospital servicesThe Medicaid cost trends presented in this report include both CCO members and individuals not enrolled in a CCO, otherwiseknown as Open Card members. The underlying health risk and the cost trends of these two populations differ. The drivers of costgrowth described above impact CCO and Open Card members differently. Future reports will explore spending trends across CCOand Open Card members.Notably, this report excludes Qualified Directed Payments, which are Medicaid payments made to hospitals but are not reflected inthe claims data.8OHA Coordinated Care Organization Rate Development Actuarial Certification. January 1, 2017 – December 31, 2017 Capitation Rateshttps://go.usa.gov/xuPQ3 and OHA Coordinated Care Organization Rate Development Actuarial Certification. January 1, 2018 – December 31, 2018 CapitationRates https://go.usa.gov/xuPQc.Oregon Heath AuthorityHealth Care Cost Trends, 2013-201918
This report uses claims data from the APAC database to measure per person cost growth for Medicaid; this is a differentmethodology from how Oregon has been held accountable to 3.4 percent cost growth under its 1115 Medicaid waiver with thefederal government and its state statutory limits on Medicaid budget growth.For example, the analysis presented in this report uses only medical claims payments and does not include, imputed amounts,dental costs or any payments that are not claims-based. Conversely, the 3.4 percent cost growth target specified in the 1
Between 2013 and 2019, health care costs in Oregon grew faster than the national average. Oregon's health care costs also grew faster than income and inflation. However, in terms of a dollar amount, health care in Oregon in any given year is less expensive than the national average. Per person health care costs in Oregon grew by 49 percent