Transcription
Local Office Service AssessmentCentral Iowa Floods of 2008Late May through Mid June, 2008U.S. DEPARTMENT OF COMMERCENational Oceanic and Atmospheric AdministrationNational Weather ServiceWeather and Forecast Office – Des Moines, IowaPublished May 2009
ContentsOverview . 4Central Iowa Floods of 2008 Service Assessment Team . 5Acronym Definitions . 6Summary of Rainfall and Historic Flooding . 9NWS Products and Services . 23Facts. 23Text Product Formatters for Warnings and Forecasts . 24Best Practices. 24Summary of Findings, Recommendations and Actions. 24External Service and Response . 25Best Practices . 25Facts. 26Findings, Recommendations and Actions . 30National Weather Service Internet Service . 33State Emergency Operations Center (SEOC) . 33Best Practices. 35Facts . 35Findings, Recommendations and Actions . 36Internal Operations and Forecast Process . 38Flash Flood Operations . 38Facts . 39Best Practices. 43Findings, Recommendations and Actions . 43River Flood and Small Basin Operations . 44Best Practices. 44Findings, Recommendations and Actions . 44DMX Operational Staffing . 46Facts . 46Best Practices. 46Findings, Recommendations and Actions . 47
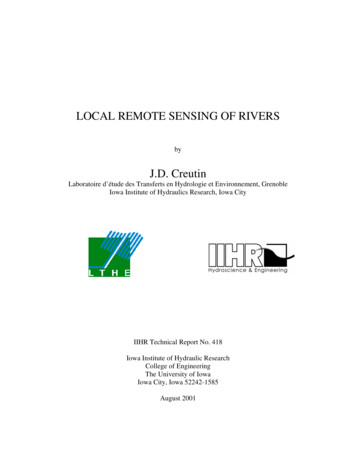
Appendix A - Testimonials . 48Mahala Cox, Emergency Manager – Warren County . 48Joyce Flinn, Readiness Response Bureau Chief – Iowa Homeland Security and EmergencyManagement Division. 48Iowa State Patrol Communications – Des Moines/Atlantic . 48Lori Morrissey, County Emergency Management Coordinator – Story County . 48Chris Maiers, Broadcast Meteorologist – ABC5-TV . 49Peter Grandgeoerge, Business Continuity Manager – Mid American Energy . 49Roxanne Warnell, County Emergency Management Coordinator – Tama County. 49Cover Photo:A Union Pacific bridge is partially swept away by high floodwaters on theCedar River in downtown Waterloo, Iowa on Tuesday June 10, 2008. With rivers continuing torise and more heavy rain on the way, state officials said Tuesday they were trying to help townsalready battered by floodwaters while working to protect others. (AP Photo/The WaterlooCourier, Morgan Hawthorne)
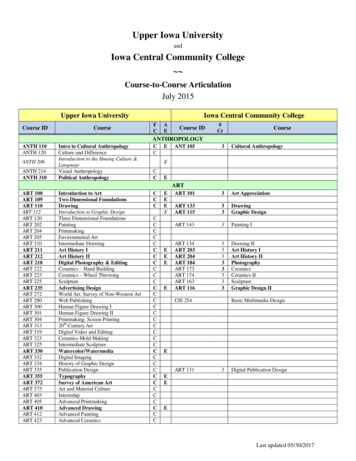
OverviewThis service assessment focuses on the historic flooding in central Iowa from late May 2008through June 2008. It is specific only to the National Weather Service Des Moines (DMX) areaof responsibility, which includes 51 central Iowa counties and 46 river forecast points on 3major river basins.During this time period, the DMX Senior Service Hydrologist (SSH) position was vacant. The SSHvacancy had major impacts on office workload, on staff availability to handle the flood threat,and ready expertise regarding central Iowa’s rivers and flood impacts.In addition to the flooding threat, the DMX staff also tackled numerous severe weatheroutbreaks during which 362 Severe Thunderstorm and Tornado Warnings were issued, and 483reports of severe weather were recorded, including 63 reports of tornadoes.Hydrologists from other National Weather Service (NWS) locations were rotated through theDMX office on a temporary basis during peak flooding, and their efforts were appreciated. Still,heavy workload demands (including 240 hours staffed at the State Emergency OperationsCenter (SEOC)) caused the flood forecast responsibility to fall upon the entire DMX staff, andnot just one or two individuals. Normally this effort would be expertly handled by the DMXSenior Hydrologist, maintaining a focus and a time continuity that was difficult to match duringthe floods of 2008.As such, this service assessment summarizes the efforts of the entire DMX staff to provideexemplary flood warning and forecast services, with the attendant positive and negativeaspects. Fifty-seven findings and recommendations for improvement were identified by theDMX staff, reflecting their desire to provide better service more efficiently in future events.Most of the recommendations were internal to NWS operations, so they are summarized herefor brevity.Figure 1: Iowa map showing counties in the DMX area of responsibility or County Warning Area(CWA).
Central Iowa Floods of 2008 Service Assessment TeamA service assessment team was formed shortly after the floods began to recede. The team goalwas to evaluate the DMX service and operations, plus external response to the event. TheCentral Iowa Floods of 2008 Service Assessment Team focused on three primary areas: internaloperations and forecast process, NWS products and service, and external service and response.This assessment reviews multiple events over a period of weeks, and on time scales from flashflooding to mainstem river flooding.The service assessment team reviewed the events, met numerous times to discuss bestpractices and findings, and developed recommendations to the findings to improve DMXoperations in future events. It is the team’s goal to accurately detail the NWS’s role in theevent and to improve future operations.Internal operations and forecast process:Karl Jungbluth, Ben Moyer, Melinda Albrecht,Rod Donavon, Frank Boksa, Jeff ZoggNWS products and services:Ben Moyer, Steve Teachout, Karl JungbluthExternal service and response:Roger Vachalek, Brenda BrockOverview of rainfall and flooding:Ken Podrazik, Miles Schumacher
Acronym Definitions12Planet – internal NWS chat software used for office forecast collaborationAL – annual leaveAOP – Annual Operating PlanARX – National Weather Service La Crosse, WIBLESS – an internal NWS procedure for approving river forecasts before they are disseminatedCDT – Central Daylight TimeCFS – Cubic Feet per SecondCO-OP – Cooperative ObserverCRH – Central Region HeadquartersCSI – critical success indexCTA – call-to actionCWA – county warning areaDATAC – Data Acquisition employeeDMOI4 – Des Moines River at 2nd Avenue forecast and observation pointDMX – National Weather Service Des Moines, IADVN – National Weather Service Davenport / Quad CitiesEC – event coordinatorEF3, EF5 – Enhanced Fujita Scale tornado damage rating of 3 and 5, respectivelyEM – emergency managerEMChat - Internal chat room used to communicate between DMX personnel and county emergencymanagers of central IowaEOC – Emergency Operations Center
ESF – Hydrologic OutlookFAR – false alarm ratioFEMA – Federal Emergency Management AgencyFFA – Flash Flood WatchFFMP – Flash Flood Monitoring and Prediction softwareFFW – Flash Flood WarningFLW – Flood WarningGHG – Graphical Hazard GeneratorHIC – Hydrologist-In-ChargeHMT – Hydro Meteorological TechnicianHSEMD – Iowa Homeland Security Emergency Management DivisionHWO – Hazardous Weather OutlookHydroView – hydrologic data viewing and manipulation softwareICP – Incident Command PostIDOT – Iowa Department of TransportationIEM – Iowa Environmental MesonetITO – Information Technology OfficerLP1 – Local Primary Emergency Activation SystemMIC – Meteorologist-In-ChargeMICRN – Metro Incident Command Radio NetworkMRCC – Midwest Regional Climate CenterNCRFC – North Central River Forecast CenterNOAA – National Oceanic and Atmospheric AdministrationNWR – NOAA All Hazards RadioNWS – National Weather Service
NWSChat – NWS sponsored internet-based chat software used to communicate with various externalpartnersOAX – National Weather Service Omaha/Valley, NEPDS – particularly dangerous situationPOD – probability of detectionQPF – quantitative precipitation forecastRFC – River Forecast CenterRiverPro – river product formatting softwareSEOC – State Emergency Operations CenterSEOCChat – Internal chat room used to communicate between NWS representative at the SEOC andNWS offices serving IowaSOO – Science and Operations OfficerSSH – Senior Service HydrologistSVR – Severe Thunderstorm WarningUSACE – United States Army Corps of EngineersUSGS – United States Geological SurveyWarnGen – warning generation softwareWCM – Warning Coordination MeteorologistWFO – Weather Forecast Office
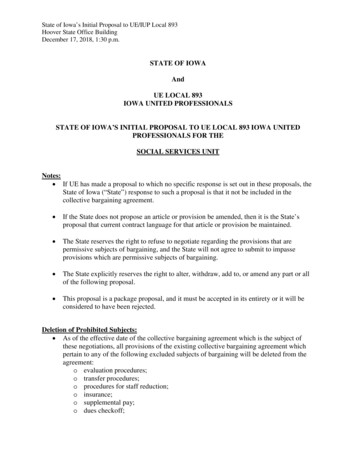
Summary of Rainfall and Historic FloodingThe Des Moines, Cedar, and Iowa River basins, including their tributaries, were affected in thelate spring and early summer by the historical Midwest Flood of 2008. The flooding began withan active 2007-2008 winter season where abundant snowfall and ice accumulations occurredacross the state. Below-normal temperatures and above-normal precipitation played asignificant role in the record-breaking flooding of May and June 2008.Iowa Governor Chet Culver confirmed that damage across the state was nearly 10 billion,making it the worst disaster ever to occur in the state of Iowa. The flooding across Iowa andthe rest of the Midwest resulted in the governor declaring 86 of the 99 counties in Iowa as statedisaster areas. In addition to the state disaster areas, federal disaster declarations were issuedby FEMA (Federal Emergency Management Agency), for 80 of Iowa's 99 counties. Within theDMX CWA, 44 of 51 counties were declared a federal disaster and all but three were declaredstate disaster areas (Figure 2). Property and crop damage across Iowa reached incredibleamounts from the Flood of 2008. Estimates on property damage may exceed one billion dollarsonce all insurance claims are complete, while the statewide crop damage exceeded four billiondollars. At the height of the flooding in mid June, roughly 2.5 to 3 million acres of corn andsoybeans were underwater which placed just over 50% of the statewide crop in the categoriesof fair, poor, or very poor condition for each crop.1 An estimated 2.3 million acres, or about10% of Iowa’s cropland, had severe soil erosion. Soil erosion is defined as 20 or more tons ofsoil loss per acre. According to the Iowa Department of Agriculture and Land Stewardship, anestimate of 40 million in damages occurred to water conservation structures.Figure 2: Iowa Counties Receiving Disaster Proclamations from the State of Iowa and theFederal Government.1USDA Iowa Crops & Weather, Vol 08-15.
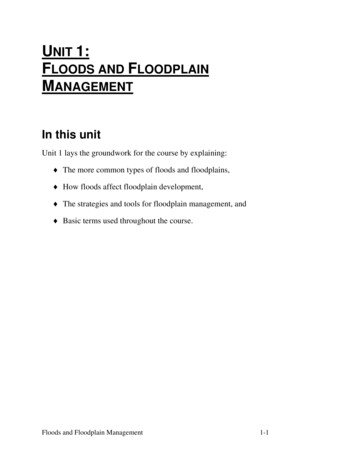
The Iowa Department of Transportation (IDOT) had major infrastructure damage to primaryhighways, secondary roads, bridges, and the railroad system. Reports from the state indicatedthat 125 miles of primary highway in Iowa were washed out completely by the flooding andforced the closure of 464 miles worth of Iowa's primary highway system. Over three hundredbridges and overpasses where damaged or destroyed. Around 1500 miles of road were in needof replacement following the floods. The preliminary damage estimate for road infrastructurewas 80 million statewide. The IDOT Office of Rail Transportation reported 17 railroad bridgesand over 400 miles of track were damaged or destroyed by the flood waters. Along with therailway itself, replacements of the crossing signals, mile markers, and other related railroadequipment were needed. The statewide damage to the railroad system was estimatedbetween 68 million and 83 million, and was expected to take 6 to 12 months to repair fromthe time of the disaster. If the loss of revenue due to delays and costs from re-routing ofshipments was included, this number would increase dramatically.The extremely active weather pattern which sparked the historic flooding began during theweek prior to Memorial Day, and the bulk of the precipitation continued through the middle ofJune (Figure 3). From May 22nd through June 15th 2008, Des Moines, Iowa received 13.4inches of rainfall. Waterloo, Iowa received 12.8 inches of rainfall during this same 25-day span.In sixteen of the twenty-five days, Des Moines and Waterloo received measurable precipitationgreater than 0.01 inches. Some of the heaviest daily rainfall totals occurred between June 5thand June 8th. In fact, a record daily rainfall amount of 4.15 inches occurred on June 5th in DesMoines.On June 7th, Webster City, Iowa, received a record daily amount of 4.40 inches and on June 8th,Mason City, Iowa, received a record 4.90 inches. During the height of the flooding on June 12,2008, WSR-88D Doppler radar estimated 8 to 15 inches of rainfall accumulated across central tonortheastern Iowa over and including the previous 14 days (Figure 4). The statewide averageprecipitation from January to June 2008 was 24.47 inches which was 8.13 inches above normal.This became the wettest January to June period on record. Statewide records date back to1873. The Iowa statewide average precipitation for June 2008 totaled 9.01 inches, which ranksas the second wettest June among 136 years of records. Several cooperative observer (CO-OP)stations across Iowa reported record rainfall amounts for the month of June 2008 (Figure 5).
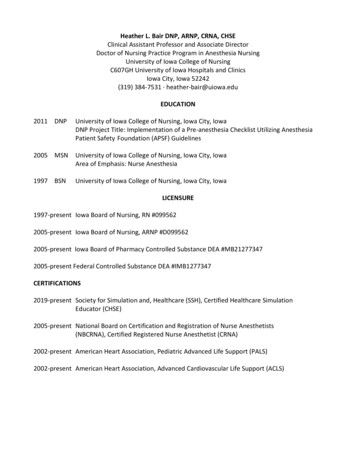
Figure 3: Total precipitation (inches) during the period of June 1-15, 2008. Map courtesyof Midwestern Regional Climate Center (MRCC).Figure 4: June 12, 2008 radar-estimated total rainfall across Iowa for 14 days ending onthe 12th.
Figure 5: Iowa CO-OPs that broke precipitation records for the month of June.According to the Iowa Crops & Weather report, provided by Iowa State Climatologist HarryHillaker, for the week ending June 1, 2008, the statewide average precipitation was 2.32 inches,which more than doubled the weekly normal of 1.04 inches. This week was Iowa’s wettestweek in 40 weeks. The following week, ending June 8, 2008, the statewide average forprecipitation was 5.00 inches which was 575% of normal for the week. The highest report wasa 2-day unconfirmed amount of 16.27 inches in Dorchester (northeast). And for the weekending June 15, 2008, the statewide average precipitation was 2.30 inches; once again morethan double the normal amount of 1.10 inches.2Out of the 46 river forecast points within the DMX CWA, eleven sites reached record crestsduring the month of June 2008 (see Table 1 and Figure 6). Twelve other forecast points withinthe DMX CWA reached major flood stage, as well as Saylorville Reservoir. In fact, Saylorvillereached a near record height of 890.87 feet, which was a mere 1.16 feet off the 1993 recordlevel. Water came extremely close to the bottom of the Mile Long Bridge (Highway 415) overSaylorville Lake (Figures 7 and 8). The Des Moines River at 2nd Avenue (DMOI4) crested onJune 13th at 31.57 feet with a river flow rate over 50,000 cubic feet per second (CFS). CFS isdefined as a volumetric flow rate that is equivalent to a volume of one cubic foot flowing everysecond through a given surface. In other words, the flow rate is the volume of fluid whichpasses through a given surface per unit time. A great visual interpretation of CFS is to compare2USDA Iowa Crops & Weather, Vol 08-13
it to a basketball, which is roughly one cubic foot in volume. Hence, 50,000 CFS can also beseen as a wall of 50,000 basketballs per second flowing by a given point.A levee breech occurred on June 14, 2008 near the Birdland area, close to downtown DesMoines. This prompted Des Moines city officials to issue voluntary and mandatory evacuationsto the residents of around 270 homes in the Birdland area. Several other notable areas affectedin and around Des Moines were Gray’s Lake, Des Moines’ North High School (Figure 9), andPrincipal Park (Figure 10).Figure 6: River forecast points within the DMX CWA that reached flood stage from late Maythrough the middle of June 2008. The majority of the crests across central Iowa occurred fromJune 9th to 13th.
Gage LocationWaterBodyFlood RecordStage StageDate2008 Crests(Preliminary)DateNew Hartford (NHRI4)Beaver Creek10 FT13.50 FT06/13/194715.71 FT06/09/2008Webster City (WBCI4)Boone River12 FT19.10 FT06/10/191817.74 FT06/10/2008Janesville (JANI4)Cedar River11 FT17.15 FT07/22/199919.45 FT06/08/200806/11/2008Waterloo (ALOI4)Cedar River12 FT21.86 FT03/29/196127.01 FTCedar Falls (CEDI4)Cedar River88 FT96.20 FT07/23/1999102.10 FT06/11/2008Fort Dodge (FODI4)Des Moines River10 FT19.62 FT06/23/194715.73 FT06/08/2008Saylorville Reservoir(SAYI4)Des Moines RiverNA892.03 FT07/11/1993890.87 FT06/12/2008Des Moines RiverNA24.12 FT07/11/199324.03 FT06/13/2008Des Moines River24 FT34.29 FT07/11/199335.55 FT06/13/2008Below Saylorville ReservoirthDes Moines Southeast 6 Street(DESI4)Des Moines 2ndDes Moines River23 FT31.71 FT07/11/199331.57 FT06/13/2008Ottumwa (OTMI4)Avenue (DMOI4)Des Moines River10 FT22.15 FT07/12/199320.58 FT06/17/2008Stratford (STRI4)Des Moines River14 FT25.68 FT04/02/199327.32 FT06/09/2008Tracy (TRCI4)Des Moines River14 FT26.50 FT06/14/194723.70 FT06/14/2008Marshalltown (MIWI4)Iowa River18 FT20.77 FT08/17/199321.79 FT06/13/2008Indianola (IDNI4)Middle River19 FT26.90 FT06/05/194725.55 FT06/06/2008Perry (PROI4)North ForkRaccoon River15 FT23.00 FT07/10/199321.67 FT06/10/2008Van Meter (VNMI4)Raccoon River16 FT26.34 FT07/10/199322.67 FT06/13/2008Des Moines Fleur Drive (DEMI4)Raccoon River12 FT26.70 FT07/11/199324.66 FT06/13/2008Des Moines Highway 28 (DMWI4)Raccoon River32 FT43.00 FT07/11/199341.31 FT06/13/200806/10/2008Shell Rock (SHRI4)Ames 3 Miles North (AMEI4)Oskaloosa (OOAI4)Finchford (FNHI4)Mason City (MCWI4)Shell Rock RiverSouth SkunkRiverSouth SkunkRiverWest Fork CedarRiverWinnebago River12 FT17.70 FT04/01/185620.36 FT14 FT15.87 FT06/17/199616.93 FT06/09/200817 FT25.80 FT05/01/194424.61 FT06/13/200812 FT18.45 FT07/29/199020.82 FT06/10/20087 FT15.70 FT03/30/193318.74 FT06/09/2008TABLE 1: A list of the river forecast points within the DMX CWA that reached record or majorflood stage during the Flood of 2008. The shaded light green rows are the river forecast pointswhich set new record stages in 2008. These crests are preliminary. The USGS will provide officialcrest data later in 2009.
Figures 7 (left) and 8 (right): Saylorville Lake and the Mile-Long Bridge (State Highway 415 toPolk City, IA) during the week of June 12th 2008. Photos are courtesy Iowa Department ofTransportation and Boone News Republican.Figure 9 (left) shows flooding of North High School between 6th Avenue and 2nd Avenue due to alevee breech along the Des Moines River on June 14, 2008. Photo source is unknown.Figure 10 (right) shows Principal Park in Downtown Des Moines, Iowa at the confluence of theRaccoon and Des Moines Rivers. Photo is courtesy of Roger Riley.Extensive flooding occurred along the Cedar River in Waterloo and Cedar Falls within the DMXCWA. Some minor and moderate flooding occurred towards the end of March and throughoutApril before the river fell below flood stage during the second half of May. An abrupt increasein the flow and river levels at Cedar Falls and Waterloo began on or shortly before June 1st,
2008, prior to cresting on June 11th at the record levels of 102.13 feet and 25.39 feet,respectively (Figures 11 and 12). On the Cedar River in Waterloo, the flow rate reached over105,000 CFS during the crest on June 11th. Relating back to the basketball analogy, during thecrest in Waterloo, one could imagine a wall of 105,000 basketballs per second flowing past theforecast point in Waterloo. Near the forecast point in Waterloo, the Union Pacific RailroadBridge was overtopped and washed out due to the record flood (Figure 13) with the cost toreplace the bridge estimated at 5.6 million. The Main Street Bridge and railroad bridge justupstream in Cedar Falls was nearly overtopped (Figure 14).Figures 11 and 12: Cedar River Hydrograph at the forecast points in Cedar Falls and Waterloo,IA. Graphs are courtesy U.S. Army Corps of Engineers.Figure 13 (left): Cedar River in Waterloo, IA on June 11, 2008. Photo is taken by AssociatedPress David K. Purdy.Figure 14 (right): A railroad bridge used by the Union Pacific Railroad and Iowa Northern inWaterloo, IA was overtopped and washed out. Photo is courtesy of Altered Stars and WeatherUnderground.
Figure 15: Main Street Bridge and railroad bridge over the Cedar River at Cedar Falls during theweek of June 11-15, 2008. Photo is courtesy of Gaylen Isely.Upstream of Cedar Falls and Waterloo, there are many tributaries which include forecast anddata points within the Cedar River basin. The tributaries that feed into the Cedar River includethe Beaver Creek, Black Hawk Creek, Shell Rock River, Winnebago River, and the West ForkCedar River. Forecast and data points along these tributaries are located at New Hartford,Hudson, Shell Rock, Mason City, and Finchford. In addition to the tributaries, on the CedarRiver there is a forecast point located at Janesville and a data point at Waverly. Record crestswere reached at both sites. A record crest of 19.68 feet occurred along the Cedar River inJanesville, which crested on June 8th and at Waverly where a crest of 19.33 feet was reached onJune 10th. With the exception for the Black Hawk Creek at Hudson, every other river forecastand data point (within the DMX CWA) along the stretch of the Cedar River basin reached arecord crest from June 8th through June 11th 2008. Major flooding occurred in several citiesand towns along the Cedar River and its tributaries. One of the more incredible occurrenceswas in Mason City as the Winnebago River actually changed course during the flooding andflash flooding events. Water covered vehicles in downtown Mason City and a local quarry filledwith water during the crest of the Winnebago River (Figures 16 and 17). The city was
completely inundated and the city water supply was disrupted for several days. Janesville andFinchford gauges stopped reporting the river levels due to the inundation of the water (Figure18). The record crest at Waverly inundated much of the town and flooded several businessesand homes during the second week of June (Figure 19).Figure 16 (left) taken on June 8 , 2008 in Mason City, IA at 13 and Elm Drive. Photo is courtesyof Jeff Heinz of the Globe Gazette. Figure 17 (right) shows the Winnebago River flowing in theHolcim Quarry located just north of Mason City. Photo is courtesy of Arian Schuessler of theGlobe Gazette.ththFigure 18 (left) is the hydrograph of the Cedar River at Janesville from May through August2008. During the height of the flood in the first part of June, the gage stopped reporting.Graphs are courtesy U.S. Army Corps of Engineers. Figure 19 (right) shows major flooding inWaverly, Iowa affecting the Dollar General retail store and several other businesses during theweek of June 7-12, 2008. Photo is courtesy of Reynolds Cramer.
Leading up to the historic flood during the summer of 2008, the winter months of December2007 to February 2008 played a significant role in the foundation for the floods. Temperaturesacross the region were below normal (Figures 20 and 21), while precipitation remained abovenormal across the state of Iowa (Figure 22). Heavy amounts of snow accumulated across Iowaduring these winter months and remained on the ground into the early part of spring. In fact,March was the only month leading up to the floods that was below normal for statewideprecipitation, but any precipitation that fell, generally fell as snow and fell quite regularly(Figure 23). The statewide average snowfall amount for March 2008 was 4.3 inches which was0.5 inches below normal and the statewide average temperature was 32.0 Fahrenheit, whichwas 4.0 colder than normal. The precipitation events during March 2008 were frequent, butlight in amounts. Overall, about half of the days in March recorded precipitation. For instance,Mason City and Waterloo recorded 20 and 16 days of precipitation of at least a trace,respectively. With the frequent precipitation and below normal temperatures the soil acrossmuch of Iowa remained very soggy. It also made for poor driving conditions on many unpavedroadways.3 Snow remained on the ground over the northeast half of Iowa even towards theend of the month (see Figure 24) as about 4 inches or greater were still on the ground overmuch of the Iowa and Cedar River basins towards the end of March. In addition, ice on rivershad a difficult time breaking up, and any moisture within the soil likely had a difficult timedraining or drying out because of the lack of sunshine and warm temperatures. In fact, someminor flooding occurred due to the snow melt and ice jams in March and April over portions ofcentral Iowa.Climate statistics from February 1st to mid-June in Mason City, Waterloo, and Des Moines, werefurther evidence that the below normal temperatures and above normal precipitation played arole in the soil moisture content across Iowa. For instance, the longest stretch of days withoutprecipitation was 7 days (occurred once) at Waterloo, 6 days (occurred once) at Des Moines,and 4 days (occurred 4 times) at Mason City during the aforementioned time frame. Roughly60 percent of the days or 3 out of every 5 days from February to mid-June recordedprecipitation of at least a trace in the three cities. Between Waterloo, Mason City, and DesMoines, seven individual daily precipitation records were set between the months of April tomid-June. Waterloo set a new monthly record in April 2008 with 10.79 inches of precipitation.3Iowa Dept. of Agriculture & Land Stewardship. Iowa Monthly Climate Summary March 2008.
Figure 20 (left) shows average temperature departure from mean for winter 2007-2008.Figure 21 (center) shows average temperature in degrees F for winter 2007-2008.Figure 22 (right) shows total precipitation percent of mean winter 2007-2008. All three mapsare courtesy of Midwestern Regional Climate Center.Figure 22 (left) shows total snowfall amounts for March 2008.Map courtesy of IowaDepartment of Agriculture & Land Stewardship.Figure 23 (right) shows modeled snow depth for March 24th, 2008. Map courtesy of MidwesternRegional Climate Center.
The active weather pattern continued right into the spring, which delayed most farmers fromplanting crops until May. This problem not only occurred across much of Iowa, but throughoutthe majority of the Midwest and Ohio Valley (Figure 24). With the delay in planting corn andother crops, much of the rain and snow melt drained into the creeks and rivers without beingabsorbed by growing crops. There were several events where rain mixed with snow acrossIowa, even into late April. The last recorded snow in Waterloo and Des Moines was on the 12thof April, and not until April 25th for Mason City. The first half of June averaged 2.1 Fahrenheitwarmer than normal and it appeared that Iowa would break its string of six consecutive belownormal months. However, the second half of the month averaged 2.2 Fahrenheit cooler thannormal, allowing the cold weather streak to extend to seven consecutive months. Waterloo,Mason City, and Des Moines were prime examples of the average temperature remainingbelow normal for an extended period of time (Figure 26).Figure 25: Midwest corn planting progress by mid-May 2008
Figure 26: Mason City, Des Moines, and Waterloo, IA average monthly temperature departure fromnormal. Time frame is from December 2007 to June 2008.Several CO-OP stations across Iowa, as well as the rest of the region, received record or nearrecord precipitation during the month of May and June 2008 (Figure 5). The hardest hit rainfallareas were in central to northeast Iowa within the Cedar and Iowa River basins, where theworst flooding occurred. Record flooding occurred with these aforementioned river basinsalong with their t
On June 7th, Webster City, Iowa, received a record daily amount of 4.40 inches and on June 8th, Mason City, Iowa, received a record 4.90 inches. During the height of the flooding on June 12, 2008, WSR-88D Doppler radar estimated 8 to 15 inches of rainfall accumulated across central to