Transcription
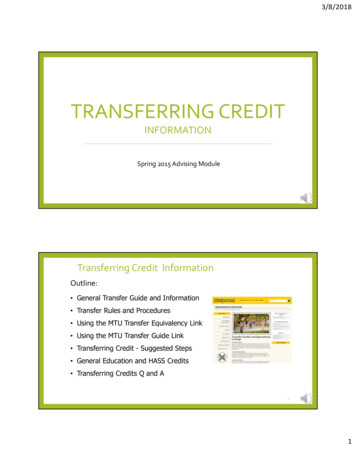
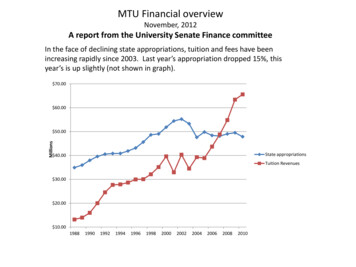
MTU Financial overviewNovember, 2012A report from the University Senate Finance committeeIn the face of declining state appropriations, tuition and fees have beenincreasing rapidly since 2003. Last year’s appropriation dropped 15%, thisyear’s is up slightly (not shown in graph). 70.00 60.00Millions 50.00State appropriations 40.00Tuition Revenues 30.00 20.00 010
Average in-state tuition at Michigan Tech2011-20122012-20132023-2024 13,910 14,448 29,500(Audited financial statement)(Audited financial statement)(if extrapolated at last 5 year average rate)Average annual net price to undergraduate students, 2010–2011(Including financial aid, discounting, etc. – source: National Center for Education Statistics)Midwestern Public UniversitiesMichigan TechUniversity of Michigan – Ann ArborMichigan StateWestern MichiganNorthern Michigan 15,024 (highest in Michigan) 14,074 12,366 14,672 10,952University of WisconsinUniversity of Illinois –Urbana - ChampaignUniversity of Minnesota – Twin Cities 14,940 15,610 16,019
Non-resident graduate tuition rates are among the lowest of all STEM schools(source financial aid office)Current Graduate tuition and feesUndergraduate in-state 2012Undergraduate out-of-state 2011 13,740/2 semesters. (In or out-of-state) 14,448/2 semesters. 27,720/2 semesters.Raising non-resident graduate tuition to peer average 1100/credit yields approximately 5M/year.GraduateSchoolMichiganTechUniversity ofMichiganWayne StateMichiganStateWesternMichiganTexas A&MUniversity ofIllinoisNon-residentGraduatecost perSchoolcredit (2012) 744University ofWisconsin 2330Georgia Tech 1215 1173 1105 720(9 cred/sem) 1363Non-residentcost percredit (2012) 1575 1310Virginia TechMinnesota DuluthUniversity ofMinnesotaPurdue 1123 1860LouisianaTech 724* 1880 1656*quarters equatedto semestersPer semester – from Graduate School annual report – 2010.N.B. – Louisiana Tech was incorrectly calculated per quarter.
How much do employee/faculty costs drive the tuition increase?Michigan Tech’s retirement obligations – MPSERS (10 percent of payroll) obligationis outgrowing TIAA-CREF. Currently it is almost 50% of the total retirement obligation.(audited financial statements)2009 MPSER obligation2010 MPSER obligation2011 MPSER obligation2012 MPSER obligation 4.87 million 4.67 million 5.14 million 5.76 million2009 TIAA-CREF obligation2010 TIAA-CREF obligation2011 TIAA-CREF obligation2012 TIAA-CREF obligation 7.92 million 7.17 million 5.96 million 6.15 millionMedical benefit claims paid by Michigan Tech have grown 25% (CPI adjusted) since 2006.Since 2008 there has been 5% growth (CPI adjusted). There has been negative growthusing the Medical CPI index. The vast majority of the actual increase in healthcare costshave been paid by those covered. (FY basis - audited financial statements)20062007200820092010201120122013 10,984,366 12,041,986 13,875,743 13,980,633 14,310,670 14,748,919 15,735,827 14,500,000 (projected by BCBS for CY13)
Total employee benefit costs to Michigan Tech are up slightly since 2006.Up 12% (CPI adjusted) since 2006, number of employees up 15% over same period.Benefits down 1.7% (CPI adjusted) since 2008. (audited financial statements, compendium)2006 28,901,3002007 31,010,0002008 35,802,8192009 35,859,2512010 34,709,9502011 35,124,3592012 37,803,478Average total compensation and benefits per instructor have fallen since 2006Minus 1% in actual dollars, minus 15% CPI adjusted (2006 dollars), this is due to raises at or below theCPI, cuts in benefits, and because similar total costs are being incurred for 25% more junior faculty.Current fund expenditures are up 41% (23% CPI adjusted) over the same period. (source: audited financialstatements & tionalCompensation &Benefits 38,559,398 39,975,030 43,292,487 46,729,720 47,987,133 47,812,865 47,866,389General FundInstructionalExpenditures 44,317,174 45,879,482 49,316,020 53,425,533 54,767,561 54,713,867 55,128,119Unrestrictedcurrent fundexpenditures 140,827,244 151,679,361 166,313,946 179,326,092 187,242,616 191,434,074 198,550,847Tenure/Tenuretrack facultyNon-tenuretrack faculty317310312329342354--104855575855--
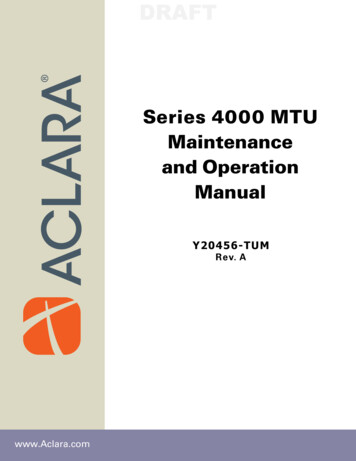
How about institutional costs?Total DebtTotal debt increased at 7M/yr. ( 10M/yr. including interest) over last decade (Auditedfinancial statements). This is a chiefly a result of bonded debt that has been issuedsince 2003. Debt outstanding as of June 30, 2012 is 84M, and the combined principaland interest are 144M. We now spend 6M/year on debt service; a portion of whichmay be associated with revenue lines (e.g. residence 2 11,396,000 17,198,000 51,023,286 50,274,702 49,517,956 51,131,794 50,904,532 56,112,688 73,113,673 82,496,244 84,516,392
Costs of expanding and maintaining our physical plant.Increase of almost 1,000,000 sq. ft. over last 20 years (@ 5 to 7/sq ft per year maintenance).Approximately 100 sq. ft. added per person (students, staff, faculty) on campus.M&MDowRoszaLittle HuskiesForestry expansionLakeshore CenterMineral MuseumRehki buildingOpie LibraryHillside PlaceATDCGreat Lakes Research CenterBlizzard buildingAlternative energy centerKRC, Engineering design centerMiscellaneous (Gundlach, etc.)AER laboratories (proposed 4,600122,500Total additional space1,029,500 square feet
Academic support is up slightly over the past few years( 10.7M in 2006 to 11.5 M in 2012)Academic support includes: (1) Library operations, (2) Academic IT, (3) CTLF, (4) marketing and communications, (5)corporate relations and intellectual property, (6) research services, (7) the graduate school, (8) learning centers.But Institutional support expenses are up 70% in 6 years*(Audited financial statements)Institutional support includes (1) central executive-level activities concerned with management and long-rangeplanning of the entire institution, such as the governing board, planning and programming, and legal services; (2)fiscal operations, including the investment office; (3) administrative data processing; (4) space management; (5)employee personnel and records; (6) logistical activities that provide procurement, storerooms, safety, security,printing, and transportation services to the institution; (7) support services to faculty and staff that are notoperated as auxiliary enterprises; and (8) activities concerned with community and alumni relations, includingdevelopment and fund raising. 4431/student (Highest in state)2006200720082009201020112012 18,027,340 20,858,727 24,364,292 28,393,021 27,429,468 29,045,690 30,686,476*Incorrectly categorizing some expenditures (e.g.- as institutional instead of academic support) may partially accountfor this growth, but the combined growth of these 2 areas is in excess of 40% over this period (17% CPI adjusted).
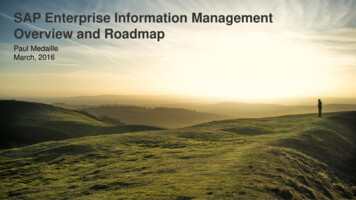
Can Research Dollars Help MTU’s Finances?External dollar expenditures have been increasing somewhat. They are up 71% over 10 years. (3%/year CPI adjusted).Internal and external research expenditures (source: compendium & rnalInternalExternalInternalExternalInternal 22.79 M 7.21 M 23.88 M 11.79 M 24.25 M 19.95 M 36.16 M 24.20 M 34.49 M 28.98 M 38.90 M 31.18 M 39.07 M 32.92 MHowever internal research expenditures are up 357% over the past 10 years. ( 20%/year CPI adjusted)Internal research expenditures include: IRAD, general fund salaries charged to research, start- up funds, required cost share,Graduate Assistant Cost Share (GACS), Indirect costs (Facilities & Administrative F&A) on cost share and waivers of indirects(F&A) on sponsor funds, research related gifts, use charges & Summer Undergraduate Research.
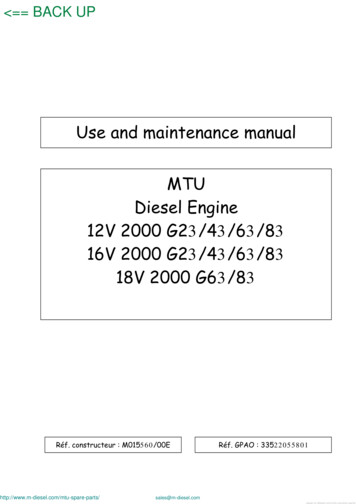
Sponsored Program AwardsHowever, new dollar awards are lower (about 25 %) over the past 2 al - Gifts200220042006Federal - Non-ARRA20082010Federal - With ARRAFrom President’s Campus Forum Oct.8, 201220122014
Paths Forward? Lots of options, but no easy solutions.Align budget with strategic plan to get a workable business plan.Further undergraduate tuition increases? Market price elasticity uncertain, especially for non-STEM fields. State restrictions on tuition increases. Student debt crisis. Average MTU student graduates with 31K in debt.Reduce both tuition and tuition discounting Discounting currently very high (40%), reduce discounting to peer and regional levels (30%). Attract more students with lower “sticker” price. Good publicity with public and legislature.Match market prices for graduate education? Now need 2 non-resident grad students to generate tuition of 1 non-resident undergrad. Increasing graduate tuition to market price nets additional 4-5M/year. Loss of competitiveness in grants and declines in graduate enrollment?Adjustments in compensation? Levels consistent with strategic plan? (Michigan Tech falling far behind in Oklahoma State salary survey). Further cuts in benefits are extremely regressive, lower paid employees already hit hardest. MPSER obligation relief. (We send almost 13% of state appropriation back.)Restrict new debt and/or refinance current debt? Recent board action repackaging debt saved interest, but rolled in additional costs ( 1M) for SDC upgrades. Post-pone additional new buildings. No new capital outlays from state this year?Redesign academic programs? Better determine winners and losers (especially new programs) in line with the strategic plan. Pursue collaborative opportunities. (e.g. co-list courses across curriculum, collaborative Ph.D. programs, etc.) Further enhance center approach to research.
University of Michigan - Ann Arbor 14,074 Michigan State 12,366 Western Michigan 14,672 Northern Michigan 10,952 University of Wisconsin 14,940 . 2012 MPSER obligation 5.76 million 2012 TIAA-CREF obligation 6.15 million Medical benefit claims paid by Michigan Tech have grown 25% (CPI adjusted) since 2006.