Transcription
Relative EarthquakeHazard Map for theVancouver, Washington,Urban Regionby Matthew A. Mabey, Ian P. Madin,and Stephen P. PalmerWASHINGTONDIVISION OF GEOLOGYA ND EARTH RESOURCESGeologic Map GM-42December 1994The information provided in this map cannot besubstituted for a site-specific geotechnica/ investigation, which must be performed by qualified practitioners and is required to assess the potential forand consequent damage from soil liquefaction, amplified ground shaking, landsliding, or any otherearthquake hazard.Location ofquadrangles. Natural ResourcesWASHINGTON STATE DEPARTMENTOFJen nifer M. Belcher- Commissioner of Public LandsKaleen Cott ingham - Sup ervisor
Relative EarthquakeHazard Map for theVancouver, Washington,Urban Regionby Matthew A. Mabey, Ian P. Madin,and Stephen P. PalmerWASHINGTONDIVISION OF GEOLOGYAND EARTH RESOURCESGeologic Map GM-42December 1994The information provided in this map cannot besubstituted for a site-specific geotechnical investigation, which must be performed by qualified practitioners and is required to assess the potential forand consequent damage from soil liquefaction, amplified ground shaking, landsliding, or any otherearthquake hazard.WASHINGTON STATE DEPARTMENTOFNatural ResourcesJennifer M. Belcher- Commissioner of Public LandsKaleen Cottingham - SupervisorDivision of Geology and Earth Resources
DISCLAIMERThis report was prepared as an account of work sponsored byan agency of the United States Government. Neither theUnited States Government nor any agency thereof, nor any oftheir employees, makes any warranty, express or implied, orassumes any legal liability or responsibility for the accuracy,completeness, or usefulness of any information, apparatus,product, or process disclosed, or represents that its use wouldnot infringe privately owned rights. Reference herein to anyspecific commercial product, process, or service by tradename, trademark, manufacturer, or otherwise, does not necessarily constitute or imply its endorsement, recommendation,or favoring by the United States Government or any agencythereof. The views and opinions of authors expressed hereindo not necessarily state or reflect those of the United StatesGovernment or any agency thereof.WASHINGTON STATE DEPARTMENT OF NATURAL RESOURCESJennifer M. Belcher-Commissioner of Public LandsKaleen Cottingham-SupervisorDIVISION OF GEOLOGY AND EARTH RESOURCESRaymond Lasmanis-State GeologistJ. Eric Schuster-Assistant State GeologistWilliam S. Lingley, Jr.-Assistant State GeologistThis project was supported by the Department of the Interior, U.S.Geological Survey, under award number 1434-93-G-2318, as partof the National Earthquake Hazard Reduction Program. The viewsand conclusions contained in this document are those of the authorsand should not be interpreted as necessarily representing the official policies, either expressed or implied, of the U.S. Government.This report is available from:PublicationsWashington Department of Natural ResourcesDivision of Geology and Earth ResourcesP.O. Box 47007Olympia, WA 98504-7007This publication is free. Mail orders must be prepaid. Please add 1.00 to each order for postage and handling. Make checks payableto the Department of Natural Resources.Pamphlet and map printed011acid-free paper.Printed in the United States of America
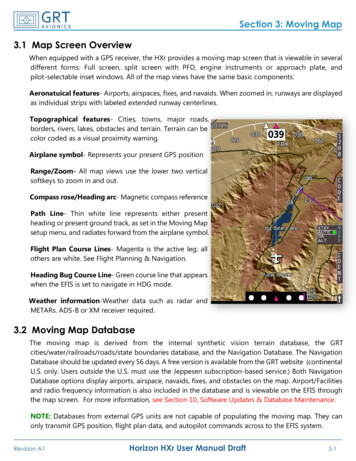
Relative Earthquake Hazard Map for theVancouver, Washington, Urban RegionMatthew A. Mabey and Ian P. MadinOregon Department of Geology and Mineral IndustriesBox 28Portland, OR 97232-2162Stephen P. PalmerWashington Department of Natural ResourcesDivision of Geology and Earth ResourcesP.O. Box 47007, Olympia, WA 98502-7007INTRODUCTIONstructure, and the construction details of the structure.At present the potential earthquake sources in the Vancouver area are not sufficiently well understood to permit an exactassessment of the size and location of future earthquakes. Ourassessment of the seismic hazards is based on detailed geologic mapping of the greater Vancouver region and state-ofthe-practice analyses of specialized geophysical and geotechnical measurements. Plates 1 and 2 cannot be used to directlyascertain either (1) which of the hazards may affect a particular site during an earthquake or (2) the severity of these hazards and the likelihood of catastrophic consequences. Only asite-specific geotechnical investigation performed by a qualified practitioner can adequately assess the potential for andconsequent damage from soil liquefaction, amplified groundshaking, landsliding, or any other earthquake hazard.Each of the three earthquake hazards considered in thisstudy is a distinct and separate phenomenon. When they act inconcert, the severity of the total hazard dramatically increases.As an example, the buildings damaged or destroyed in the Marina District in San Francisco during the 1989 Loma Prietaearthquake were subject to both strongly amplified groundDuring the late 1980s, the scientific understanding of earthquake hazards in the Vancouver metropolitan area advancedsignificantly. It is now widely accepted that damaging earthquakes much larger than any in the historical record are possible and that it will be necessary to employ a wide variety ofmitigation measures to minimize economic losses and casualties resulting from these future earthquakes. These mitigationmeasures should be based on a thorough assessment of thelikely extent and distribution of earthquake damage.The accompanying mapping is a synthesis of our assessment of three specific hazards associated with future earthquakes in the Vancouver urban area-Plate 1 covers the western half, and Plate 2 covers the eastern half. They are presented as two halves of one map product intended to provideland-use planners, emergency-response personnel, businessowners, and private citizens with a qualitative assessment ofthe relative degree of the earthquake hazard throughout theVancouver area. The mapping covers the Vancouver and Orchards 7 .5-minute quadrangles and the portions of the Portland and Mount Tabor 7 .5-minute quadrangles in WashingtonState (Fig. 1). Similar relative earthquake hazard maps have been producedfor the portions of the Portland andMount Tabor 7 .5-minute quadranglesin Oregon.Three earthquake hazards wereevaluated: soil liquefaction, amplification of ground shaking, and earthquake-induced landsliding. Maps delineating areas more or less susceptibleCLARK COUNTYto each of these hazards were mergedinto a combined hazard map (presentedas Plates 1 and 2) for the urban area. Inthis combined hazard map, we segregated the study area into four hazardcategories, ranging from the most hazardous (category A) to the least hazardous (category D). The rankings arerelative because they can only be usedto compare the combined hazard at aI Igiven location to that at some other loI ,. s III rsI "', Ication in the study area. These rankingsL . .Jcannot be used to predict the level ofMAP LOCATIONstructural damage resulting from thesehazards during an earthquake. The actual damage will depend on the location and size (magnitude) of the earthFl ure 1. Location map showing the boundaries and names of the 7.5-minute quadrangles covquake, the site-specific response of theering the Vancouver urban area and the study area. The stippled pattern corresponds to the areasoil and geologic material beneath theshown on Plate 1, and the hatched pattern corresponds to the area shown on Plate 2.1
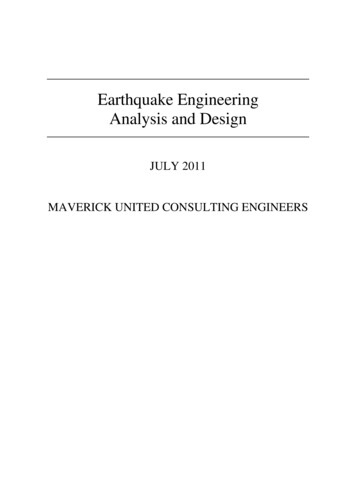
2GEOLOGIC MAP GM-42shaking and widespread liquefaction of the underlying soils.The distinction between each of the hazards is important totechnical specialists, but it is not as useful to a nontechnicalaudience. We resolved that a single map expressing the totalseverity of the combined individual hazards would be the mosteffective way to present this information to nonspecialists.All of the seismic hazard analyses were compiled and recast as a map using a Geographical Information System (GIS).Because these maps and the supporting analyses have been developed as data layers in a GIS environment, they can easilybe incorporated with specific earthquake source informationto produce scenarios that can be used in emergency responseplanning, facility siting studies, lifeline vulnerability assessment, etc.·.-:·.·.d fuca 2RldgeNorthAmericaplateSOURCES OF EARTHQUAKESScientific research conducted in the last decade has greatlyincreased our understanding of the sources of earthquakesthat could cause major damage in western Washington. Wenow understand that three distinct types of earthquakes mayaffect the Vancouver region.Crustal earthquakes occur between 5 to IO miles (8 to 16kilometers) below the surface along shallow faults in theEarth's crust; this is the type of earthquake that affects mostof California. The Scotts Mills earthquake that occurred innorthwest Oregon on March 25, 1993, was a shallow crustalearthquake. At magnitude 5.6, this was the largest earthquakein the Portland-Vancouver area since the 1962 magnitude 5.5Portland earthquake, which was also a shallow crustal eventthat actually occurred beneath downtown Vancouver.In the past few decades, earth scientists have recognizedthat the outer crust of the earth is composed of a small numberof mobile plates. The Pacific Northwest (British Columbia,Washington, Oregon, and northern California) lies on the leading edge of the North America plate where it overrides theJuan de Puca plate (Fig. 2). The process of plate convergenceis termed subduction, and the boundary of the two plates istermed the subduction zone. Estimates of the relative movement between the Juan de Puca and North America plates suggest that they are converging at approximately 1 to 1.5 inchesper year (3 to 4 centimeters per year). Worldwide, subductionzones are typically expressed as deep submarine troughs, ortrenches, that lie offshore of a landmass. In Washington andnorthern Oregon, the Cascadia subduction zone starts at a subdued trench about 50 miles (80 kilometers) offshore at the baseof the continental slope. In the subduction zone, the Juan dePuca plate is pushed beneath the North America plate (Fig. 2).Consequently, the Juan de Puca plate is at a depth of approximately 30 miles (50 kilometers) beneath Vancouver.lntraplate earthquakes occur as the Juan de Fuca plate breaksup beneath the North America plate. The 1949 and 1965Puget Sound earthquakes (magnitudes 7 .1 and 6.5, respectively) were intraplate earthquakes. Those who lived in Vancouver in 1949 may recall that Portland suffered some damaging and frightening effects during that earthquake, eventhough the epicenter was nearly 125 miles (200 kilometers)away. Small (magnitudes less than 3) intraplate earthquakesoccur as far south as the Portland area, and there is some possibility that a large intraplate earthquake could occur closerto Vancouver.Ir\ Jan ./PacificplateCascadeRangeJuande Fucaplatenot to scaleNorthAmericaplate'''Figure Z. (Top) Map showing the geometry of the North America andJuan de Fuca plates. Arrow indicates the motion of the Juan de Fucaplate relative to a fixed (nonmoving) North America plate. The barbedline indicates the line of convergence of the two plates and the approximate location of the trench. (Bottom) A vertical slice through the earth(cross section) showing the Juan de Fuca plate thrust beneath the NorthAmerica plate.Subduction zone earthquakes occur when two convergingplates, such as the Juan de Fuca and North America plates,become 'stuck' together along their interface directly downdip from the trench. As the plates continue to converge, thestrain energy across this locked interface builds until theplates abruptly slip along the interface as the strain is released. This unlocking and slippage causes an earthquake.Subduction zone earthquakes are consistently among themost powerful recorded. For example, the 1964 Good Friday
RELATIVE EARTHQUAKE HAZARD MAP FOR THE VANCOUVER, WASHINGTON, URBAN REGIONearthquake in southern Alaska caused large land-levelchanges and severe damage throughout southern Alaska (including Anchorage), and the tsunami generated by the earthquake destroyed a number of coastal villages and towns inAlaska and the Pacific Northwest. The Good Friday earthquake had a magnitude of 9.2 and is the second largest earthquake this century.Geological research initiated in the mid-1980s has demonstrated that large subduction zone earthquakes have occurredin the Pacific Northwest, although none has occurred duringour historical record, which extends back about 200 years.These studies indicate that around the year 1700 there was alarge earthquake on the Cascadia subduction zone along theOregon and Washington coast. Geologic evidence left by thisevent includes indications of land-level changes similar tothose near Anchorage in 1964, sand deposited by a large tsunami that immediately followed the earthquake, and signs ofsoil liquefaction occurring possibly as far inland as the SandyRiver delta and Reed Island, approximately 15 miles (25 kilometers) east of Portland. Further investigation has shown thatthere have been several other subduction zone earthquakes offthe northwest Oregon and southwest Washington coast in thelast few thousand years and that they occurred every 400 to600 years on average. There is every reason to believe thatsimilar earthquakes will occur in the future.The Vancouver urban area faces a more significant earthquake hazard than is indicated by the historical record, eventhough there is currently significant uncertainty about the exact location, size, and timing of future earthquakes. It is certain, however, that damaging earthquakes will be a part of theVancouver area's future.EARTHQUAKE EFFECTSThe relative hazard map (Plates 1 and 2) presented in this report is based on our evaluation of three earthquake effects:amplification of ground shaking, soil liquefaction, and earthquake-induced landsliding.Ground Shaking AmplificationThe intensity of the ground shaking caused by an earthquakecan be significantly modified by the soils and poorly consolidated sedimentary rocks near the surface. This modificationcan increase (or decrease) the strength of shaking or changethe frequency content of the shaking. For example, the shaking could be changed from a rapid vibration (like a jet flyinglow overhead) to a long rolling motion (like being on a boatin a storm). The nature of these modifications is determinedby the thickness of the geologic materials and their physicalproperties, such as shear-wave velocity. Using measurementsof these characteristics, sophisticated computer programs canestimate the effects of the local geology on ground shakingand can broadly delineate areas where the ground shakingwill tend to be strongest.Mapping of the amplification resulting from near-surfacegeology has been done in other areas, such as the San Francisco Bay region and Mexico City. For example, damage to theNimitz Freeway during the Loma Prieta earthquake was confined to areas of the Cyprus Street Viaduct where the groundshaking was strongly amplified by near-surface soft soils.These areas had been previously recognized and delineated as3prone to strong amplification of ground shaking. Recent studies of the Loma Prieta earthquake have shown that the majorityof the total property loss was concentrated in areas with significantly amplified ground shaking.Soil LiquefactionLiquefaction is a phenomenon in which strong shaking of asoil causes it to rapidly lose its strength and to behave morelike a liquid than a solid. Typically, loose sandy soils thathave been deposited in the last few thousand years are mostsusceptible to liquefaction. However, liquefaction will onlyoccur if all pore space between sand grains is filled with water(that is, the sand is saturated). Soil liquefaction is typicallytriggered by strong ground shaking during a large earthquake.When soil strength is lost during liquefaction, the consequences can be catastrophic. For example, the liquefied soillayer, and everything lying on top of it, can move downhill,even on very shallow slopes. Movement of liquefied soils canrupture pipelines, move bridge abutments, and pull apart thefoundations and walls of buildings. Buried objects, such as underground storage tanks, can float upward through the liquefied layer, and heavy objects, such a tall buildings, can sinkinto it. Liquefaction and consequent ground movement causedmassive damage to highway and railway bridges throughoutsouthern Alaska during the 1964 Good Friday earthquake.Earthquake-Induced LandslidingLandslides are a problem familiar to inhabitants of the PacificNorthwest. They occur when the soil on a slope does not havesufficient strength to resist the downslope force due to thesoil's weight. The shaking resulting from an earthquake tendsto cause existing landslides to move as the shaking simplyadds to the downhill force driving the failure. Likewise,earthquakes can create new landslides where the strength ofthe soil is exceeded by the dynamic forces caused by theearthquake shaking.The steepness of a slope and thickness of soils are indicators of the slope's landslide potential. In addition, existinglandslide masses can be identified and mapped. By investigating these known landslides, criteria can be developed that willallow delineation of other potentially unstable slopes. Landslide hazard maps developed using this general approach havebeen produced for many urban areas, including Clark County.RELATIVE EARTHQUAKE HAZARD MAPWe evaluated three earthquake hazards (ground shaking amplification, liquefaction, and landsliding) and prepared mapsdelineating areas more or less susceptible to each of thesehazards. The resulting relative earthquake hazard map showswhich areas will have the greatest tendency to experiencedamage due to any one of, or a combination of, these individual hazards.A qualitative rating scale ranging from Oto 3 was devisedas part of the mapping of each individual hazard. A O ratingwas assigned to areas having the lowest likelihood of beingaffected by the hazard, and areas having the greatest likelihoodwere assigned a rating of 3. For every point in the map area,the rating for each individual seismic hazard was squared andthe resulting numbers were summed. The square root of thissum was then rounded to the nearest whole number. A result
4GEOLOGIC MAP GM-42of 4 was assigned to category A (the highest relative hazardrating), a result of 3 was assigned to category B, etc. CategoryD was assigned to a numerical result of 1. In this rankingscheme, a numeric result of O or 5 is theoretically possible, butin practice neither value is likely to occur. In those instanceswhere a O or 5 rating did occur, they were assigned respectively to the Dor A category on the relative hazard map.Example: Suppose that the block that includes yourhouse had a ground shaking amplification rating of 2,a liquefaction rating of 2, and a landslide rating of 0.We would take the ground shaking amplification rating of 2 and square it to get 4. We would do the samewith the liquefaction rating and also get 4. Squaringthe landslide rating of zero gives zero. So we add 4 4 0 to get a sum of 8. The square root of 8 is 2.828,which rounds to 3, placing your block in a category Brelative hazard rating. Because B is the next to thehighest rating, your block is thus of greater concern,from an earthquake hazard standpoint, than would bea block a few miles away that has a hazard rating of D.Generally, areas with a high rating (3) from a single individual earthquake hazard (for example, liquefaction) have arelative hazard rating of B (next to highest overall hazard rating) for that area. The highest relative hazard category (A)typically results from a high rating for two or more individualhazards (for example, both liquefaction and amplification).However, a relative hazard rating of B can result from a singlevery severe hazard that may result in considerable propertydamage. In fact, 48 percent of the study area comprises category A and B hazard zones, and the remaining 52 percent fallsin category zones C and D. Thus, categories A and B representa relative hazard higher than 'average' in the Vancouver area,and similarly categories C and D represent a relative hazardlower than 'average'. The highest relative hazard category (A)covers only 10 percent of the map area and is primarily concentrated in the present flood plain of the Columbia River andtributary creeks.site-specific response of the soil and geologic material beneath the structure, and the construction details of the structure.At present the potential earthquake sources in the Vancouver area are not sufficiently well understood to permit an exactassessment of the size and location of future earthquakes. Ourassessment of the seismic hazards is based on detailed geologic mapping of the greater Vancouver region and state-ofthe-practice analyses of specialized geophysical and geotechnical measurements. This map cannot be used to directly ascertain either (1) which of the hazards may affect a particularsite during an earthquake or (2) the severity of these hazardsand the likelihood of catastrophic consequences. Only a sitespecific geotechnical investigation performed by a qualifiedpractitioner can adequately assess the potential for and consequent damage from soil liquefaction, amplified ground shaking, landsliding, or any other earthquake hazard.ACKNOWLEDGEMENTSWe greatly appreciate the contribution of Carl Harris, Division of Geology and Earth Resources, to this study throughhis expertise in GIS manipulation of the map data and cartographic rendering of the GIS map files as the final printedmap. We thank Dan Meier, Woodward-Clyde and Associates,for his outstanding job managing the geotechnical drillingand testing phase of this study. We also thank Beth Reynosaof the Port of Vancouver for her help in compiling theagency's geotechnical reports and data and the GeotechnicalBranch, Materials Laboratory, Washington Department ofTransportation, for allowing access to their geotechnicalfiles.This project was supported by the Department of the Interior, U.S. Geological Survey, under award number 1434-93-G2318, as part of the National Earthquake Hazard ReductionProgram. The views and conclusions contained in this document are those of the authors and should not be interpreted asnecessarily representing the official policies, either expressedor implied, of the U.S. Government.SUMMARYWe evaluated three earthquake hazards (soil liquefaction, amplification of ground shaking, and earthquake-induced landsliding) and constructed maps of the Vancouver region delineating areas more or less susceptible to each of thesehazards. These individual hazard maps were combined into arelative earthquake hazard map presented as Plates 1 and 2.This map subdivides the Vancouver urban area into four categories of relative earthquake hazard ranging from the mosthazardous (category A) to the least hazardous (category D).Categories A and B represent a relative hazard higher than'average' in the Vancouver area, and similarly categories Cand D represent a relative hazard lower than 'average'. Only10 percent of the study area, mainly concentrated in the present flood plain of the Columbia River, falls in the highestcategory of relative earthquake hazard. The category rankingsare relative because they can only be used to compare thecombined hazard at a given location to that at some other location in the study area. These rankings cannot be used topredict the level of structural damage resulting from thesehazards during an earthquake. The actual damage will dependon the location and size (magnitude) of the earthquake, theSELECTED REFERENCESTechnicalFiksdal, A. J., 1975, Slope stability of Clark County, Washington:Washington Division of Geology and Earth Resources Open-FileReport 75-10, 4 p., 1 plate, scale 1:62,500.Mabey, M. A.; Youd, T. L., 1991, Liquefaction hazard mapping forthe Seattle, Washington urban region utilizing LSI; Final technical report-Program element III, Geologic and seismic hazardevaluation and synthesis; Objective 1(4), Studies of liquefactionand landsliding, and other ground failure problems that affect theSeattle-Portland urban regions: Brigham Young University Technical Report CEG-91-01 [under contract to] U.S. Geological Survey, 64 p.Madin, I. P., 1990, Earthquake-hazard geology maps of the Portlandmetropolitan area, Oregon-Text and map explanation: OregonDepartment of Geology and Mineral Industries Open-File Report0-90-2, 21 p., 8 plates.Madin, 1. P.; Swanson, R. D., 1992, Earthquake-hazard geology mapsof southwestern Clark County: Intergovernmental Resource Center [Vancouver, Wash.], 5 p., 2 plates.
RELATIVE EARTHQUAKE HAZARD MAP FOR THE VANCOUVER, WASHINGTON, URBAN REGIONPhillips, W. M., compiler, 1987, Geologic map of the Vancouverquadrangle, Washington: Washington Division of Geology andEarth Resources Open File Report 87-10, 27 p., 1 plate, scale1:100,000.Weaver, C. S.; Baker, G. E., 1988, Geometry of the Juan de Puca platebeneath Washington and northern Oregon from seismicity: Seismological Society of America Bulletin, v. 78, no. 1, p. 264-275.Weaver, C. S.; Smith, S. W., 1983, Regional tectonic and earthquakehazard implications of a crustal fault zone in southwestern Washington: Journal of Geophysical Research, v. 88, no. B12,p. 10,371-10,383.Yelin, T. S.; Patton, H.J., 1991, Seismotectonics of the Portland, Oregon, region: Seismological Society of America Bulletin, v. 81,no. 1, p. 109-130.NontechnicalBott, J. D. J.; Wong, I. G., 1993, Historical earthquakes in and aroundPortland, Oregon: Oregon Geology, v. 55, no. 5, p. 116-122.Cope, Vern, 1994, The Washington earthquake handbook-An easyto-understand information and survival manual: Vern Cope [Portland, Ore.], 145 p.Dehlinger, Peter; Berg, J. W., Jr., 1962, The Portland earthquake ofNovember 5, 1962: Ore Bin, v. 24, no. 11, p. 185-192.Gere, J.M.; Shah, H. C., 1984, Terra non firma-Understanding andpreparing for earthquakes: W. H. Freeman and Company, 203 p.Iacopi, Robert, 1971, Earthquake country: Lane Books [Menlo Park,Calif.]. 160 p.Mabey, M. A.; Madin, I. P., 1993, Relative earthquake hazard map ofthe Portland, Oregon 7 1/2-minute quadrangle: Metro [Portland,Ore.]. 14 p., 1 pl.Mabey, M. A.; Madin, I. P.; Meier, D. B.; Palmer, S. P., in press,Relative earthquake hazard map of the Mount Tabor quadrangle,Multnomah County, Oregon, and Clark County, Oregon: OregonDepartment of Geology and Mineral Industries GMS-89.Madin, I. P.; Priest, G. R.; Mabey, M.A.; Malone, S. D.; Yelin, T. S.;Meier, Dan, 1993, March 25, 1993, Scotts Mills earthquake-5Western Oregon's wake-up call: Oregon Geology, v. 55, no. 3,p. 51-57.May, P. J.; Fox, Edward; Hasan, N. S., 1989, Earthquake risk reduction profiles-Local policies and practices in the Puget Sound andPortland areas: University of Washington Institute for Public Policy and Management, 73 p.Noson, L. L.; Qamar, Anthony; Thorsen, G. W., 1988, Washingtonstate earthquake hazards: Washington Division of Geology andEarth Resources Information Circular 85, 77 p.Perkins, J. B.; Moy, K. K., 1989, Liability of local government forearthquake hazards and losses-A guide to the law and its impactsin the States of California, Alaska, Utah, and Washington; finalreport: Association of Bay Area Governments [Oakland, Calif.],52p.Seattle Planning Department, 1992, Seismic hazards in Seattle: Seattle Planning Department, 53 p.Sunset Magazine, 1982, Sunset special report-Getting ready for abig quake: Lane Publishing Co., 12 p.Sunset Magazine, 1990, Sunset's guide to help you prepare for thenext quake: Sunset Publishing Corporation, 16 p.Wong, Ivan; Hemphill-Haley, Mark; Salah-Mars, Said, 1993, TheScotts Mills, Oregon, earthquake on March 25, 1993: Earthquakesand Volcanoes, v. 24, no. 2, p. 86-92.Wong, I. G.; Silva, W. J.; Madin, I. P., 1990, Preliminary assessmentof potential strong earthquake ground shaking in the Portland,Oregon, metropolitan area: Oregon Geology, v. 52, no. 6, p. 131134.Wong, I. G.; Silva, W. J.; Madin, I. P., 1993, Strong ground shakingin the Portland, Oregon, metropolitan area-Evaluating the effects of local crustal and Cascadia subduction zone earthquakesand near-surface geology: Oregon Geology, v. 55, no. 6, p. 137143.Yanev, Peter, 1974, Peace of mind in earthquake country-How tosave your home and life: Chronicle Books [San Francisco, Calif.],304p.
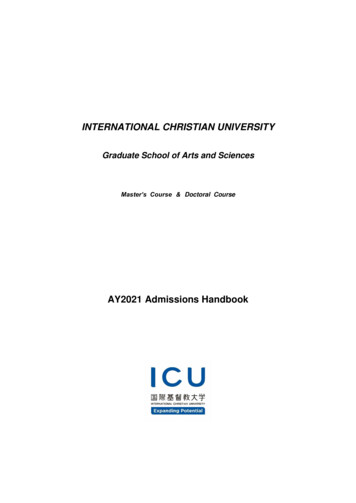
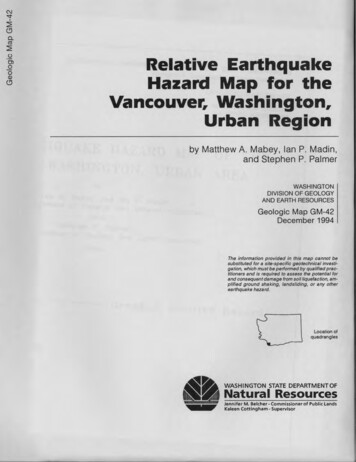
WASHINGTON DIVISION OF GEOLOGY AND EARTH RESOURCESRaymond Lasmanis, State GeologistWAS HI NGTON STATE DEPARTMENTOFNatural ResourcesGEOLOGIC MAP GM -42Jen nifer M . Be khN Commi ,sio nor of Publl r Land sKa le . n Cotti ngh am - Su p ervi so rPLATE 1 122 45'4 5 " ,15' ,---,1r,:c:,a.-.:"'66.RELATIVE EARTHQUAKE HAZARD MAP OF THEVANCOUVER, WASHINGTON, URBAN AREAI.lj 5.,.Iby·.:. . . o;(fr,f\,,;i . "63.N- . -. '. .·.'··t· . 1· .:,.,a·. : .f: . -i,I:': ·::: . . .: :. Y !ti.ta.I. ". ZONE BDZONE CDZONE DDOPEN WATER\.'I.·1 ·I .:. . I ."61Df.·"I::, . :,:1··.·-· ::.,:.:.-f' ., I.!.i'.cl·.42'30".-: 29'1,,IZONE A - - - - - - Greatest relative hazard1 50000 FEETl'.\11\SH l·:.;. . . . . ··.·.-. r·.- .,. V. ,"61andStephen P. Palmer,Washington Division of Geology and Earth Resources1994. .'Matthew A. Mabey and Ian P. Madin,Oregon Department of Geology and Mineral Industries,-.: .760 ODO FEET(OR!'.G I14VANCOUVER AND PORTLAND7.5-MINUTE QUADRANGLES.r, · -· ,. :.1i .,.'l. .- -;' . . .', I,-Least relative hazard: .:. . .". . I.:·.·:::.:". ."60:.T. 3 NT 3Nr,da!T 2NFl lT 2N .' This map is a synthesis of our assessment of geologic hazards associated with,[·::::··. . . :;,!:',: ;; :: .planners, emergency-response personnel, the business community, and private citizens -\'AN0CuVB. ,., . . .R,:1·;:J,( -r::,with a relative assessment of the overall earthquake hazard throughout the Vancouverarea., .
Vancouver area. The mapping covers the Vancouver and Or chards 7 .5-minute quadrangles and the portions of the Port land and Mount Tabor 7 .5-minute quadrangles in Washington State (Fig. 1). Similar relative earth-quake hazard maps have been produced for the portions of the Portland and Mount Tabor 7 .5-minute quadrangles in Oregon.