Transcription
CAD-based Target Identi cation in Range, IR and Color ImageryUsing On-Line Rendering and Feature PredictionJ. Ross BeveridgeMark R. StevensA liation of AuthorsDr. J. Ross Beveridge received his B.S. degree in Applied Mechanics and Engineering Science fromthe University of California at San Diego in 1980 and his M.S. and Ph.D. degrees in ComputerScience from the University of Massachusetts in 1987 and 1993 respectively. He has been anAssistant Professor in the Computer Science Department at Colorado State University since 1993.His present interests include object recognition, robot navigation, sensor fusion, image featureextraction, and software development environments for computer vision. He is a member of theARPA Image Understanding Environment Technical Advisory Committee.Mark R. Stevens received his B.S. degree in Computer Science from the University of Maine at Oronoin 1993, and his M.S. in Computer Science from Colorado State University in 1995. He is currentlyworking on his Ph.D. under Dr. Beveridge in the area of computer vision. His present interestsinclude object recognition, multi-sensor visualization, solid-modeling and neural computing. He isa member of IEEE, AAAI and ACM.Contact InformationJ. Ross Beveridge601 South Howes StreetColorado State UniversityComputer Science DepartmentFort Collins, Colorado 80523ross@cs.colostate.eduThis work was sponsored by the Defense Advanced Research Projects Agency (DARPA) Image Understanding Programunder grants DAAH04-93-G-422 and DAAH04-95-1-0447, monitored by the U. S. Army Research O ce, and the NationalScience Foundation under grants CDA-9422007 and IRI-95033661
AbstractResults for a mutlisensor CAD-based object recognition system are presented in the context ofAutomatic Target Recognition using nearly boresight-aligned range, IR and color sensors. The systemis shown to identify targets in test suite of 35 image triples. This suite includes targets at low resolution,unusual aspect angles, and partially obscured by terrain. The key concept presented in this work isthat of using on-line rendering of CAD-models to support an iterative predict, match and re ne cycle.This cycle optimizes the match subject to variability both in object pose and sensor registration.An occlusion reasoning component further illustrates the power of this approach by customizing thepredicted features to t speci c scene geometry. Occlusion reasoning detects occlusion in the rangedata and adjusts the features predicted to be visible accordingly.2
List of SymbolsSymbolFE (F )SCIRE (F )E (F )E (F )MM CM IM RCIREfit (F )Eom (F )Eoc (F ) E (F )w (s)SminSmax SSRS0M SSSMeaningCoregistration parametersMatch error given coregistration FA sensorColor sensorIR sensorRange sensorColor error given coregistration FIR error given coregistration FRange error given coregistration FWeighting term for combining the color errorWeighting term for combining the IR errorWeighting term for combining the range errorThe tness error for sensor S given coregistration FThe omission error for sensor S given coregistration FThe range occlusion error given coregistration FWeighting term for combining tness and omission errorThe Scaled match error given coregistration FThe scaling term for a given sensor SThe minimum value for a given sensor S used for scalingThe maximum value for a given sensor S used for scalingThe Scale value given sensor S3
1 IntroductionThe utility of CAD-based recognition techniques has long been recognized for industrial domains wheredetailed geometric models are available. It has also shown promise for Automatic Target Recognition 29,13]. However, ATR is a highly challenging object recognition domain: targets typically appear at lowresolution, sensor modalities other than visible light are typically most important, and targets are viewedagainst cluttered backgrounds. So far, many of the common techniques in CAD-based vision have adaptedpoorly to this domain.To adapt the best features that CAD-based recognition has to o er to the task of identifying vehiclesin multisensor data, we have developed a model-based ATR system 33] and tested it against what weconsider to be a demanding and realistic dataset 8]. The system is based on the conviction that a CADbased recognition system should utilize 3D models dynamically during recognition to make predictionsabout what features will be visible. Moreover, this prediction capability should be embedded within alocal optimization framework which converges upon the most globally consistent interpretation relativeto known object, sensor, and scene constraints.Our system uses graphics hardware to e ciently render a 3D object model using the believed cameraposition. From the rendered image, those features most likely to be detectable in imagery are selected formatching. A tabu search uses these features to explore variations in the object's 3D pose (position andorientation) relative to a sensor suite as well as the registration between heterogeneous, near-boresightaligned sensors. Search converges upon a precise 3D match between the CAD target model and range,IR and color imagery.The feature prediction process, being based upon graphical rendering, is quite exible and easilyextended to include additional salient constraints. One such constraint is the sun angle, which is neededto predict what aspects of an objects internal structure will stand out in visible light imagery. In a priorpaper 28], we described a system which uses the steps just described to precisely recover the pose of aknown 3D object given near-boresight-aligned range, IR and color imagery.This paper focuses on a signi cant extension for reasoning about scene occlusion and presents resultswhere the system is used to distinguish between modeled objects and thereby perform target identi cation. Occlusion reasoning takes advantage of the fact that we are fusing range and electro optical(EO) data. Since range data indicates directly which features are being obscured by objects closer tothe sensor, occlusion need not be treated as signal dropout. The feature prediction algorithm detectsevidence of occlusion in range data and modi es the predicted set of features for range, IR and color4
sensors accordingly.Of great importance is how well this CAD-based system is able to recognize targets. A series ofexperiments have been conducted on a test suite of 35 range, IR and color image triples containing fourdi erent military vehicles. From the study we have learned that the system is performing identi cationquite well, 77% correct, across the complete test set. Moreover, based on the conclusions of MIT LincolnLaboratory 38], this level of performance is unlikely to be reached using only traditional ATR imagespace representations (templates).The paper is broken down into six distinct sections. Section 2 contains a literature review describingthe works of other researchers as they pertain to our work. This is followed by a overview of the thegoals of our current system. Sections 4 and 5 overview the system including the occlusion reasoningcomponent. The next section presents results on our data set, and then conclusions and future work arediscussed.2 Relation to Prior WorkOur work draws upon the sensor fusion and CAD-based recognition literature. Most uses of CAD-basedrecognition focus upon a single sensor. For example, CAD models have been used for matching to 2Dimagery 14, 35, 9], 3D range data 3, 4], as well as multispectral imagery such as IR 29] and SAR 11].Typically these CAD systems rely on either the 3D or 2D geometry of the model to constrain the locationand appearance of that object in the imagery 25, 19, 20].With respect to sensor fusion, Aggarwal 1] nicely summarizes past work and notes that sensor fusionhas tended to emphasize single modality sensors. There is comparatively little work focusing on di erentsensor modalities. He states that relating data from di erent modalities is more di cult, in part becauseof issues of sensor alignment and registration. While Aggarwal 26] and others 31, 21, 16, 36] haveexamples of successful mixed-modality fusion, this is still a young research area.One solution to the problem of imperfectly aligned sensors is to use the CAD model geometry tosuggest how image registration needs to be adjusted 7]. Our current system employs such constraintswithin a closed loop rendering system for dynamic feature prediction. Our use of rendering to performfeature prediction within a matching loop exempli es an approach advocated by Besl 5] when he stressedthe potential value of graphical rendering to support object veri cation.Others have recognized the value of graphical rendering in support of object recognition. Wellshas used graphics hardware for the computation of model points for use in tracking faces in video5
sequences 22]. Sato has used computer graphics to recover re ectance models of objects spinning on aturntable 30]. Others have used rendering for the generation of imagery for statistical modeling 17, 39].Alternatively, we advocate an on-line prediction capability which performs the mapping from storedmodel to predicted features dynamically as part of the recognition process 28, 33]. A key to making thisapproach feasible is the development of algorithms which run many, if not all, computations in parallelon standard graphics acceleration hardware. This on-line capability supports a tight coupling betweenfeature prediction and matching: modifying the features expected to be visible as matching progresses.3 Multisensor Viewing Geometry: De ning CoregistrationUnderlying our whole approach is a concept we call coregistration. When performing sensor fusion frommultiple heterogeneous sensors, seldom if ever will the pixels from the di erent sensors be in a one-toone correspondence. Knowledge of sensor parameters and relative sensor positions provides moderatelyaccurate estimates of the pixel-to-pixel registration. However, small variations in relative sensor positioncan lead to signi cant mis-registration between pixels. This is of concern when matching objects, suchas targets, which are small in terms of absolute image size.In our problem of fusing ground-looking range, IR and color sensor data, it is safe to assume that oursensors are approximately boresight-aligned. Put simply, they are likely to be positioned quite close toeach other and to be looking in the same direction. We have prepared a detailed study of di erent sourcesof uncertainty in sensor-to-sensor alignment for near-boresight-aligned sensors 23]. A useful heuristicfrom this study is that over small rotations and restricted depth ranges, sensor-to-sensor rotation may beapproximated with simpler co-planar translation. Together the sensors are free to rotate and translaterelative to the object, but are constrained to permit only translation in a common image plane.In the remainder of this paper, the term coregistration will be used to describe the process of simultaneously adjusting both the 3D pose of the sensor suite relative to a modeled object as well as theplanar translation between sensors. For three sensors: range, color and IR, there are 10 coregistrationparameters: 6 encode the pose of the sensor suite relative to the target and 4 encode the relative planartranslation between pairs of sensors.4 Cuing the Multisensor Target Identi cation SystemWhile the focus of this paper is our multisensor identi cation system, in practice it must be used inconjunction with other algorithms which focus attention on a tractable number of possible target types6
and pose estimates. We have developed two upstream processes which together provide this cuinginformation. To provide context, these are brie y summarized.4.1 Cuing Step 1: Color DetectionTargets are rst detected using a new machine learning algorithm 12, 15] geared towards nding camou aged targets in multi-spectral (RGB) images. The goal of this stage is not to identify the type orposition of a target, but simply to detect where a target might be present, and to pass the resulting imageregions of interest (ROIs) to the hypothesis generation stage. In essence, the target detection algorithmserves as a focus of attention mechanism that directs the system's resources only towards those partsof the image that contain potential targets. Typically over 95% of an image can be dismissed as notcontaining targets after this step.4.2 Cuing Step 2: Hypothesis GenerationColor detection passes to the hypothesis generation algorithm a list of regions of interest (ROIs): boxesbounding possible targets. Each ROI is then analyzed and a list of most likely target types and posesis generated. A number of algorithms might ll this role, including perhaps geometric hashing techniques 2]. In our work, an existing boundary probing algorithm 10] developed by Alliant Techsystemshas been adapted to this hypothesis generation task. The LARS suite uses a non-segmenting model-basedapproach, which e ciently exploits the 2-D (boundary matching) shape information contained in rangesignatures. Templates are derived from BRL/CAD models of the expected target set, thus no trainingimagery is required.5 Multisensor Target Identi cationThe multisensor target identi cation stage fuses the imagery from all three sensors with the 3D CADtarget model in order to make a nal determination as to the type of the target. This section will rstreview the overall approach as presented in 28]. Next, the new extension to this system which enablesit to reason about scene occlusion will be presented.5.1 Interleaving Feature Prediction and Multisensor Target MatchingThe search process developed for coregistration matching uses an iterative generate-and-test loop (Figure 1) in which the current coregistration hypothesis, denoted as F , is used to predict a set of modelfeatures which are, in turn, used in an error evaluation function. A neighborhood of moves is then7
examined and the best move, the one with the lowest error, is taken. The features are re-generated forthe new coregistration estimate and the process continues. The three key elements in this process are:feature prediction, match evaluation, and local search. Each of these elements is described efinementNewCoregistrationFigure 1: Interleaving Feature Prediction, Coregistration Re nement and Matching5.1.1 On-line Model Feature PredictionHighly detailed Constructive Solid Geometry (CSG) models of target vehicles are available in BRL-CADformat 37]. We have already developed algorithms to convert these models to a level of detail moreappropriate for matching to the given sensor data 34, 32]. Another system, summarized here and fullydescribed in 27], has been developed to extract edge and surface information from these models.The feature prediction algorithm renders the vehicle using the current pose and lighting estimatesto infer which 3D components of the target will generate detectable features in the speci c scene. Eachrendered 3D surface is given a unique tag and the resulting image carries precise information about surfacerelationships as seen from the hypothesized viewpoint. From this information, the feature predictionalgorithm identi es those elements of the 3D model that generate the target silhouette. Prediction alsotakes account of lighting from the sun to identify signi cant internal structure.For range imagery, sampled surfaces are extracted from the 3D model using a process that simulatesthe operation of the actual range sensor. The target model is transformed into the range sensor's coordinate system using the initial estimate of the target's pose, and rays cast into the scene are intersectedwith the 3D faces of the target model. The same rendering step used to predict optical features is usedto lter the number of visible features for this range feature extraction algorithm.5.1.2 Match EvaluationThe goal of the search process is to nd an optimal set of coregistration parameters based upon measuresof delity between target model features predicted to be visible and corresponding features in the optical8
and range imagery. This measure of delity is expressed as a match error, which is lower for bettermatches. This match error may be written as:E (F ) 0 F 2 K(1)MThe argument, F , represents the coregistration of the sensors relative to the model. For a sensor tripleof IR, color and range, F 2 10 with 6 degrees-of-freedom (DOF) encode the pose of the sensor suiterelative to the target 2 DOF encode the co-planar translation of each optical sensor relative to the rangesensor.The error, E (F ), is divided into three main components: two weighted terms representing how wellthe 3D predicted edge structure matches the current color (E (F )) and IR (E (F )) imagery, anda weighted term representing how well the predicted sampled surface ts the range (E (F )) data.These terms may be combined to form the overall match error:MM CM IM RE (F ) MCEM C(F ) IEM I(F ) REM R(F )(2)where ( 1:0). Each sensor term can be further broken down into two weighted terms: anomission error and a tness error.CIREM S(F ) Efit (F ) (1 ; )Eom (F )SSS(3)SThe subscript (S ) is replaced with either C I R. The tness error Efit (F ) represents how well thestrongest features match (as determined by a threshold), and the omission error Eom (F ) penalizes thematch in proportion to the number of model features left unmatched. Omission introduces a bias in favorof accounting for as many model features as possible 6]. The tness error values are summarized below(see 28] for a through discussion).The optical tness error represents the delity of match between the 3D edge features and theunderlying image. The process of determining the error begins by projecting the predicted 3D modeledges into the optical imagery. Projection is possible because both the intrinsic sensor parameters andthe pose of the target are known. The gradient under each line is then estimated and converted to anerror normalized to the range 0 1]. Lines with weak gradient estimates are omitted.The range tness error represents how well the predicted 3D sampled surface model points t theactual range data. The error is based on the average distance from each model point to the correspondingnearest Euclidean neighbor. To reduce computation, only a subset of the range data is examined at anyone time. A bounding rectangle around the hypothesized target is formed within the 2D coordinateSS9
system of the range image. A 3D enclosing box is then derived by back-projecting the rectangle intothe 3D range sensor coordinate system. When seeking points to match to the 3D target model, only thedata points lying inside this box (within some margin of error) are examined. Matched points havingtoo great a Euclidean distance are omitted.5.1.3 Finding Locally Optimal MatchesMatch error is locally minimized through iterative improvement. The local improvement algorithmsamples each of the 10 dimensions of the coregistration space about the current estimate. Sampling stepsize is important and a general strategy moves from coarse to ne sampling as the algorithm convergesupon a locally optimal solution. The initial scaling of the sampling interval is determined automatically,based upon moment analysis applied to the current model and sensor data sets.A variant on local search, called tabu search, is used to escape from some local optima 18]. Tabusearch keeps a limited history and will explore uphill' for a short duration to climb out of local optima. Inthis problem, it turns out that the regeneration of predicted target features changes the error landscapeafter each move. This can, in turn, induce local optima which tabu search readily escapes.When tabu search fails to nd improvement in the current neighborhood, the resulting 10 values arereturned as the locally optimal coregistration estimate. Initial results of the search have shown that thelocal optima in color, IR, and range space do not usually coincide. By searching for the model in boththe optical and range imagery, local optima in each will be rejected in favor of a more jointly consistentsolution.5.2 Occlusion ReasoningOne of the main bene ts of multisensor ATR is the ability to reason about model feature occlusion.Since range sensor provides an estimated range to the target, the following observation can be made:having a range pixel located much closer to the sensor than expected supports the belief that the featureis occluded.The addition of occlusion reasoning to the existing system was fairly simple. We modi ed the systemto retain the model face associated with the sampled surface point predicted for matching. Then the closest Euclidean neighbor to each model point was found using the same method discussed in Section 5.1.2.If the nearest neighbor lies some xed distance (3 meters in our experiments) in front of the target, thenit is labeled as occluded.Once the point has been labeled as occluded, the match error for the range data is adjusted to remove10
this point from the predicted target signature. To accomplish this change, the match error was changedas follows:E (F ) Efit (F ) (1 ; )MAX (Eom (F ) Eoc (F ))(4)M Rwhere EocRRRRR( ) is a non-linear function of the ratio, r , of occluded versus the total possible visible features:R FEoc(R F8 if r 0:4 0 (r;0:4) 0:6if 0:4 r 0:6) :1if r 0:6(5)Initial experiments showed it was not enough to simply remove the features from the match that were believed to be occluded. The matching system quickly discovered the bene t of moving vehicles completelybehind a hillside, thus occluding all of the features, in order to send the error measure to zero.Once the changes to the range error was made, it again became obvious that we needed to removefeatures from the set used in matching to the optical imagery. Using the established link betweenthe model face and the associated sampled feature, we simply remove all lines from consideration forwhich the associated face is occluded. These edge features are completely neglected in the optical errorcomputation.Figure 2 shows an example of the multisensor matching algorithm with the occlusion reasoning. Inthis image, the bottom half of the M901 is occluded by the terrain. In the center of the Figure are tworange images, the top has the range with a grey-scale rendering of the vehicle and the bottom has thecolor image textured over range data. The left image shows the color image with the features determinedto be occluded in black. Similarly the IR image is on the right with the occluded features in white. Allother features were matched.Figure 2: Shot34 Occlusion Example11
6 Target Identi cation Results for the Fort Carson DatasetThis section rst introduces the dataset we use for testing. It then summarizes how well targets areidenti ed on 35 test cases.6.1 The Fort Carson DatasetIn November 1993, data was collected by Colorado State University, Lockheed-Martin, and Alliant Techsystems at Fort Carson, Colorado. Over 400 range, IR and color images were collected and this imageryhas been cleared for unlimited public distribution and Colorado State maintains a data distributionhomepage (http://www.cs.colostate.edu/ vision). This homepage also includes a complete databrowser for the color imagery. A 50 page report 8] describes each image, vehicles present, and ancillaryinformation such as time of day and weather conditions. Additional information on the sensor calibrationmay be found in 23].6.2 How Di cult is the Fort Carson Dataset?The Fort Carson dataset was designed to contain challenging target identi cation problems requiringadvancements to the state-of-the-art in ATR. We believe this goal has been met. To our knowledge,only one other organization has carried out target identi cation on this data, and that is the group fromMIT Lincoln Laboratory. The Fort Carson dataset has been used in part of the evaluation of their ownrange-only ATR system 24].The MIT group has also developed a set of correct-recognition performance curves that allow them topredict the best performance they can expect to achieve for given operating parameters (range, depressionangle, noise, etc). In the case of the Fort Carson dataset, their curve of correct recognition versus range(which translates into a number of pixels on target for any given angular pixel size) indicates that theirATR system should be capable of achieving close to 100% correct recognition on the easiest imagery ofthe datasets where the vehicles occupy about 712 pixels. The same curve also predicted poor results onall the other images in the Fort Carson datasets where the numbers of pixels on target are much smaller.Even worse performance is expected due to the number of less than ideal conditions, such as obscurationsand unusual viewing angles.6.3 Our Experiment DesignThirty ve distinct range, IR and color image triples from the Fort Carson dataset were used in thistest. These image triples represent over 90% of the total target views available in the dataset. The four12
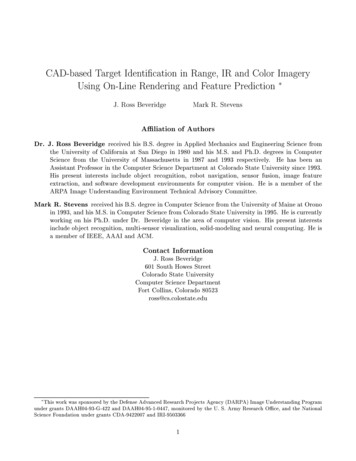
ImageryGround Truth Fort Carson dataset. 35 distinct shots, 1 target / shot. 1 IR, Range & Color triple / shot. 90 % of total shots. Target ID's, pose & sensor registration.5 Best Target-Pose HypothesesColor Detection Day & evenining training. Array specific sensitivity.Multisensor Target IDDetection Boxes3D Target ModelsRange ImageColor ImageIR, Range & Color ImageHypothesis Generation Four target probe set. Some image specific tuning.2D Imge Probes For each hypothesis:Optimize match.subject to 3D geometry. Return the best match. Single tuning for all runs.Metrics Target ID Confusion Matrix. 3D pose recovery statistics. Case-by-case analysis.Target Models M113, M901, M60 & Pickup M113 & M901 same class variants.Figure 3: Diagram of End-to-end ATR System Test.targets present in these images are: M113, M901 (M113 with missile launcher), M60 and a pickup truck.The overall design and ow of this experiment is summarized in Figure 3. The upstream detectionand hypothesis generation algorithms were used to generate realistic input for the multisensor matchingsystem. However, these upstream algorithms are not the focus of this particular experiment and theywere run in such as way as to maximally exercise the multisensor matching system. Put simply, we didnot want to miss a chance to test the identi cation system due to a failure upstream. Di erent thresholdswere used for the color system on di erent vehicle arrays.For each region-of-interest produced by the target detection algorithm, the range boundary probingsystem was run using a four target probe-set. Since the conversion of the ROI from the color image to therange image is dependent upon knowing the current alignment between those two sensors, the processwas repeated three times. In the rst set, no alignment error was assumed. In the second set, randomnoise in the range 0 0:75] was added to each alignment dimension. The last set used noise in the range 0 1:5].Our goal was to nd a con guration for this probing system which gave us at least one reasonable'hypothesis in the top ve ranked hypotheses. A reasonable hypothesis is one where the true target typeis identi ed and the vehicle pose is within 60 degrees of correct. Using di erent probe-sets for near versusdistant targets and hand generated tuning for each vehicle array, the system returned such reasonable'13
hypotheses in 33 out of the 35 cases.While we did allow upstream tuning for speci c vehicle arrays, we did not allow such tuning for themultisensor target ID system. As the focus of this evaluation, the ground rule was one con guration forall tests. All system input parameters were set to the same values for all 35 image triples.6.4 How Well are Targets Identi edMultisensor System IDTrue Target IDM113 M901M113M90171*51M60PickupM60 Pickup12711*18Table 1: Confusion matrix for Multisensor Target Identi cation. Correct identi cation rate is 27/35(77%). The two entries marked with *' are cases where hypothesis generation failed to suggest thecorrect target type: entries #14 and #29 in Table 2.Table 1 presents a confusion matrix summarizing how well the multisensor identi cation system performedon the 35 test cases. A detailed case-by-case breakdown is presented in Table 2. The second columnindicates the vehicle shot number and vehicle array as identi ed in the Fort Carson data collectionreport 8]. The third column indicates the true target. The next ve columns show the performance ofthe probing system, with the rst four being the number of vehicle types returned out of 15 possibletrials run. The fth column shows the best probing output.pThe next column represents the target ID returned by the multisensor matching system. A indicatesthe correct target has been identi ed. The fth column indicates the percentage of the target occludedin ten percent increments: blank indicates no occlusion. The nal column indicates the number of rangepixels on target.In most cases, the system correctly distinguishes between very di erent targets, i.e. M60 versus M113.It also successfully discriminates between two variants of the same underlying vehicle. The M113 andM901 are identical except for the presence of a missile launcher mounted on the top of the M901. Inone case where these two targets are confused, #14, the M901 is labeled an M113 because the misslelauncher is completely obscured by an occluding tree.14
Some other observations can be made looking at the data in Table 2. One is that identi cationperforms perfectly on the high resolution data from Array 5: #17 through #20. Another not 11/A03S12/A03S13/A03S14/A04S15/A04S16/A04S1
A Image Understanding Program under gran ts D AAHG and D AAH monitored b y the U S Arm y Researc h O . matc h sub ject to v ariabilit y both in ob ject pose and sensor . wn promise for Automatic T arget Recognition Ho w ev er A TR is a highly c hallenging ob ject recognition domain targets t