Transcription
Statewide Water Quality ToxicsAssessment ReportApril 2015Laboratory &EnvironmentalAssessment Program3150 NW 229th AvenuePortland, OR 97124Phone:(503) 693-5735Fax:(503) 693-4999Contact: Lori Pillsburywww.oregon.gov/DEQDEQ is a leader inrestoring, maintaining andenhancing the quality ofOregon’s air, land andwater.Oregon Department of Environmental QualityDEQ15-LAB-0065-TRLast Updated: 04/06/15By: Jane DoeDEQ 03-?-###
This report prepared by:Oregon Department of Environmental QualityLaboratory & Environmental Assessment Program3150 NW 229th AvenuePortland, OR 97124www.oregon.gov/DEQContributing Authors:Lori PillsburyKara GoodwinDan BrownContact:Lori Pillsbury503-693-5735Alternative formats (Braille, large type) of this document can be made available. Contact DEQ, Portland, at503-229-5696, or toll-free in Oregon at 1-800-452-4011, ext. 5696.Oregon Department of Environmental Quality
Table of ContentsExecutive Summary. 11. Introduction . 11.1 Background/Justification . 11.2 Sampling Design . 21.3 Water Collection Methods . 31.4 Field Quality Assurance / Quality Control. 41.5 Analytical Methods . 41.6 General parameters . 41.7 Inorganic parameters . 41.8 Organic parameters . 41.9 Laboratory Quality Control . 52. Results. 52.1 Statewide Summary . 52.2 Chemical Group Summary. 82.2.1 Current-Use Pesticides . 82.2.2 Combustion by-products . 122.2.3 Dioxins and Furans. 122.2.4 Flame retardants (brominated) . 132.2.5 Legacy pesticides . 142.2.6 Industrial Chemicals . 162.2.7 Priority Metals . 172.2.8 Consumer Product Constituents including Pharmaceuticals . 202.2.9 Plant or Animal Sterols . 202.3 Land use summary . 213. Next Steps . 224. References . 24Appendix A – Chemicals Analyzed . A-1Appendix B – Complete Site List . B-1Appendix C – Detected Chemicals . C-1State of Oregon Department of Environmental Qualityiii
This page intentionally left blankState of Oregon Department of Environmental Qualityiv
Statewide Water Quality Toxics AssessmentExecutive SummaryThis is the first statewide assessment of toxics in water across Oregon. In 2008, the Oregon Department ofEnvironmental Quality’s Laboratory and Environmental Assessment Program began monitoring work to assessthe presence and concentration of toxic chemicals in Oregon’s waters. From 2008 to 2013, DEQ laboratory staffcollected water samples from 177 sites across the state. These sites included coastal estuaries, large rivers andsmall streams. The laboratory analyzed these samples for more than 500 different chemicals.Although some chemicals exceeded state criteria or benchmarks for human health and aquatic organisms, mostdid not. Samples from urban areas in the Willamette River Basin and agricultural areas in the Hood River Basincontained the largest variety of chemicals detected at least once and the largest frequency of samples with at leastone chemical over a criteria or benchmark. DEQ’s findings show that current-use pesticides, legacy or no-longerused pesticides, polycyclic aromatic hydrocarbons and certain metals are of particular concern for human healthand aquatic life impacts in Oregon and will require continued monitoring.This study will serve as a baseline for future DEQ water quality monitoring studies.Several key findings: 128 unique chemicals detected in water samplesMost detected chemicals were at very low concentrations and within applicable criteria or benchmarks forenvironmental and human healthLargest variety of chemicals detected in the Willamette Basin, followed by the Hood BasinMost samples with at least one chemical over a criteria or benchmark occurred in the Hood BasinDetections of current-use pesticides occurred in all basins, often as mixtures and at times at levels aboveacceptable EPA aquatic life benchmarks; diuron (herbicide) detected in all but one basinLegacy pesticides present in water; frequently above DEQ human health criteriaPriority metals (such as copper and lead) present at levels above DEQ aquatic life criteriaArsenic and inorganic arsenic measured at levels of concern above DEQ human health criteria, mainly inEastern Oregon and in Oregon’s coastal estuariesFlame retardants detected around the state in urban and rural areasPolycyclic aromatic hydrocarbons (PAHs, which are combustion by-products from fires, vehiclecombustion and waste incineration) detected above DEQ human health criteria at several locations1. Introduction1.1 Background/JustificationMore than 80,000 different chemicals are in use in the United States. These chemicals include pesticides,pharmaceuticals, consumer products and industrial chemicals. Although they have intended beneficial uses, whenthey reach the environment, they may become pollutants potentially affecting aquatic life and human health.Recent national studies detected these pollutants across the United States in 80 percent of streams sampled(Kolpin, et al. 2002; Facazio, et al. 2008). Similar smaller-scale studies focused in Oregon detected similarchemicals in water, fish and streambed sediment (LCREP, 2007; Nilsen, 2007; Caton, 2012; Nilsen, et al., 2014).Once in the environment some chemicals may have effects on aquatic organisms as well as humans. Theseeffects may be acute (resulting in organism death as a direct result of exposure) or chronic (disrupting essentialorganism function) and can often occur as a result of very low concentrations of pollutants. Research indicatesthat low levels may affect a variety of behaviors in salmon and other aquatic organisms including disruptedState of Oregon Department of Environmental Quality1
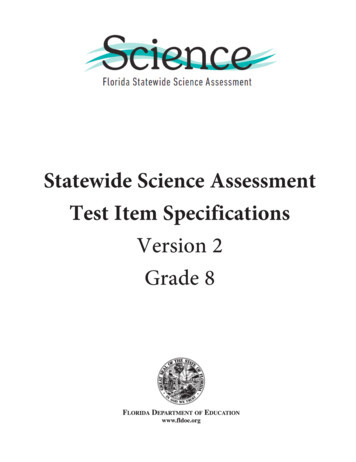
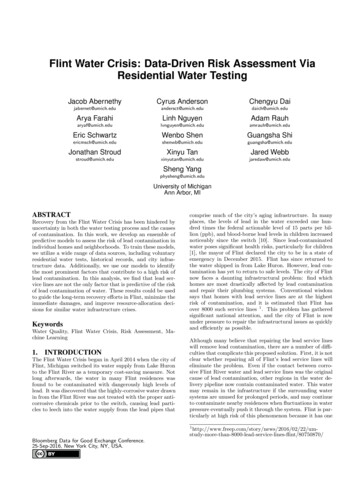
Statewide Water Quality Toxics Assessmentfeeding, reduced/disrupted reproduction, and difficulty with predator avoidance as well as reduced growth andphysical abnormalities (LCREP, 2007). In addition, many chemicals may act together to increase these toxiceffects. For many of these chemicals, the ones considered emerging, little is known about their effects and veryfew water quality criteria exist.Sources of these chemicals to aquatic systems vary and include diffuse (non-point) and specific (point) sources. Asurvey of Oregon’s major wastewater treatment facilities’ effluent in 2010 detected 114 of 406 chemicalsincluded in the monitoring (Hope, et al., 2012). Detections included similar chemicals to the ones found inKolpin’s study, including current-use pesticides, consumer products, pharmaceuticals, priority pollutant metalssuch as copper and lead, flame retardants and industrial chemicals. Additionally, a study focused on the ColumbiaRiver basin found similar pollutant groups in stormwater as well as wastewater effluent (Morace, 2012). Otherpossible pathways for these chemicals to reach aquatic ecosystems include industrial discharge, chemical spills,precipitation or irrigation-driven surface runoff, and atmospheric deposition.In 2007 the Oregon Legislature funded the Oregon Department of Environmental Quality to begin the StatewideWater Quality Toxics Monitoring Program. Started in 2008, the program identified four main goals:1. Gather information to characterize the presence and concentration of chemicals of concern in Oregon’swaters.2. Use this information to identify sources of these chemicals.3. Present and make available information gathered for public benefit.4. Work with DEQ internal groups, community groups and Oregon citizens to identify opportunities forreducing these pollutants.To achieve these goals, the DEQ Laboratory and Environmental Assessment Program developed a five yearmonitoring plan. This plan (completed in 2013) used a rotating basin approach to conduct a reconnaissancesampling of the state’s waters. The monitoring, sampling and analytical methods evolved over the course of thestudy. Initial sampling focused solely on water and fish tissue. However, by 2013, collections of water, sediment,fish and shellfish occurred and several state-of-the-art analytical methods were added. This report summarizes thewater portion of the monitoring effort. Tissue and sediment data will be summarized in a subsequent report. Theintent is to inform future water quality toxics monitoring by DEQ and its partners.To accomplish project goals 2 through 4, laboratory and program staff are working closely not only with internalDEQ programs but also with Oregon communities, tribal nations, watershed groups, and other stakeholders. Thedata collected from this program support initiatives on the local level (restoration activities, community actions),basin level (DEQ Basin Assessment process, watershed councils), and state level (Integrated Report development,water quality criteria development). These data also inform DEQ’s overall Toxics Reduction Strategy. Thecontinuation of this monitoring program will support these efforts moving forward.1.2 Sampling DesignThe monitoring program’s primary goal is to characterize the presence and concentration of chemicals of concernin Oregon’s waters. To achieve this goal, DEQ chose sites in each of Oregon’s main geographic basins (Figure 1).Following a rotating basin approach, sampling of all Oregon’s basins spanned a time period from 2008 until 2013.State of Oregon Department of Environmental Quality2
Statewide Water Quality Toxics AssessmentFigure 1: Water sampling sites (2008–2013).DEQ used several criteria for sample site selection. Initially, DEQ selected sites to be integrator sites that receivewater from the larger sub-watersheds within a basin. This was the main criterion for selection of sites within theWillamette (2008-2010), Umatilla (2011), Grande Ronde (2011), Powder (2011), Rogue (2011), Klamath (2011)and Umpqua (2011) basins (parentheses indicate year sampled). As the program developed and evolved,consideration and inclusion of additional criteria occurred to evaluate risks posed to smaller watersheds fromchemicals of concern. These criteria included land use, point and non-point sources. Site selection in 2012 (JohnDay, Deschutes, Hood, and Sandy basins) and in 2013 (three coastal basins, Owyhee and southeast OregonClosed Basins) considered these additional criteria, as well as input from local stakeholders.1.3 Water Collection MethodsIn order to characterize concentrations temporally, staff collected water grab samplesin each basin three times a year. The exceptions were the Willamette, DEQ sampledsix times over two years, and sites in southeast Oregon (Oregon Closed Lakes,Owyhee and Malheur Basins) which DEQ sampled once. These temporal samplingsattempted to capture not only hydrologic differences in the watersheds but alsopotential seasonal use patterns for certain chemicals.In general, sampling staff collected water directly into certified clean laboratorysample bottles. If not possible, staff used clean intermediate containers. In this case,transfer of samples to appropriate laboratory containers occurred at the site. Staffpreserved or filtered samples in the field as necessary. The ODEQ (2012) QualityAssurance Project Plan (DEQ09-LAB-0029-QAPP) and the basin-specific Samplingand Analysis Plans contain a full description of sampling methods, samplingcontainers, holding times and preservation techniques.State of Oregon Department of Environmental QualityLab staff member collectingwater from a bridgemonitoring site.3
Statewide Water Quality Toxics Assessment1.4 Field Quality Assurance / Quality ControlTo evaluate and monitor field sampling activities, DEQ collected field quality control samples. Sampling crewscollected at least one field equipment blank and field duplicate on each sampling excursion. DEQ laboratory staffand the project manager evaluated these results and qualified or estimated the related data as outlined in theQAPP.1.5 Analytical MethodsThis study analyzed over 500 unique chemicals in water (Appendix A). Given the range of chemicals sampled,this effort required 21 different analytical methods. The water quality criteria or environmental benchmarks formany of these chemicals are in the nanogram per liter, or parts per trillion, level. Therefore, the laboratoryemployed best available technologies.The DEQ laboratory completed all analyses with the following exceptions. The laboratory subcontracted analysisof total organic carbon and dissolved organic carbon to ESC Laboratories in Nashville, TN. Also, the laboratorysubcontracted the first year of inorganic arsenic samples to ALS Laboratories in Kelso, WA. Each of theselaboratories is accredited to perform these specific analyses through the National Environmental LaboratoryAccreditation Program. Specific information on methods and complete analyte lists for each method is found inthe project’s quality assurance plan and yearly sampling and analysis plans and available upon request from theDEQ laboratory.1.6 General parametersField staff measured general field parameters during each sampling event. These included water temperature,conductivity, dissolved oxygen, pH and turbidity. Staff collected water for analysis of total solids, total suspendedsolids and alkalinity.1.7 Inorganic parametersThe DEQ laboratory analyzed more than 20 inorganic parameters during this study. The majority of theseparameters included total and dissolved metals. In order to achieve the necessary detection limits, the laboratoryused an Agilent ICPMS (inductively coupled plasma mass spectrometer) following EPA guidance (EPA Method200.8). Analysis for total metals occurred in all study years. In 2011, the program added dissolved metals inresponse to revisions in the state’s water quality criteria for some metals and in 2012, the DEQ laboratory beganto analyze for inorganic arsenic (EPA Method 1632A).1.8 Organic parametersThe organic laboratory analyzed water samples for more than 450parameters using several analytical technologies, including liquidchromatography tandem mass spectrometry (LCMSMS), gaschromatography with an electron capture detector (GC-ECD), and gaschromatography high-resolution mass spectrometry (GC-HRMS) (Table 1).Gas chromatograph high-resolution massspectrometer (GC-HRMS) used to analyzewater samples for chemicals at subnanogram per liter levels.State of Oregon Department of Environmental Quality4
Statewide Water Quality Toxics AssessmentTable 1: Organic chemicals and associated analytical technologies.Analytical TechnologyLiquid chromatographytandem mass spectrometryGas chromatography massspectrometryGas chromatography withelectron capture detectorGas chromatography – highresolution mass spectrometryChemical GroupsPharmaceuticals and personalcare productsCurrent-use pesticidesCurrent-use pesticidesCombustion by-products(PAHs)Industrial chemicalsCurrent-use pesticides(phenoxy herbicides)Steroids and hormonesLegacy pesticidesPCBsPBDEs (Flame retardants)Dioxins and furansDEQ lab staff extracted all samples by liquid-liquid extraction within appropriate holding times. If necessary,method-required cleanup of the extracts occurred.1.9 Laboratory Quality ControlEach laboratory analytical batch included a method blank, laboratory control sample, matrix spike and either asample duplicate or matrix spike duplicate. Laboratory analytical staff and the project manager evaluated theresults of each quality control sample and estimated or qualified data as appropriate.2. Results2.1 Statewide SummaryOver the course of the sampling, the DEQ laboratory analyzed water samplesfrom 177 sampling sites across the state (Figure 1). Appendix B shows thebasins, major land use and watershed area for each water sampling location.Analytical methods developed and changed over the course of the sampling. In2012, new methods brought online evaluated very low levels of chlorinatedpesticides, flame retardants, PCBs, and dioxins and furans in water. During thelast year of sampling in 2013, laboratory analyses encompassed more than 500unique chemicals using 21 different analytical methods. For this report, DEQgroups these chemicals into 11 categories. Table 2 provides a brief descriptionof these categories with a more thorough description in the Results: ChemicalGroup Summary section. Statewide, DEQ detected 128 unique chemicals. Themost commonly detected groups were priority metals and sterols present at 100percent of sites, followed by current-use pesticides, at just over 50 percent ofsites (Figure 2). Appendix C summarizes the chemicals detected, number ofdetections, and maximum concentrations.State of Oregon Department of Environmental QualitySampling site in the Umatilla Basin5
Statewide Water Quality Toxics AssessmentTable 2: Chemical groups of analytes as reported in this study.Chemical GroupCurrent-use pesticidesLegacy pesticidesCombustion by-productsIndustrial chemicalsConsumer productconstituentsPlant or animal sterolsPriority metalsFlame retardantsPCBsDioxins / FuransAmmoniaDescriptionHerbicides, insecticides and fungicidescurrently used in the U.S.Chlorinated insecticides banned inU.S. and many other countries. Manycontinue to be used in some parts ofthe worldPolycyclic aromatic hydrocarbons(PAHs), by-products of incompletecombustion of petroleum, woodproducts, incineration, etc. May also bepresent in sealants.Dyes, pigments and industrialintermediatesPharmaceuticals including hormones,and other consumer-relatedcompounds such as caffeine, insectrepellants, plasiticizersPlant and animal sterols, may be theresults of human waste as well asnatural sourcesMetals for which DEQ water qualitycriteria existBrominated flame retardants (PBDEs)added to a variety of common productsincluding furniture, laptops, cars, etc.,to retard combustionPolychlorinated biphenyls (PCBs) usedas electrical insulating fluidChemicals formed as by-products ofindustrial processes, wood pulpbleaching and incomplete combustionfrom forest fires, volcanoes andincineration processesIndustrial contaminant mostly throughair deposition but may also be theresult of fertilizer use. Naturallyoccurring at very low concentrations.State of Oregon Department of Environmental QualityNumber ofcompounds analyzed111312160281017411941716
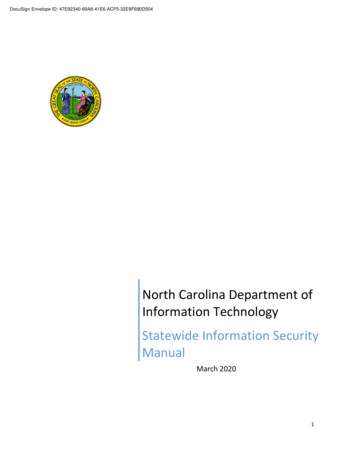
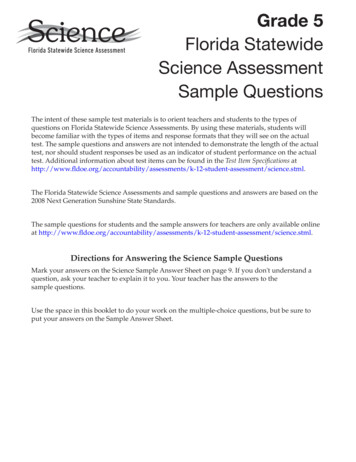
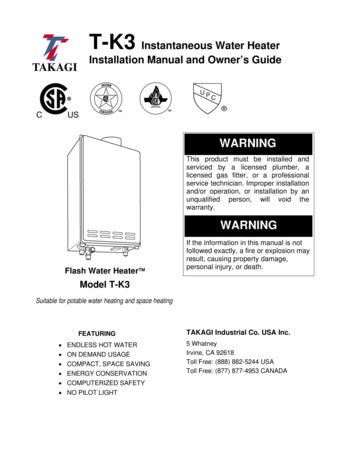
Statewide Water Quality Toxics AssessmentPCBs *Dioxins and Furans *Industrial ChemicalsCombustion By-ProductsFlame retardants *Consumer Product ConstituentsAmmoniaLegacy Pesticides *Current Use PesticidesPlant or Animal SterolsPriority Metals0%20%40%60%80%100%Figure 2: Percent of sites with detections by chemical group. Asterisks indicate chemical groups analyzed at sitessampled during 2012-2013.The number of different chemicals detected varied geographically (Figure 3). Basins with the most intensivepopulation centers and agricultural activity such as the Willamette and Hood Basins showed the greatest numberand variety of chemicals detected. Although the number of unique chemicals varied across basins, detections ofcurrent-use pesticides, priority metals and sterols occurred in each basin. Consumer product constituents occurredin all but one basin and combustion by-products in 11 of 15 basins.50# of unique chemicals45403530AmmoniaCombustion By-ProductsConsumer Product ConstituentsCurrent-Use PesticidesIndustrial Chemicals or IntermediatesMetals2520151050Figure 3: Number of unique chemicals detected by chemical group per basin (excludes new methods added in 2012,See Figure 4). Number of sites sampled in each basin listed in parentheses. Sterols excluded from excluded from thisfigure since the same four sterols were detected across all basins.State of Oregon Department of Environmental Quality7
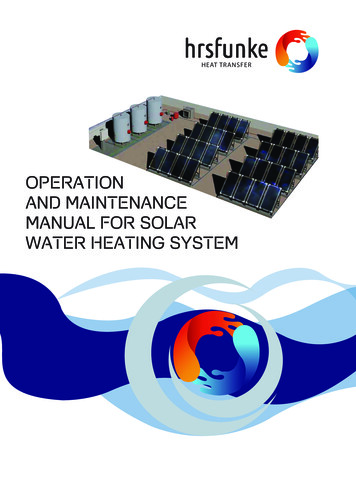
Statewide Water Quality Toxics AssessmentSince they were not measured in all basins, Figure 3 excludes the new methods added in 2012 for legacypesticides, flame retardants, PCBs, and dioxins / furans. The chemicals in these methods tend to sequester to thesediment and bio-accumulate in tissue. For this reason their presence in the aquatic environment may pose healthrisks for certain populations. In 2011, DEQ adopted new toxics criteria based on a consumption rate to protectsubsistence fishers (175 g/day) (ODEQ, 2011). This resulted in very low criteria for these chemicals in water.Therefore, in 2012 the DEQ laboratory added methods to evaluate their occurrence in water. The laboratorymeasured detectable levels of legacy pesticides in all basins in which they were analyzed (nine basins) and flameretardants in seven of these same nine basins (Figure 4). Detections of PCBs and dioxins and furans occurred inonly one basin for each group. One site on the upper Siuslaw River at Siuslaw River Falls (Mid-Coast basin)showed an unusually high number of detections, especially for legacy pesticides and flame retardants. Reasons forthis are unknown at this time. This area warrants follow-up during future monitoring activities. Also in 2012 and2013, the laboratory added several additional current-use pesticides. Detections of one of these additions, 2,6dichlorobenzamide (BAM), a breakdown product of the herbicide dichlobenil, occurred frequently in 2013.# of unique chemicals2520PCBsLegacy PesticidesFlame RetardantsDioxins and Furans151050Figure 4: Number of unique chemicals detected by chemical group per basin for analytical methods added in 2012.Number of sites sampled in each basin listed in parentheses.2.2 Chemical Group SummaryThis section describes the chemicals in each group, the potential effects of these chemicals, and the results of thisstudy.2.2.1 Current-Use PesticidesCurrent-use pesticides include insecticides, herbicides, fungicides and others. These products may move tosurface waters through runoff or drift from agricultural lands, public right-of-ways, managed forest areas andresidential properties and may move to surface waters through runoff or drift. Another source of pesticides toOregon’s waters is treated wastewater. A 2010 study in Oregon found current-use pesticides in the effluent ofseveral major wastewater facilities (Hope et al., 2012). Some examples of current-use pesticides found inOregon’s waters are: Diuron (Karmex , Direx ) – herbicide used for roadside weed control as well as on various agriculturallands Carbaryl (Sevin ) - insecticide used on forests, fields, homes and a variety of cropsState of Oregon Department of Environmental Quality8
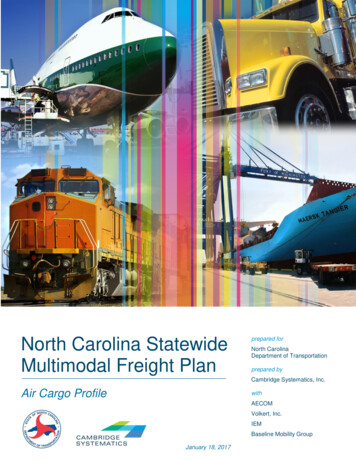
Statewide Water Quality Toxics Assessment Propiconazole (Tilt ) – fungicide used on food crops and ornamental plants, as well as a woodpreservativeMost current-use pesticides do not have established DEQ water quality criteria; however, EPA’s Office ofPesticide Programs established aquatic life benchmarks (EPA, 2014). This report compares results to the lowestOregon water quality criteria if available, and for pesticides without criteria, to the lowest EPA aquatic lifebenchmark. DEQ uses impact ratios (concentration detected in the sample divided by lowest criteria or aquaticlife benchmark). These ratios allow for the comparison of potential risk from chemicals with different toxicities(aquatic life and/or human health). Figures 5 and 6 illustrate the impact ratios) for the detected current-usepesticides. Detections of most pesticides were at levels below aquatic life benchmarks or criteria. The exceptionsto this are diuron, dichlorvos, fenvalerate/esfenvalerate and pentachlorophenol which occurred above theirrespective benchmarks or criteria.10.01.000.10Impact 8DEQ Human Health CriteriaEPA OPP Benchmark2,4,52,4 -Tri,6- chTr lorich oplo hero noph leno2,4 lDeA -Dtrais opr Br zineDe opy oms e lat acith ra lyl zinat eraDi zinecamDi baFl urouHe rid nxa onzin eIm onaz eapLM inu yret roonM lachNa etri lorpr buo zNo pam inPe rflu idend raim zoet nPr halSuom inlfome S etotu im nTe ron- azinrb me eut thhy yl lTr azinicl eTr opifl yruralin1.0x10Concentration Criteria or BenchmarkFigure 5: Impact ratio (log scale) for detected current-use herbicides. Values above the red line indicate a potential forimpact to aquatic life or human health.State of Oregon Department of Environmental Quality9
Statewide Water Quality Toxics Assessment100Impact Ratio10.01.000.100.01-31.0x10-41.0x10-5Bay g Acon eta(P miro pripo dFenvCa xualCa rb r)err aate D bofu rylEs ich rafe lor nnIm val vosid eraac tM lop ePeet rih dntac O omh x yPr loro am lop ph ylPy ico enra na olcl zos oltro ebin1.0x10Concentration Criteria or BenchmarkDEQ Human Health CriteriaEPA OPP BenchmarkFigure 6: Impact ratio (log scale) for detected current use insecticides and fungicides (italics). Values above the redline indicate a potential for impact to aquatic life or human health.Detected frequently, the herbicide atrazine, which is used on lawns and some agricultural crops, may be present atlevels of concern for aquatic organisms. Research indicates atrazine may have feminization effects on amphibians(Hayes, et al., 2002) as well as effects on humans (Winchester, et al., 2009; Munger, et al., 1997). Atrazine and itsdegradate are detected extensively in groundwater across the United States including Oregon. The EuropeanUnion banned the use of atrazine in 2003. In addition, as an outcome of their current registration review processfor atrazine, the EPA recently lowered its aquatic life benchmark from 1 to 0.001 µg/L for vascular plants (EPA,2014). During registration review, it is common for new studies to result in changes to benchmarks; however,such a significant change merits a thorough evaluation. At this time, multiple states, including those in the PacificNorthwest, are working through a national committee representing state agencies to better understand andevaluate the scientific justification for this 1,000-fold decrease in the atrazine benchmark before using at the statelevel. Therefore, for the purpose of this report, figure 5 uses the previous benchmark of 1 µg/L. All detections ofatrazine in this study exceed the revised EPA benchmark.Detections of current-use pesticides occurred in all basins sampled, overall at 53 percent of sites. Figure 7illustrates the concentrations of the most commonly detected pesticides, all of which are herbicides. Detections ofdiuron occurred in all basins except the Oregon Closed Lakes basin, located in southeastern Oregon.Concentrations ranged from very low to levels exceeding the chronic aquatic life benchmark. The chemical, 2,6dichlorobenzamide is the degradate of the herbicide, dichlobenil. The DEQ laboratory added this compound to itsanalytical list in 2013. Therefore, analysis f
the presence and concentration of toxic chemicals in Oregon's waters. From 2008 to 2013, DEQ laboratory staff collected water samples from 177 sites across the state. These sites included coastal estuaries, large rivers and small streams. The laboratory analyzed these samples for more than 500 different chemicals.