Transcription
2012Silverpop EmailMarketing MetricsBenchmarkStudy
SilverpopTWEET THIS2012 Silverpop Email Marketing Metrics Benchmark Study2012 SILVERPOP EMAILMARKETING METRICSBENCHMARK STUDYWhat’s the average open rate? How many clicksdo the best companies get? And how are ouremail programs performing against our peers?These are some of the most commonly askedquestions raised by marketers or their bosses.2. International ComparisonWe believe that the better gauge of marketingsuccess is whether your email program met,exceeded or fell short of the goals set while add- ‐ing value to the customer or prospect relation- ‐ship and maximizing conversions and revenue.However, used correctly, benchmark data canprovide the marketer with a baseline scorecardto help understand how far you need to travel inyour performance- ‐improvement journey. ǡ Ƥ break down those statistics by three majorcountries/regions: United States, Canada andEMEA (Europe, Middle East and Africa).With this study, Silverpop takes the typicalbenchmark study to a higher level in threerespects:1. Deeper Perspective in Benchmarks ǡ ǯ Ƥ marketing benchmarks such as open, click andbounce rates, but with additional computationsthat deliver a deeper and more accurate pictureof reader engagement and action on your emailmessages.Most benchmark studies are conducted from aU.S./single- ‐country- ‐centric viewpoint, but we ơ countries.3. Benchmarks Beyond “Average”Benchmarking your progress against your com- ‐petitors is a necessary step when analyzing youremail program’s health, but you have to selectthe correct benchmarks.Most studies report “average” benchmarks, butin our view, being average is no longer enough.In today’s hypercompetitive marketplace, “aver- ‐age” has become the new bottom.Instead, we hope to encourage you to set yoursights higher. If you want to be a world- ‐classmarketing organization, compare yourself tothose who are doing the best on the benchmarksthat are most important to you.These include unique and gross open rates,number of opens per opener, the click- ‐to- ‐openrate, clicks per clicker, email messagesize, and complaint andunsubscribe rates.And we’ll alsoslice the dataup by industryverticals.silverpop.com 2012 Copyright Silverpop. All rights reserved. The Silverpop logo is a registered trademark of Silverpop Systems Inc.PAGE 2
Silverpop2012 Silverpop Email Marketing Metrics Benchmark StudyThus, we present the average benchmark,median, and top- ‐ and bottom- ‐performing quar- ‐tile for each benchmark. Although averages arethe most common form of reporting statistics, ơ interpretation. At the end of this report, you’llƤ ǡ ǡ Ƥ of the terms used in this study, and links towhite papers and tip sheets you can use to helpimprove your marketing performance.Next Step: Benchmark Against YourselfThis study presents a variety of key perfor- ‐mance benchmarks among email messagessent to recipients around the world. However,this should be just the beginning for you.One note to apply with this report: The met- ‐ Dz dz metrics, which measure activity on emailmessages. These are important measurementsthat help drive improvements in areas such ascreative, deliverability and list hygiene. ǡ industry average, even placing your messagesamong the top- ‐performing email marketers,doesn’t necessarily mean you’re meeting yourmost important business goals.Understanding where your email programstands on process metrics is one half of thebenchmarking equation. The other, and argu- ‐ably more important half, is using “output”metrics, such as revenue, leads generated,cost savings, order size or number of down- ‐loads, which measure how well your emailcampaign delivered against your individualcompany’s business goals.STUDY FINDINGSOPEN RATESOverviewTWEET THISSo, what’s theaverage uniqueopen rate?The open rate (both unique and gross, or total)can be calculated in multiple ways. For this study,we calculated the open rate as the number ofmeasured opened messages — including emailsin which images were enabled, as well asDz dz a click on a link or an HTML message whoseviewer didn’t enable images but clicked on a link— divided by the number of delivered messages.“Opens per opener” is a lesser- ‐known butillustrative metric, which is calculated bydividing the total or gross measured opensby the number of unique opens. In simplestterms, it measures how many times arecipient (or recipients, when the messageis forwarded) opens the same message.As above, this would also include“implied” opens.Unique Open Rate (by Country/Region)According toSilverpop’sbenchmark studyof more than1,100 brands,it’s 20.1%.Open Rate(Unique)OverallU.S.EMEACanadaMeanMedianTop lverpop.com 2012 Copyright Silverpop. All rights reserved. The Silverpop logo is a registered trademark of Silverpop Systems Inc.PAGE 3
Silverpop2012 Silverpop Email Marketing Metrics Benchmark StudyUnique Open Rate (by Industry)Open Rate (Unique) Ƥ Computer Hardware, Telecom & ElectronicsComputer SoftwareConsumer ProductsConsumer ServicesEducationFinancial ServicesHealthcareTravel & LeisureMedia & PublishingReal Estate & .1%TopBottomQuartile 1%4.9%7.3%10.5%9.0%Gross Open Rate (by Country/Region)Open Rate(Gross)OverallU.S.EMEACanadaAverageMedianTop %12.9%Gross Open Rate (by Industry)Open Rate (Gross) Ƥ Computer Hardware, Telecom & ElectronicsComputer SoftwareConsumer ProductsConsumer ServicesEducationFinancial ServicesHealthcareTravel & LeisureMedia & PublishingReal Estate & .3%TopBottomQuartile 6%11.2%8.7%6.2%9.9%17.7%12.6%silverpop.com 2012 Copyright Silverpop. All rights reserved. The Silverpop logo is a registered trademark of Silverpop Systems Inc.PAGE 4
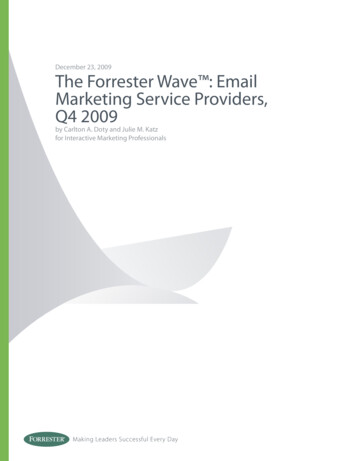
Silverpop2012 Silverpop Email Marketing Metrics Benchmark StudyOpens per Opener (by Country/Region)Opens perOpenerOverallU.S.EMEACanadaAverageMedianTop 542.96BottomQuartile1.281.271.271.39Opens per Opener (by Industry)Opens Per Opener Ƥ Computer Hardware, Telecom & ElectronicsComputer SoftwareConsumer ProductsConsumer ServicesEducationFinancial ServicesHealthcareTravel & LeisureMedia & PublishingReal Estate & ConstructionRetailObservationsWhile average and median open rates are fairlyclose across- ‐the- ‐board, top- ‐quartile performersachieved open rates nearly triple the median and Ƥ Ǧ Ǥ ơ results for the gross open rate are even greater,with top performers achieving rates 10 timeshigher than low performers.Across industry verticals, the “Computer Software”segment notched the best unique open rates,averaging nearly 25 percent, with top- ‐quartile Ƥ ǤRegarding the opens per opener rate, severalfactors can drive multiple opens:Ȉ Use of multiple devices: It has become com- ‐mon for email users to scan or “triage” theiremails on a mobile device and then view 401.421.641.42TopBottomQuartile 1.31act on the emails later on their desktop orlaptop computers. If images were enabled (orlinks clicked with images blocked/disabled)across devices, then an open would be cap- ‐tured at each access point.Ȉ Relevance/depth of content: Emails that are ǡ ơ relevant and have a “shelf life” may be morelikely to be opened a second time (or more).Ȉ Viral sharing: When your subscribers forwardyour email using the “forward” link or buttonin their email software clients instead of yourforward- ‐to- ‐a- ‐friend link, subsequent opens byothers would be associated with the originalrecipient.Top- ‐quartile performers averaged 66 percentmore opens per opener than average. Bottom- ‐quartile performers averaged only slightly morethan 1 per open per opener – less than half theƤ Ǧ Ǥ silverpop.com 2012 Copyright Silverpop. All rights reserved. The Silverpop logo is a registered trademark of Silverpop Systems Inc.PAGE 5
Silverpop2012 Silverpop Email Marketing Metrics Benchmark StudyLooking at industry verticals, there were twothat averaged more than 2 opens per openeron average— “Financial Services” and “RealEstate & Construction.”of recipients who view your message. Thisuncertainty underscores the importance of notover- ‐relying on the open rate as a key measureof subscriber engagement. It does have goodvalue as an in- ‐house benchmark that you canuse to establish trends and diagnose issues withyour email program.Because the open rate doesn’t accurately cap- ‐ture all opens due to image blocking and otherfactors, it can actually underreport the numberCLICK-THROUGH RATESOverviewas a percentage of messages opened, insteadof messages delivered. Clicks per clicker, aswith opens per opener, measures how oftena recipient clicks links in the same message. Itcaptures actions by recipients who either click Ƥ than one link in the email message.The click- ‐through rate (CTR) is the number ofunique clicks on links in the email messagedivided by the number of delivered emailmessages in a campaign. The click- ‐to- ‐open ȋ Ȍǡ ơ ǡ is the ratio of unique clicks as a percentage ofunique opens. It measures click- ‐through ratesClick- ‐Through Rate (by Country/Region)TWEET THISThe onlyindustry torank in thetop 3 verticalsin open rate,click-throughrate and clicksper clicker?Computersoftware.Click-ThroughRate (Unique)OverallU.S.EMEACanadaMeanMedianTop 14.9%9.7%BottomQuartile0.7%0.7%0.9%0.7%Click- ‐Through Rate (by Industry)Click-Through Rate (Unique) Ƥ Computer Hardware, Telecom& ElectronicsComputer SoftwareConsumer ProductsConsumer ServicesEducationFinancial ServicesHealthcareTravel & LeisureMedia & PublishingReal Estate & an5.4%silverpop.com 2012 Copyright Silverpop. All rights reserved. The Silverpop logo is a registered trademark of Silverpop Systems Inc.PAGE 6
Silverpop2012 Silverpop Email Marketing Metrics Benchmark StudyClick- ‐to- ‐Open Rate (by Country/Region)Click-toOpen RateOverallU.S.EMEACanadaMeanMedianTop ick- ‐to- ‐Open Rate (by Industry)Click-To-Open Rate Ƥ Computer Hardware, Telecom &ElectronicsComputer SoftwareConsumer ProductsConsumer ServicesEducationFinancial ServicesHealthcareTravel & LeisureMedia & PublishingReal Estate & 0%6.6%7.1%3.1%10.2%AverageMedian20.1%Clicks per Clicker (by Country/Region)Clicks perClickerOverallU.S.EMEACanadaMeanMedianTop 772.84BottomQuartile1.341.331.311.41silverpop.com 2012 Copyright Silverpop. All rights reserved. The Silverpop logo is a registered trademark of Silverpop Systems Inc.PAGE 7
Silverpop2012 Silverpop Email Marketing Metrics Benchmark StudyClicks per Clicker (by Industry)Clicks per ClickerTWEET THISTop-quartilecompaniestally clickthrough ratesthree timesthe average— and ashigh as manycompanies’open .061.331.231.431.37AverageMedian1.47 Ƥ Computer Hardware, Telecom &ElectronicsComputer SoftwareConsumer ProductsConsumer ServicesEducationFinancial ServicesHealthcareTravel & LeisureMedia & PublishingReal Estate & ConstructionRetailObservationsAcross the three click- ‐based metrics, some keyƤ ǣȈ Click- ‐Through Rate: Top- ‐quartile per- ‐formers tallied click- ‐through rates as highas many companies’ open rates and ap- ‐ Ǧthrough rate. In contrast, bottom- ‐quartileperformers didn’t even muster 1 percentclick- ‐throughs.“Computer Software,” “Media &Publishing” and “Consumer Services”were the best- ‐performing verticals, bothon average and among top- ‐quartileperformers. The higher click- ‐through ratesmay be attributable to these industriestypically delivering content lighter on sales- ‐related messaging and heavier on news,information and educational materials.Ȉ Click- ‐to- ‐Open Rate: Again, top- ‐quartile performers far surpassed theircounterparts, notching click- ‐to- ‐openrates more than double the average performers. Splits among industryverticals were similar to those in theclick- ‐through category.Ȉ Clicks per Clicker: ơ between high and low performers wasless pronounced here than in othercategories, but the top quartile stilltallied 17 percent more clicks per clickerthan average. Looking at verticals, the“Computer Hardware” and “ComputerSoftware” industries performed best,with the latter the only one to top threeclicks per clicker.silverpop.com 2012 Copyright Silverpop. All rights reserved. The Silverpop logo is a registered trademark of Silverpop Systems Inc.PAGE 8
Silverpop2012 Silverpop Email Marketing Metrics Benchmark StudyMESSAGE SIZEOverviewAs with subject line length, there isn’t a one- ‐ ǦƤ Ǧ Ǥ ǡ ǡ length and the amount of HTML and imagesused will determine how large a message youremail becomes.ents view your messages on smartphones connectedto a cell network with only two bars of coverage, opti- ‐mizing for message size becomes more important.Message Size (by Country/Region)A recent rule of thumb is to keep email messagesin the 50KB range to ensure they load quickly.While many companies send emails of 80KB toOn desktop computers connected to the corporate 120KB or more with no issues, optimizing mes- ‐network, message size is of little consequence — an sage size may become more important as aemail of 200KB may load in roughly the same time growing percentage of your subscribers read youremails on mobile devices.as a 40KB message. But as more and more recipi- ‐Message age Size (by Industry)Message Size (kilobytes)“Smallest” “Largest”Quartile 53.54.96.926.329.132.025.631.140.819.527.520.937.8 Ƥ Computer Hardware, Telecom &ElectronicsComputer SoftwareConsumer ProductsConsumer ServicesEducationFinancial ServicesHealthcareTravel & LeisureMedia & PublishingReal Estate & ConstructionRetailObservationsThe majority of companies in our study arekeeping messages below 40KB and on averageabout 15KB — a good size that should loadfairly quickly regardless of viewing platform.Note that for this metric we’ve labeled thetop and bottom quartiles as “Smallest” and“Largest,” since there isn’t necessarily anoptimal size. However, a message of only a Ǧ Ƥ a comparable but HTML- ‐designed messagemany times larger.silverpop.com 2012 Copyright Silverpop. All rights reserved. The Silverpop logo is a registered trademark of Silverpop Systems Inc.PAGE 9
Silverpop2012 Silverpop Email Marketing Metrics Benchmark StudyLIST CHURN METRICSOverviewThe unsubscribe rate and abuse (spam) complaintrate measure reader disengagement: Does your ȋ Ƥ Ȍ your emails?In general, unsubscribers are telling you that yourprogram has missed the mark or no longer meetstheir needs, usually due to a lack of relevancy. Or,they want to change email addresses or prefer- ‐ences but see no option but to leave. In contrast, ƪ Ǥ subscriber doesn’t want your email message and ǯ Ƥ ǯ enough to use it in order to leave the list.The hard bounce rate measures permanent deliveryerrors: how many email messages were undelivered ǯ to closed accounts. A high bounce rate indicatesproblems with accurate data collection at opt- ‐in aswell as with email address churn among subscribers.Each of these rates can be negligible by itself, butwhen added together over a year of messagedeliveries, they can cost you a quarter to a half ofyour list.Hard Bounce Rates (by Country/Region)Hard BounceRateOverallU.S.EMEACanadaAverageMedianTop 1%0.2%BottomQuartile7.3%7.9%6.7%3.1%Hard Bounce Rates (by Industry)TWEET THISHard Bounce RateTop companieshave hardbounce rates1/20 theaverage — thedifferencebetween 500bounces and10,000 ifemailing a listof 500K. Ƥ Computer Hardware, Telecom& ElectronicsComputer SoftwareConsumer ProductsConsumer ServicesEducationFinancial ServicesHealthcareTravel & LeisureMedia & PublishingReal Estate & %silverpop.com 2012 Copyright Silverpop. All rights reserved. The Silverpop logo is a registered trademark of Silverpop Systems Inc.PAGE 10
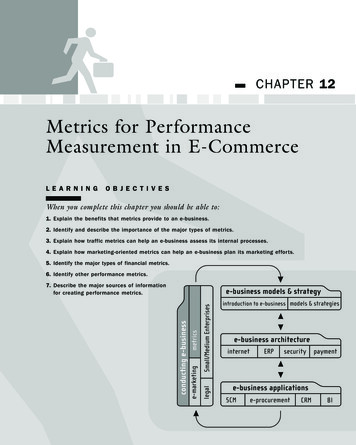
Silverpop2012 Silverpop Email Marketing Metrics Benchmark StudyObservations ơ email’s top performers and its average or bottomperformers. Top- ‐performing companies had hardbounce rates one- ‐twentieth that of averageperformers – which, when mailing to a list of͘͘͝ǡ͘͘͘ǡ ơ ͘͘͝ bounces and 10,000.This indicates that top performers mostlikely are more vigilant about verifying emailaddresses before adding them to thedatabase and about doing list hygiene toremove undeliverable addresses. The resultis that they have to spend a lot less timeand money reacquiring them.Across industries, top- ‐quartileperformers were very consistent, withall segments falling in the 0.1 percentto 0.3 percent range.Unsubscribe Rates (by Country/Region)TWEET THISUnsubscriberates forbottom-quartilecompanies arethree times theaverage and 50times that S.EMEACanadaAverageMedianTop 1%Unsubscribe Rates (by Industry)Unsubscribe Rate Ƥ Computer Hardware, Telecom &ElectronicsComputer SoftwareConsumer ProductsConsumer ServicesEducationFinancial ServicesHealthcareTravel & LeisureMedia & PublishingReal Estate & ConstructionRetailObservationsAs with the open rate, the best use of the for trends. An unsubscribe rate that increasesover time, or which remains constant whilespam complaints increase, likely signalssubscriber 32%6.77%0.61%1.21%0.34%AverageMedian0.10%While even the bottom quartile only sees about ͙ ǡ Ƥ than three times the average rate and morethan 50 times that of the best performers,whose customers rarely unsubscribe (0.02percent across all regions). If you’re sending ǡ ơ silverpop.com 2012 Copyright Silverpop. All rights reserved. The Silverpop logo is a registered trademark of Silverpop Systems Inc.PAGE 11
Silverpop2012 Silverpop Email Marketing Metrics Benchmark Studyadd up to thousands of subscribers during thecourse of a year. (Note: Data from companies fromregions outside the three highlighted in the chartled to the overall numbers skewing higher – seethe “Research Methodology” section.)unsubscribe rate compared to less than 0.3percent for most. This may be attributable tothe nature of that industry – people subscribewhen researching or booking a vacation, thenunsubscribe once the trip is complete.Among industry verticals, “Travel & Leisure”was the main outlier, tallying a 1.6 percentComplaint Rate (by aAverageMedianTop 0%Complaint Rate (by Industry)Complaint .25%0.08%0.19%AverageMedian0.05% Ƥ Computer Hardware, Telecom &ElectronicsComputer SoftwareConsumer ProductsConsumer ServicesEducationFinancial ServicesHealthcareTravel & LeisureMedia & PublishingReal Estate & ConstructionRetailObservationsWhile recipient engagement has become ǡ (spam) complaints are still an important factorISPs consider when deciding whether to deliver ǡ junk/spam folder or even block them entirely.As a result, minimizing abuse complaintsand actively monitoring the number andpercentage of complaints for each mailingremains an important aspect of performance Ǥ ơ ǡ complaints per thousand messages.Across industry and geographic locations,the complaint rates for top- ‐quartile performersare minuscule.silverpop.com 2012 Copyright Silverpop. All rights reserved. The Silverpop logo is a registered trademark of Silverpop Systems Inc.PAGE 12
Silverpop2012 Silverpop Email Marketing Metrics Benchmark StudyADDITIONAL RESOURCESRESEARCH METHODOLOGY ͚͙͙͘ ȋ Ȍ Ƥ ͚͙͚͘ Silverpop’s Engage client base. Researcherslooked at all messages sent by 1,124 brands from20 countries.A broad set of message types was includedin the study — from promotional emails and Ǧ Ƥ transactional messages — sent by companies ina variety of industries.For this study, researchers analyzed variousmetrics for both the overall category (all 20sender countries, including the United States,Canada and those in EMEA) and for just theUnited States, Canada and EMEA. Becausethe overall numbers include countries beyondthe United States, Canada and EMEA, in someinstances the overall average might actually behigher (or lower) than the combined average ofthe United States, Canada and EMEA.Reporting the Findings: Each performancechart features statistics that include the average,median, and top and bottom quartiles. The Ƥ was used for this study. The “top quartile” iscalculated by taking the median of all data abovethe overall median, and “bottom quartile” is themedian of all data below the overall data median.DEFINITIONS FOR TERMSUSED IN THIS PAPEROpen: “Open” refers to an HTML email message ͙ ͙ image. When a message is opened and imagesare enabled, the image calls the server and themessage is then counted as an open. The numberof opens counted for this research include both Dz dz messages that recorded a click on any link in themessage or an HTML message whose viewer didnot enable images but clicked on a link.by the original recipients or by those to whom theoriginal recipient forwards the message by using the“forward” button in the email client instead of a “for- ‐ward to a friend” link. To calculate, divide the totalnumber of opens by the total number of deliveredmessages and multiply by 100.Average Opens per Opener: - ‐age number of times a recipient opens the messageand is calculated by dividing the number of totalopens by the number of unique opens.Open Rate (Unique): The unique open rateClick- ‐Through Rate (CTR): Measures the percent- ‐ as a percentage of the total number of deliveredemail messages. To calculate the rate, divide thenumber of unique opens by the total numberof delivered emails, and then multiply by 100 todisplay the percentage.age of email messages that drew at least one click. ǡ Ǧ rate, counting only one click per recipient. To cal- ‐culate the click- ‐through rate, divide the number ofunique clicks by the number of delivered messagesand multiply by 100.Total Open Rate: Sometimes called the grossClick- ‐to- ‐Open Rate (CTOR): Measures the per- ‐centage of opened messages that recorded clicks. Tocalculate, divide the number of unique clicks by thenumber of opened messages and multiply by 100. total delivered email messages. It measures howmany times the email message is opened, eithersilverpop.com 2012 Copyright Silverpop. All rights reserved. The Silverpop logo is a registered trademark of Silverpop Systems Inc.PAGE 13
Silverpop2012 Silverpop Email Marketing Metrics Benchmark StudyAverage Clicks per Clicker: The averageTWEET THISnumber of times a recipient clicks a link in anemail message. To calculate, divide total clicksby unique clicks.Message Size: The actual size of a message ȋ ȌǤ ơ ǡ coding and images in a message and if multipart ȋ within the same message).Hard Bounce: This study analyzed “hardbounces,” which are permanent delivery failures ǯ was closed.Hard Bounce Rate: The percentage of sentmessages that failed (bounced) because the ǯ Ǥ To calculate, div
Silverpop 2012 Silverpop Email Marketing Metrics Benchmark Study OpensperOpener (byCountry/Region) Opens per Opener Average Median Top Quartile Bottom Quartile % % % % % Overall 1.79 1.51 2.97 1.28 U.S. 1.79 1.50 3.04 1.27 EMEA 1.71 1.52 2.54 1.27 Canada 1.88 1.59 2.96 1.39 Opens Per Opener Average Median Top