Transcription
International Relations and Diplomacy, May 2017, Vol. 5, No. 5, 241-257doi: 10.17265/2328-2134/2017.05.001DDAVIDPUBLISHINGThe Chinese Automobile Market and the Strategies of European,American, Japanese, Korean and Chinese Auto Makers Jin Chen Ritsumeikan University, Ibaraki, Osaka, JapanThis paper compares and analyzes the changes in the Chinese automobile market in recent years as well as thecompetition strategy of top makers of European, American, Japanese, Korean, and Chinese automobiles. Inparticular, analysis is carried out on the cause of the rapid growth of European, American, and Korean makers inthe passenger vehicle market and the slow growth of Japanese makers, especially, Toyota, Honda, and Chinesemakers. In order to adapt to the environmental change in the Chinese automobile market, European and Americanmakers like Volkwagen (VW) and General Motors (GM) have developed full model line-up strategies focusing oncompact cars while utilizing the advantages of the annual production of their full model line-up and giving priorityto local part procurement. What’s more, Korea’s Hyundai has converted its car model strategy from mid-sized carsinto compact cars in accordance with the changes in the Chinese market. Through successful product developmentadjusting to local needs, Hyundai has firmly entrenched its brand name. For Honda and Toyota, the slowconversion from mid-sized cars to compact cars and the inability to decrease costs due to the slow development oflocal part procurement are the causes of their delayed development in the Chinese market.Keywords: middle class, inland market, local part procurement, research and development of local productIntroductionThis paper compares and analyzes the changes in the Chinese automobile market in recent years as well asthe competition strategies of the top makers of European, American, Japanese, Korean, and Chineseautomobiles. In particular, analysis is carried out on the cause of rapid growth for European, American, andKorean makers in the passenger vehicle market and the slow growth of Japanese makers, especially, Toyotaand Honda as well as Chinese makers1.The Chinese automobile market is growing at an especially rapid rate after the 2008 financial crisis incontrast to the decline and reduction of the markets of developed countries such as those in Europe,America, and Japan. Production volume of the Chinese automobile market increased to No. 1 in the world in2009 from eighth place in 2000, and sales volume has also occupied the top spot globally. In particular,the growth of passenger vehicle production is most significant. The percentage of passenger vehicles Acknowledgement: This paper has been financially supported by Grants-in-Aid for Scientific Research, Japan Society for thePromotion of Science (JSPS), with Fundamental Research (C) (H26-H29). Hereby I would like to express my deeply thanks forJSPS.Jin Chen, Professor, College of Business Administration, Ritsumeikan University; Affiliate Researcher of International MotorVehicle Program (IMVP) of MIT (1994-2013) and Program on Vehicle &.Mobility Innovations (PVMI from 2013).1The deterioration of recent political relation between Japan and China has influenced the market performance of Japanesemakers in the Chinese market in some degree. This paper focuses on their market trend and corporative strategy.
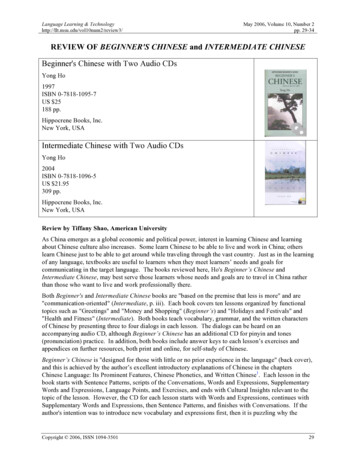
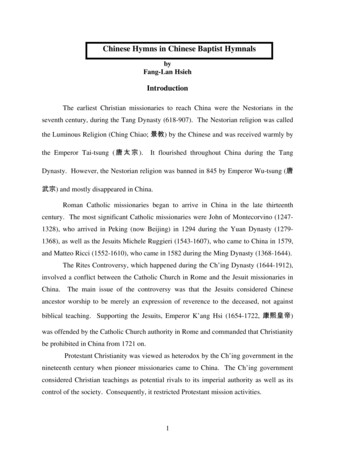
242THE CHINESE AUTOMOBILE MARKET AND THE STRATEGIESwhich accounts for automobile gross production has almost tripled from less than 30 % in 2000 to 84% in 2014(see Figure 1).MillionThousandFigure 1. Automobile and passenger vehicles gross production and passenger vehicle production volume of each topmaker in the Chinese market (2004-2014).Resource: made by Jin Chen, based on the data from (2004-2015) Chinese Automobile Industry Yearbook and FOUIN’s MonthlyReport on the Chinese Automotive Industry.Notes. The left axis indicates the total gross production volume of automobile and passenger vehicles (bars), and the right axisindicates the passenger vehicle production volume of each top maker (lines).Considering the data2 of passenger vehicle production volume and growth rate of each maker especiallyafter the 2008 financial crisis, these makers are clearly divided into rapid-growing and slow-growing groups.Based on the average growth rate from 2009 to 20143, the growth rate for GM is at 17%, Ford is at 28%, VW isat 17% and Hyundai is at 17%. Meanwhile, Nissan has made strenuous efforts to maintain a 10% growth rate,while Toyota is at nine percent and Honda is at seven percent, which is far behind the above mentioned topmakers. Moreover, the growth rate of Geely (five percent), BYD (three percent) and Chery (two percent) areeven lower.Observing the changes to the top 10 models of sedans by sales volume in the recent Chinese market,models from VW, GM and Hyundai from European, American, and Korean makers respectively occupy the toppositions. Moreover, the ranking of Japanese products excluding Nissan along with all Chinese makers havedeclined and disappeared from dominance in recent years (see Table 1). The question raises of what were thereasons that caused the different results.2Relating to the passenger vehicle production data of each maker, VW refers to Shanghai VW and FAW VW, GM refers toShanghai GM and SAIC-GM-Wuling, Toyota refers to FAW Toyota and Guangzhou Toyota, Honda refers to Guangzhou Hondaand Dongfeng Honda, Hyundai refers to Beijing Hyundai and Dongfeng Yueda Kia Motor.3The average growth rate within these 6 years is calculated based on CAGR (Compound Annual Growth Rate).
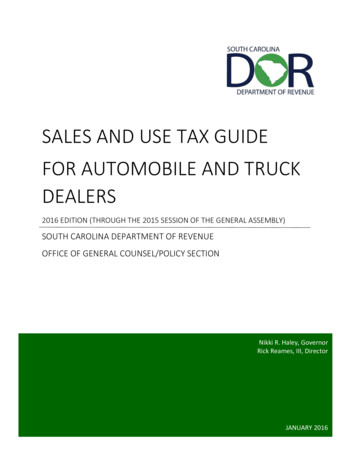
243THE CHINESE AUTOMOBILE MARKET AND THE STRATEGIESTable 1Top 10 Model Ranking of Sedans by Sales Volume in the Chinese Market (2008-2014)2008200920102011201220132014TOP ent VW 1.6LVW 1.8LGM 1.6LHonda 2.0L Toyota1.8L Toyota2.0 Chery 1.0L BYD 1.5L FAW 1.0L rAQQCorollaCamryDisplacement BYD 1.5L GM 1.6LHyundai1.6 VW 1.6LVW 1.8LHonda2.0 Hyundai1.6 Chery1.0L Toyota1.8L ruzeFlagcloudBoraDisplacement BYD 1.5L VW 1.6LHyundai1.6 VW 1.6LGM 1.6LVW 1.8L FAW 1.0L GM 1.5LChery1.5L VW t GM 1.6LVW 1.6LGM 1.5LVW 1.6LVW 1.6LVW 1.8L GM 1.4LFAW 1.0L Hyundai1.6 Ford cement Ford 1.6L GM 1.4LGM 1.6LVW 1.6LVW 1.6LVW 1.8L GM 1.5LVW 1.6LHyundai1.6 New BoraDisplacement Ford 1.6L VW 1.6LGM 1.6LGM 1.4LVW 1.6LVW 1.6L Nissan 1.6GM 1.5LVW 1.6LVW 100300,100297,000293,100266,000253,300252,300Price (CNY) 100-170K 110-170K 80-120K130-190K100-170K 80-120K100-120K110-160K 60-80K100-150KDisplacement Ford 1.6L VW 1.6LVW 1.6LNissan 1.6 VW 1.6L GM 1.5LGM 1.5LHyundai1.6ExcelleFocusFocusLAVIDAVW 1.6LSailCruzeSylphyXialiGM 1.4LFocusVernaResource: made by Jin Chen, based on the date of statistic information net (www.auto-stats.org.cn) of Chinese AutomobileIndustry Association and Automobile Home.Notes. L refers to liter of displacement. Price identification comes from Automobile Home, network access on March 25, 2015.Based on the above research, this paper theoretically observes the latest trends of the Chinese automobilemarket, changes in each maker’s model policy and foundation factors of vehicle parts. This paper also offers anew viewpoint on the Chinese automobile market and each maker’s strategy analysis.Rapid Growth of the Middle Class and the Inland Market in ChinaIn addition to the wealthy class, the middle class consumers are increasing in the Chinese economy due tolong term advanced growth. These increases have led to an expansion from larger cities on the coast to mediumand smaller sized cities along with rural villages in inland areas in the automobile consumer market. Inparticular, sales of compact and low cost automobiles which the middle class can afford have seen an explosiveincrease.A reason for the rapid increase in automobile sales is the increase in the income level of the Chinesepeople. Passenger vehicles produced in China are mainly sold to the so-called middle class4, and not thewealthy class.Sales volume in the Chinese luxury automobile market such as Mercedes Benz and BMW for the wealthyclass in China has been increasing every year but most of these luxury automobiles are imported, and notproduced in China. For example, looking at sales of BMW worldwide in 2012, China occupied the top spot at arelatively high percentage of 28% followed by Germany and America at 16%, England at seven percent alongwith Italy and France at three percent. However, production of BMW in Germany accounted for 64% of the4The middle class is positioned between the wealthy class and poor class. There are methods for measuring the middle class suchas household income and consumption but these are not clearly defined like with the poor class. There are studies which makeclassification standards in each country and investigations that measure world trends with definite figures.
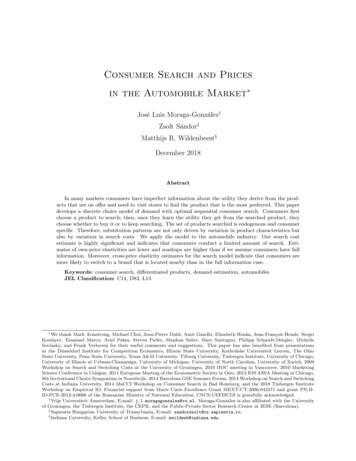
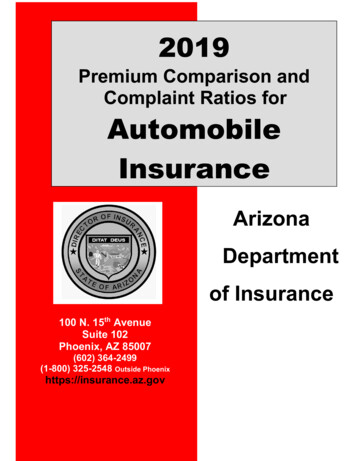
244THE CHINESE AUTOMOBILE MARKET AND THE STRATEGIESworld’s production while China was only at four percent.However, many of the new wealthy among the middle class consumers have little knowledge ofpurchasing automobiles and their demand of the price range of the automobiles is quite less than the wealthyclass.Meanwhile, since the beginning of the 21st century, the Chinese government has spent a massive amountof money to create various inland promotion policies for the expansion of the inland market. Therefore, theincome per person living inland has continued to show more advanced growth than that of the coastal areassince the mid 2000s. For example, the income per person in eastern urban areas increased 2.4 times from13,375 CNY in 2005 to 32,472 CNY in 2013, 2.6 times in the central area from 8,809 CNY to 22,736 CNY, 2.6times in the western area from 8,783 CNY to 22,710 CNY and 2.6 times in the northeast area from 8,730 CNYto 22,875 CNY5. Meanwhile, the restriction of car purchase becomes more strict by traffic jam and air pollutionin eastern metropolitan like Beijing and Shanghai in recent years.In addition, the government’s tax reduction policies and subsidy system are providing support forconsumers living inland purchasing automobiles. From the world financial crisis until the end of 2010, thegovernment lowered the acquisition tax on compact automobiles with displacement of 1.6L6 or less (from 10%to five percent) and introduced a subsidiary system for purchasing automobiles in rural areas. Since 2012,systems such as those reducing taxes for owning energy saving automobiles and subsidiary systems forcompact automobiles with a displacement of 1.6L or less have been introduced with the purpose of providingeconomic support. The expansion of the inland market has led to an increase in demand for compactautomobiles at low prices. There are a lot of consumers who will purchase their first automobile in inland areasso there is a large demand for low-cost entry models.Import tariffs for passenger vehicles five years after China originally joined the World Trade Organization(WTO) (2001) decreased from 70%-80% in 2001 to 25% in 2006 at an average decrease of 10% annuallywhich led to companies one after another in China and overseas starting production of automobiles before andafter China joining the WTO (see Figure 3). At the same time, completely build-up (CBU) makers established asales network at a rapid pace in inland areas and actively introduced low-cost compact automobiles to themarket making price competition more intense. This resulted in a continuous decrease in the average price ofautomobiles compared to the previous year with a 13.1% decrease in 2004, three percent in 2005, 6.5% in 2006and 7.2% in 2007. According to the China Association of Automobile Manufacturers, the Shanghai VWSantana which was an exemplary automobile of 1995 was sold for 160,000 CNY per unit. This is 12 times theaverage annual household income at the time. The price of the 2007 Santana decreased to 70,000 CNY which is1.7 times the average annual household income. After that, according to reports focusing on price observationsby the National Development and Reform Commission of China, the average sales price of automobilescontinuously decreased from 114,083 CNY in 2007 to 103,175 CNY in 2012. The annual average rate ofdecrease over the five year period was two percent (SEKI, 2014).During this period, sales of compact automobiles with a displacement of 1.6L or less increased rapidly andthe percentage of these automobiles among total passenger vehicle sales rose from below 50% in the first halfof the 2000s to over 60% in the latter half of the 2000s (see Figure 2). Among these trends, the increase in562014 China Statistical Yearbook, pp160.L refers to liter of displacement.
THE CHINESE AUTOMOBILE MARKET AND THE STRATEGIES245automobiles with a displacement of 1.4L-1.6L especially following the decrease in prices was prominent withthis percentage doubling. Meanwhile, automobiles with a displacement over 1.6L and low prices of around100,000 CNY focusing on the VW Santana7 and Ford Focus have become mainstream, and sales of SportUtility Vehicle (SUV) have also been favorable in recent years.Figure 2. Percentage changes in sales volume of different displacement of passenger cars.Source: made by Jin Chen based on “structure of automobile different productivity and sales volume”, Chinese AutomotiveYearbook 2005-2014.Notes. L refers to liter of displacement.Nevertheless, the demand for those buying their first car still accounts for a majority of the Chinesepassenger vehicle market but there has also been a definite increase in those replacing their cars which was at13.4% in 2009 and 20.4% in 2013. In add
The Chinese Automobile Market and the Strategies of European, . Ford is at 28%, VW is at 17% and Hyundai is at 17%. Meanwhile, Nissan has made strenuous efforts to maintain a 10% growth rate, while Toyota is at nine percent and Honda is at seven percent, which is far behind the above mentioned top makers. Moreover, the growth rate of Geely (five percent), BYD (three percent) and Chery (two .