Transcription
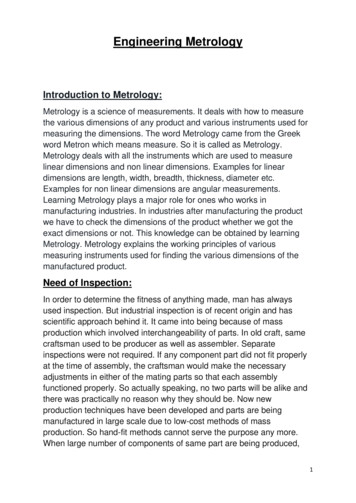
MetrologyMetrology, the science of measurement, is a most important activity in the recording of sound: what we recordis in fact a measurement of the sound pressure or electronic signal amplitude we wish to preserve. In order tomanipulate and record audio signals, we measure characteristics of the signal, generally amplitude as a functionof time, and in some manner preserve that measurement. Analog magnetic tape stores a continuous magneticpattern representation of the signal. Digital audio systems measure the signal amplitude, producing a list ofdiscrete measurements at regular times that can then be treated like any other computer data. Since soundmeasurements are a function of time, we must have a way of measuring time as well. Once we have a reliablemeasure of time and the signal, we can manipulate the signal electronically or numerically and make changesto suit our artistic desires: we can process and mix sounds into sonic landscapes that never before existed.Appreciating that the quality of a recording depends on how well we are able to make a measurement is animportant first step in the study of sound recording.Sound Intensity (y)Output (y)In order to study the recording process in an organized way, we should first familiarize ourselves with thetools involved in the investigation. We are interested in the processes that allow the permanent storage ofinformation contained in the transient air pressure variations we call sound. Because sound recording involvesacoustics, mechanics, electronics, magnetism, and even physiology and psychology, we will need to employthe tools of science. Since we are concerned with measurements of the behavior of air pressures, electronicsignals, and magnetism, physics is the branch of science that develops our understanding of these systemsand it uses mathematics as the descriptive language. It turns out that similar mathematical descriptions applyto electronics, acoustics, and mechanics, so understanding an occasional equation will help to explain andunderstand the fundamentals of sound recording.y 0.5 x432112345Input (x)Figure 1 Lineary 1/ x24321162345Distance (x)Figure 2 Non-linear6When we seek to establish how two phenomena are related, we do so by plotting a graph comparing two ormore sets of measurements termed variables. The variable we control is called the independent variable whilethe one we measure is called the dependent variable because its value depends on the value of the independentvariable we choose. For example, we might wonder how the amplitude of a sound system varies withfrequency. We measure the amplitude at a number of frequencies and plot amplitude against frequency. Theshape of the resulting curve shows us the function that describes the relationship between the two properties,in this case the frequency response of the system. Often such measurements fall along a straight line, in whichcase we call the relationship linear. Linearity is a requirement of most audio systems: for instance, we want theoutput of an audio amplifier to be a linearly amplified version of the input. In this case, the gain of the amplifieris the slope of the line plotting output voltage (y-axis) against input voltage (x-axis), where the slope is theoutput level divided by the input level (Fig. 1). For a linear system, this value is constant: in Fig. 1, the outputis always half (x 0.5) the input level regardless of the input voltage. Other relationships, like the intensity of asound as a function of distance from the source for example, are more complicated and deviate from linearity(Fig. 2). Nonlinear relationships are sometimes encountered that can lead to distortion in audio systems.1
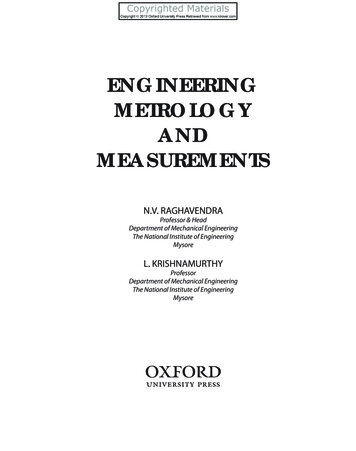
Distortion is simply a change in the signal. It may even be used intentionally, as in the case of the audiocompressor and guitar amplifier. Some forms of distortion are more noticeable than others. Understanding howlinear and nonlinear systems are described mathematically will help clarify the difference.As long as the variables under consideration are related by an equation not containing variables multipliedtogether or raised to powers, it is a linear relationship. Linear processes include mixing, in which signals areadded together, and amplification, in which a signal is multiplied by a constant, the gain factor. Nonlinearrelationships include modulations, in which one signal is multiplied by another (as in AM and FM radio),and exponential or logarithmic relationships. Nonlinear systems create distortion of the original signal byintroducing harmonics (multiples) of signal frequencies that were not present in the original signal source.Audio signals, whether measured as sound pressure levels or electronic voltages, are often represented as sinewaves. Music, in fact all sounds, may be described using combinations of sine waves with varying amplitudes,frequencies, and phase relationships. Although real musical signals are quite complex, we often employ simplesinusoidal test signals in measuring audio systems. Sine waves are actually mathematic functions:Figure 3y A sin(x),where the amplitude y equals some maximum value A (A 1 in Fig. 3) multiplied by the sine of the variable x,with x ranging from 0 to 2π to generate one complete cycle. The sine function can be generated by the rotationof a point on a circle with a radius of 1, called the unit circle. If the point starts at the 3 o’clock position androtates counterclockwise along the circle circumference, it generates a sine wave. (When the point starts at themaximum y 1 (12 o’clock) instead of from y 0, it generates the cosine function.) At any angle of rotation,the height of the sine wave along the y-axis will be the sine of the angle and the x-position will be the angle ofrotation in radians. While we are familiar with degrees as the measure of angles where 360º describes a fullcircle, mathematics prefers the radian as the angular measure. There are 2π radians in a full circle and thereforein a complete sine wave cycle.Figure 4 The unit circle and the sine wave2
The phase of a sine wave is a measure of the displacement from the origin, along the x-axis, of its beginning,the positive-going 0 crossing. When beginning at the origin, the phase is taken to be zero. The amount ofrotation of the unit circle required to turn one sine into the other is the relative phase angle. As we add sinewaves together to make a complex signal, the relative starting points of the various sine components determinethe phase relationship between them. If two sine waves are exactly in phase, they add constructively. If theyare 180º (π radians) out of phase, they cancel completely provided they are of the same amplitude. We willsee examples of such cancelations when we consider room acoustics and microphone polar patterns. Someelectronic circuits alter the relative phases of the different frequency sine components of a signal in rathercomplex ways, notably filters.Since sine waves are simple mathematical functions, they are easily described. We can measure the peak-topeak swing of the signal, the absolute value of the signal, or even a time-average of the signal amplitude. Usingsine waves as our test signals has its pitfalls though: real complex audio signals do not adhere to the samesimple relationships that exists between these different measures when applied to simple sine waves. It willbecome apparent that how we choose to measure a signal makes a difference.To keep track of our work, we are interested in displaying information about our audio signals graphically. Byfar the most common audio measurement is the signal amplitude. We need to create a meaningful display of themeasurement that is easily interpreted and relatively inexpensive to duplicate, especially if we’re dealing withdozens of separate signals, as is often the case with multitrack recordings. Early audio recording equipmentsolved this problem by using mechanical meters with a moving needle. More recently, we have seen thepopularity of LED ladder displays. Each of these graphical indicators must conform to a set of rules abouthow we measure and display signal levels in order to be unambiguous. Since there are alternative methods ofmeasuring the amplitude of signals, we should know which of these is employed in the graphical display we areusing.Figure 5Sine amplitude measurementsThe amplitude of a sine wave can be measured in different ways. The peak-to-peak measurement will tell usthe swing between maximum and minimum values of our signal, but this may not directly correspond to theapparent loudness of that signal. The method that most closely approximates how we experience the loudnessof a signal is the root-mean-squared (RMS) measure, in which we analyze the signal level over some timewindow and compute the square root of the mean of the squared value of the measured level. This is a rathercomplicated measurement to make, so a simpler method is often used: the average value. This value can becomputed with simple analog circuitry, but it is a slightly less accurate measure of the perceived loudness ofthe signal. One problem with both of these approaches is that they average the signal, a process that will fail totrack the maximum value of the signal. Since the maximum value determines how much signal the system mustbe able to accommodate, we are in danger of overloading the electronics if we simply measure the average leveland ignore the peaks. Therefore very fast displays have evolved to augment the loudness-oriented displays.These peak-oriented displays may be as simple as an LED that flashes as the signal level approaches the limitsof the electronic system.3
Multiply below byx to convert to --- .90.7071Table 1 Sine amplitude measurement conversion factorsFor sine waves, there is a simple conversion factor between these different measurements (Table 1). We noticethat for a sine wave, the average level is 63.7% of the peak value while RMS is 70.7%. Unfortunately, foractual complex audio signals this simple relationship does not hold, so meters using different measures will notagree. In the studio, we often have to use equipment calibrated to different standards of measurement and weneed to understand how they relate if we are to get the best performance from the system.The range of values we encounter when measuring amplitude and frequency is enormous. We can hearfrequencies from 20 Hz to 20 kHz (at least some people can) and hear sound levels from near silence topainfully loud, about six orders of magnitude in sound pressure amplitude. Working with numbers over thisrange is problematic, so mathematical shorthand is in order: the logarithm. Logarithms are exponents: thepower to which a base number must be raised to equal the number in question. For example, the log10 (log base10) of 100 (102) is 2. In the audio world, we generally use base 10 (unless otherwise designated, “log” impliesbase 10) however many physical processes are described by the so-called natural logarithm ln (base e 2.718 don’t ask) and digital signal processing is conducted ultimately in binary, or base 2. By using logarithmicmeasures, we avoid lots of 0’s and keep the number of digits small.base10xx-2-1-0.500.3030.50.6030.903123Table 2exponent10x0.010.10.316123.1648101001000Exponents in powers of 104
There are properties of logs that simplify their use. Any base to the zero power is one. Negative exponentsyield numbers less that one, with a negative exponent giving the reciprocal of the positive value of the sameexponent. Positive whole number exponents base10 correspond to the number of zeros following the one.Logarithms only exist for numbers greater than zero.Figure 6 y log(x)The primary audio application of the logarithm is the decibel. Since signal amplitude measurements mustbe made over many orders of magnitude, the bel (log10 (power2 power1 )) was adopted as a unit of measureby the early telecommunications industry. While appropriate in telegraphy where signal power transmissionwas important, the unit was too large to be convenient for electronic audio circuits and the decibel (1/10th bel)is now used. An important attribute of the decibel is that it isn’t an absolute measure, but rather a ratio. It isused to describe how much larger or smaller a sound level or signal amplitude is than a standard referencelevel. Reference levels are chosen according to the application: they may represent the quietest sound we canperceive (dB SPL), the maximum signal a system can produce (dB FS), the recommended input level a device isdesigned to see (dBv), or whatever we choose (VU). Each of these assumes a different reference quantity. Wewill later discuss the various reference levels and why some decibels are 20log10(x) while others are 10log10(x).decibel 10log10power2voltage 2 20log10power1voltage1MeasurementQuantityReference LevelSound Pressure0 dB SPL 0.0002 dyne/cm2Voltage0 dBV 1 voltVoltage0 dBu (or dBv) 0.775 voltPower0 dBm 0.001 wattTable 3Amplitude conversion factors5
In dealing with physical systems, we are often describing quantities like forces. A force has two components:a magnitude and a direction or phase. In order to mathematically describe a force, we employ vector math.An example of a vector we commonly encounter without trepidation is wind: it has a velocity and a direction.Similarly, a force has a magnitude and a direction. (Measures of magnitude without a direction are calledscalars: temperature, for example.) We can draw a vector as an arrow of length proportional to magnitude andpointing in the direction of the action. If we wish to add or combine two forces, we must use vector math inorder to combine both the magnitude and direction information.Figure 7Vector addition The above diagram shows how vectors add. Vectors B and B combine to produce vector C : in order to getthe magnitude and phase or direction correct we must use vector addition. The magnitude and direction of theresulting vector are found by separately adding the x and y components of the individual vectors. While usingvector math simplifies computations for mechanical,we will only need to acoustic, and electronic systems, understand that vector math is different from scalar math for the purposes of our investigation.Figure 8Polar coordinatesAnother technique often used in describing magnitude and direction is polar coordinates. Instead of plottingvectors by giving pairs of Cartesian coordinates (x,y), polar coordinates consist of a magnitude and an angle(r,θ). This technique makes tasks like describing microphone directional sensitivity patterns and soundradiation patterns simpler, since the length of the line r indicates the microphone’s sensitivity (output voltage fora given sound level input) and the angle θ indicates the direction from which the sound originates.6
z x yiVectors can also be represented as complex numbers: numbers with real and imaginary components. While thisis not our usual way of thinking about numbers, the use of imaginary numbers makes analysis of acoustic andelectronic systems simpler. We are familiar with real numbers, but imaginary numbers may not be so obvious.The square root of –1 is an imaginary number, since there is no real number which, when squared, generatesa negative number. So we make some up: i and j. These are simply defined as the square root of –1 eventhough we don’t come across such numbers in our daily activities (unless we’re physicists or engineers.) If wemake the real part of the number represent the magnitude of the vector and assign the imaginary part the roleof describing direction or phase, we can use a single number to represent both components of the vector. Byapplying algebraic manipulation to the complex numbers, vector computations become more convenient.We will not need to use vector mathematics much in our quest for a scientific understanding of audio recording,but we need not be intimidated by its presence when encountered in technical papers. It is merely a descriptivelanguage to simplify the complex task of accurately and precisely analyzing complicated behavior of electronicand acoustic systems.Units of MeasureIn order to apply mathematical analysis to our meaurements, we need a standardized set of units of measure.Unfortunately, the need to standardize our system of measurement has led to several competing systems indifferent parts of the world. Most of the world uses the metric system while the US continues to use the olderBritish system. The scientific community has adopted the metric system and that will be used here, although wewill sometimes include British measurements as well since they are more commonly understood in the US.The metric system uses the meter as a unit of length, the gram as the unit of mass, and the second as the unitof time. For large measurements, the MKS (meter-kilogram-second) system is convenient, while for smallermeasurements the CGS (centimeter-gram-second) system is preferred. Scientists have adopted a system knownas the International System of Units (SI) as the preferred system of measure. Some frequently used SI units ofmeasure are shown in Table 4.Quantitydistancetimemassforcepressurework, energyelectric currentmagnetic fluxmagnetic field strengthSI Unit of Measuremetersecondkilogramnewton (N)pascal (P)joule (J)ampere (A)weber (Wb)ampere-turns/meter (A.m-1)Table 4 SI and cgs units of measure7CGS Unit of Measurecentimetersecondgramdyne ( 10-5 N)barye ( 0.1 P)erg ( 10-7 J)amperemaxwell ( 10-8 Wb)oersted ( 79.6 A.m-1)
PhysicsWhen we think of sound recording, we usually think of microphones, wires, mixing boards and tape recorders.Or perhaps we think of computers and plug-ins now, but the basic foundation of the process of recordingsound lies in the physics that describes the behavior of molecules and electromagnetic fields. The most criticalelements of the recording process, the transduction of air pressure variations into voltage changes and thestorage of the converted information as magnetic or optical records, involve the science of physics. Physics is abranch of science that seeks to describe and quantify the behavior of matter and energy in the precise languageof mathematics. Since the interaction of air molecules with a microphone transducer element determines howaccurately we are able to record the different sound frequencies and how the microphone responds to soundsfrom different directions, we benefit from an understanding of the physics involved. While the final decisionabout how well a microphone performs rests with our ears, understanding the physics involved helps usdecide which microphone type and placement is likely to produce the desired result without listening to everymicrophone in every position possible.We begin our discussion of physics by considering the basic principles of Newtonian mechanics. Much of ourmodern understanding of the physical world begins with the 17th century work of Sir Isaac Newton. Whileeveryone who has thrown a baseball innately knows how it will behave, the mathematical equations that predictthe path it takes are less well known. Newton’s three laws describe the basic behavior of matter and energy insimple mathematical terms.Figure 9DisplacementTo understand the physics of mechanical systems, we need to consider the basic properties of objects. Massis the property we associate with the weight of an object, however strictly speaking that is only due to ourearthly frame of reference and the pull of its gravity. Nonetheless, our everyday experience gives an intuitiveunderstanding of what mass is. Displacement is the distance and direction an object moves. Velocity is the rateand direction of movement, its magnitude is the first derivative of position with respect to time (dx/dt). Sincedisplacement and velocity have both magnitudes and directions, they are vector quantities. (The magnitude ofvelocity is the scalar we call speed.) Changing velocity is acceleration, the first derivative of velocity (dv/dt)with respect to time and the second derivative of position (d2x/dt2) with respect to time. Force describes a pushor pull on an object, like the pull of gravity or the electric force of voltage on electrons. The more mass an8
object possesses, the more work a force must do to move it. That work is measured in terms of power or energytransferred. While we intuitively know these terms, formalizing their definitions is not so obvious.Newton’s First Law states that if no force is exerted on an object, its velocity cannot change. This is oftensimplified as “a body at rest tends to remain at rest.” While we understand intuitively what a force is, it is lessclear how to formally describe it. Loosely, force is a push or pull on an object. We deal with forces when weconsider how air movement propagates and pushes and pulls on the diaphragm of a microphone. Forces arealso involved in electric circuits and magnetic attraction and repulsion.Newton’s Second Law states that the net force on an object is equal to the product of the mass and itsacceleration, or in equation form: F ma where F is the force vector, m is the mass and a is the acceleration or change in velocity. Note that force andacceleration both have a direction of action as well as a magnitude and are therefore represented by vectors.This simple relationship describes a surprising percentage of physical interactions.Newton’s Third Law states that when two objects interact, the forces exerted by the objects on each other areequal in magnitude and opposite in direction or, “for every action there is an equal and opposite reaction.”)This can be illustrated by a drunk leaning on a light pole: each object exerts an equal force on the other but inopposite directions, hence neither accelerates. It also applies to billiard balls bouncing off one another, muchlike molecules behave on a smaller scale. Using only Newton’s laws, we are able to describe most of thephysics involved in recording sound.Since we use electronic and magnetic representations of sound, we also need to understand electromagnetism.Electronic circuits are analogous to mechanical systems. Voltage is the equivalent of mechanical force, pushingcharges through a circuit. An inductor acts as a mass, storing energy in a magnetic field, while capacitorsbehave like springs, storing energy in an electric field. Resistors act like friction, simply dissipating energy asheat and opposing the flow of charge. Magnetism exerts a force on susceptible particles much like a voltagedoes on a charged particle. Magnetic and electric forces have a direction as well as a magnitude and aretherefore represented by vectors. The distribution in space of electric and magnetic forces is described by acollection of vectors with a magnitude and direction for every point in space. The representation of these fieldsis usually an arrangement of lines of force eminating from one pole (north or south pole for magnetism andpositive or negative charge for electricity) and terminating at the opposite pole. The greater the path length, theweaker the force at points along that path. (This makes sense if you consider the overall strength of the forcebetween the poles is constant and the distance over which the force is exerted grows as the path lengthens.Therefore the difference in force per unit of distance decreases as the path length increases.)Figure 10 Dipole lines of force9
When a force causes the movement of an object, energy is transfered to the object and work is done. Energymay take one of two forms: potential and kinetic. An object at rest may possess potential energy but its kineticenergy is zero. A moving object has kinetic energy and may also have potential energy. The amount of kineticenergy in a physical system is:1K mv 22where K is the kinetic energy (measured in joules), m is the mass and v is the velocity. Potential energyrepresents the ability to do work even if no work is currently being done: a ball at the top of a hill, for example.Mechanical systems allow for the back and forth interchange of potential and kinetic energy, however thetotal amount of energy in a closed system remains constant. In the case of gravitational potential energy, therelationship is represented by the equation:U(y) mgywhere U(y) is the potential energy at a height of y (meters), m is mass and g is the force of gravity. There areother forms of potential energy, tension in a spring for example. Voltage, also called potential, is a form ofpotential energy.It will help in the explanation of how microphones operate and how electronic circuits function if we keepin mind the simple physical interactions that underly the more complex processes. Our physical models ofsystems are correct only to some level of approximation. In most cases we can describe a system well enoughto understand the basic operations involved in recording sound with simple mathematical descriptions, realizingthere are often more subtle factors at play if we carefully scrutinize the processes. A complete picture ofthe magnetic field generated by a record head and its interaction with tape takes an entire book, still we canunderstand how bias current adjustments shape the recovered sound recording by using a quite simplifiedmodel. Circuit designers sometimes find they cannot explain what they hear even by detailed analysis, but weare at first concerned with understanding the everyday audio world. 2005-2012 Jay Kadis (For educational use only)A full version of this chapter is now published in print form, available from Amazon, other onlinebooksellers and local bookstores:The Science of Sound RecordingJay KadisFocal Press, 2012ISBN 978-0-240-82154-210
Metrology Metrology, the science of measurement, is a most important activity in the recording of sound: what we record is in fact a measurement of the sound pressure or electronic signal amplitude we wish to preserve. In order to manipulate and record audio signals, we measure charact