Transcription
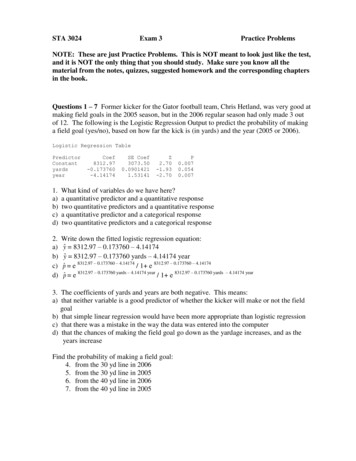
STA 3024Exam 3Practice ProblemsNOTE: These are just Practice Problems. This is NOT meant to look just like the test,and it is NOT the only thing that you should study. Make sure you know all thematerial from the notes, quizzes, suggested homework and the corresponding chaptersin the book.Questions 1 – 7 Former kicker for the Gator football team, Chris Hetland, was very good atmaking field goals in the 2005 season, but in the 2006 regular season had only made 3 outof 12. The following is the Logistic Regression Output to predict the probability of makinga field goal (yes/no), based on how far the kick is (in yards) and the year (2005 or 2006).Logistic Regression 0-4.14174SE 0540.0071.a)b)c)d)What kind of variables do we have here?a quantitative predictor and a quantitative responsetwo quantitative predictors and a quantitative responsea quantitative predictor and a categorical responsetwo quantitative predictors and a categorical response2.a)b)c)d)Write down the fitted logistic regression equation:ŷ 8312.97 – 0.173760 – 4.14174ŷ 8312.97 – 0.173760 yards – 4.14174 yearp̂ e 8312.97 – 0.173760 – 4.14174 / 1 e 8312.97 – 0.173760 – 4.14174p̂ e 8312.97 – 0.173760 yards – 4.14174 year / 1 e 8312.97 – 0.173760 yards– 4.14174 year3. The coefficients of yards and years are both negative. This means:a) that neither variable is a good predictor of whether the kicker will make or not the fieldgoalb) that simple linear regression would have been more appropriate than logistic regressionc) that there was a mistake in the way the data was entered into the computerd) that the chances of making the field goal go down as the yardage increases, and as theyears increaseFind the probability of making a field goal:4. from the 30 yd line in 20065. from the 30 yd line in 20056. from the 40 yd line in 20067. from the 40 yd line in 2005
Question 8 - 13 As part of a project for their Intro Stat course, two students compared twobrands of chips, Frito Lays and Golden Flakes, to see which company gives you more foryour money. Five bags of each brand (which, according to the label, each contained 35.4grams) were measured with a very accurate scale. Use the Wilcoxon Rank-Sum test to seeif there are any significant differences between the two brands in the amount of product theyput in their bags.Frito Lays:35.335.435.835.935.9Golden Flake: 35.337.838.838.142.58.a)b)c)d)The null hypothesis is about:the mean contents of the bags for Frito Lays and Golden Flakes brandsthe mode of the contents of the bags for Frito Lays and Golden Flakes brandsthe distribution of the contents of the bags for the two brandsthe number of bags with contents below the label weight for the two brands9.a)b)c)d)The alternative hypothesis, according to the problem stated above, is that:Frito Lays gives you more chips than Golden FlakesFrito Lays gives you less chips than Golden FlakesFrito Lays gives you either more or less chips than Golden FlakesGolden Flakes gives you more chips than the amount stated on the label10. The bags that contained 35.9 grams will receive a rank of:a) 4b) 4.5c) 5d) 5.5e) 611. The p-value for the test was .1164. We conclude that:a) Frito Lays gives you more chips.b) Golden Flakes gives you more chips.c) There is not enough evidence to prove a difference between the two brands.d) There is enough evidence to prove a difference between the two brands.12. If the assumptions for the Normal based procedure were satisfied, we could analyze thedata with a confidence interval for:a) μb) μ1-μ2c) μdd) η 1- η 213. Why is it not a good idea to use the Normal-based procedure here?a) the data was not randomly selectedb) the data does not have a continuous distributionc) the outlier violates the assumption of Normalityd) the nonparametric method is always better
Questions 14 - 18 Do plain and peanut m&m's have the same distribution of colors?Several bags of each variety (plain and peanut) were randomly selected, and the number ofcandies of each color were counted before eating any of them. The data appears 41294peanut177271314169498916830445738814. The null hypothesis is that:a) plain and peanut varieties are independentb) the colors are independent of each otherc) color and variety are independent of each otherd) all of the above15. The expected number of blue, peanut m&m's (under independence) is:a) 15.0b) 15.67c) 7.27d) 32.3316. The sampling distribution is χ 2a) 5b) 10c) 11with degrees of freedom equal to:d) 1217. The test statistic was 32.67. Use the table to approximate the p-value for this test:a) smaller than .001b) equal to .05c) between .05 and .10d) between .950 and .97518. What conclusions can you reach from this analysis, based on the data and the teststatistic given?a) There is something wrong with the data, maybe the m&m's were not randomly selected.b) The distribution of colors is not significantly different for plain and peanut m&m's.c) Peanut m&m's are significantly more colorful than plain m&m's.d) There are significantly more brown m&m's than orange m&m's.
Questions 19 - 21 Match each of the Nonparametric procedures presented on the left withthe corresponding experimental design from the list on the right (use each alternative onlyonce).19. Kruskal-Wallis H Test20. Wilcoxon Rank-Sum Test21. Wilcoxon Signed-Rank Testa) two independent samplesb) paired samplesc) several independent samplesQuestions 22 -24 Five sets of identical twins were selected at random from a population ofidentical twins. One child was selected at random from each pair to form an "experimentalgroup." These five children were sent to school. The other five children were kept at homeas a control group. At the end of the school year the following IQ scores were obtained.Does this evidence justify the conclusion that lack of school experience has a depressingeffect on IQ scores? Analyze the data with the Wilcoxon Signed-Rank olGroup11212012813512622. The sums of the ranks for this test are:a) W 13W- 2b) W 24c) W 9d) W 30W- 223. The data shows some evidence that:a) the experimental (school) group tends to have higher IQs than the control (home)group.b) the experimental (school) group tends to have lower IQs than the control (home)group.c) the experimental (school) group tends to have IQs similar to the control (home)group.d) the experimental (school) group tends to have IQs different from the control(home)group.24. Which of the following (one-sided) p-values looks reasonable for this data?a) 0.0001b) 0.9663c) 0.0885d) 0.4367
Questions 25 – 29 Data collected to study the relationship between child obesity and parentalobesity is shown in the following contingency t25. What is the null hypothesis being tested?a) the proportion of obese and nonobese parents are the sameb) the proportion of obese and nonobese children are the samec) the proportion of obese children is the same for obese and nonobese parentsd) all of the above26. How many obese children were involved in the study?a) 34b) 50c) 63d) 10027. What are the expected counts for each category under the null hypothesis (in the sameorder as the given table)?a) 34 2916 21b) 35153020c) 31.5 31.518.5 18.5d) 22.1 22.122.1 22.128. How many degrees of freedom are associated with the X2 test?a) 4b) 3c) 2d) 129. Find the contribution to the Test Statistc of the parent obese/child obese cell.
Questions 30 – 32 An experiment was conducted to determine whether a test designed toidentify a certain form of mental illness could be easily interpreted with little psychologicaltraining. The test was given to 100 people (half of which had the illness, and half didn't) andfifteen people were asked to evaluate them. The fifteen judges were five staff members of amental hospital, five trainees at the hospital, and five undergraduate psychology majors. Theresults in the table give the number of the 100 tests correctly classified by each judge.Analyze the data with the Kruskal-Wallis 78807530. The ranks for the observations on the first row should be:a) 2 31b) 7 91c) 8.5 121d) none of the above31. The highest rank given to any observation is:a) 11b) 5c) 15d) 332. If the p-value of the test is small we would conclude that there are:a) differences between staff, trainees and students in their ability to interpret the testb) no differences between staff, trainees and students in their ability to interpret the testc) differences in the individual judges abilities to interpret the testd) no differences in the individual judges abilities to interpret the testQuestions 33 – 35 Questions regarding the use of Nonparametric procedures:33. Which of the following kinds of data can be analyzed with Nonparametric procedures?a) normalb) continuousc) ranksd) all of the above34. Which of the following kinds of data should be analyzed with Nonparametricprocedures?a) normalb) continuousc) ranksd) all of the above35. Given that all the necessary assumptions for each test are satisfied, which are morepowerful at finding significant differences?a) Nonparametric procedures, since their assumptions are generally easier to satisfy.b) Normal-based procedures, since they take into consideration the shape of thedistribution.c) Nonparametric procedures, since their assumptions are generally harder to satisfy.d) Normal-based procedures, since they work for distributions of almost any shape.
Questions 36 - 40 For each of the following stories, determine which would be the simplest type ofstatistical analysis that would be appropriate to use. Use each type of analysis only once.a)Paired t testb)Two sample t-testc)ANOVAd)Kruskal-Wallise)Wilcoxon Rank-Sum Test36. Compare the average number of hours per week spent on Facebook for Freshmen, Sophomore,Juniors and Seniors at UF, based on a random sample of 100 students.37. Compare the distribution of the number of hours per week spent on Facebook for Freshmen,Sophomore, Juniors and Seniors at UF, based on random samples of 10 students per group, which hadquite different standard deviations.38. Compare the average number of hours per week spent on Facebook during the first week inApril and the first week in May (finals week) for random students at UF, measured on the same 100students.39. Compare the distribution of the number of hours per week spent on Facebook for male andfemale students at UF, based on a random sample of 10 students. There was an outlier in one of thegroups.40. Compare the average number of hours per week spent on Facebook for male and femalestudents at UF, based on a random sample of 100 students.Questions 41 - 45 For each of the following stories, determine which would be the simplest type ofstatistical analysis that would be appropriate to use. Use each type of analysis only once.a)Confidence Interval for One Proportionb)Contingency Tablec)Simple Linear Regressiond)Multiple Regressione)Logistic Regression41. Predict the average number of hours per week UF students spend on Facebook, based on theirage and gender.42. Estimate the fraction of UF students who have Facebook accounts.43. Determine if the fraction of UF students who have Facebook accounts is different for Malesand Females.44. Determine how the probability that a UF student has a Facebbok account changes with thestudent’s age.45. Predict the average number of hours per week UF students spend on Facebook, based on thestudent’s age.
Questions 46 – 49 Which drug slows reaction time the most? The following are the reaction times (inmilliseconds) for randomly selected subjects who took either Drug A or Drug B.Drug A1.962.241.712.411.621.93Drug B2.112.432.072.712.504.842.8846. These data represents:a) two independent samples, but it would have been better to collect data for matchedpairs, since reaction times can vary greatly by individual.b) matched pairs, but it would have been better to collect data for two independentsamples, since reaction times can vary greatly by individual.c) quantitative data, but it would have been better to collect categorical data on whethereach subject reacted more slowly under Drug A or B.d) categorical data, but it would have been better to collect quantitative data on whethereach subject reacted more slowly under Drug A or B.47. We could analyze this data with a t test or a Nonparametric procedure. When choosingwhich procedure works best here it’s important to note that:a) there are more observations for one treatment than the otherb) the variances of the two groups are quite differentc) there is an outlier in the datad) all of the abovee) none of the above48. If we conduct the Wilcoxon Rank-Sum test on this data, the sum of ranks for drug B is:a) 25b) 66c) 28d) 21e) 5349. The best interpretation of the results from the computer output shown below is:a) There are significant differences in the mean reaction time for Drug A and B.b) There are significant differences in the median reaction time for Drug A and B.c) Reaction times are slower for Drug B, on average.d) Reaction times are slower for Drug B, overall.50. Are there any problems with the assumptions for the analysis below?a) No problems if we can trust the subjects were really random.b) No problem since the story states the subjects were chosen randomly.c) There is a problem since looking at the data we don’t trust the subjects were really random.d) There is a problem since the sample size requirement is not satisfied.Mann-Whitney Test and CI: DrugA, DrugBN MedianDrugA 61.945DrugB 72.500Point estimate for ETA1-ETA2 is -0.52096.2 Percent CI for ETA1-ETA2 is (-1.260,-0.110)W 25.0Test of ETA1 ETA2 vs ETA1 not ETA2 is significant at 0.0184
4.
STA 3024 Exam 3 Practice Problems NOTE: These are just Practice Problems. This is NOT meant to look just like the test, and it is NOT the only thing that you should study. Make sure you know all the material from the notes, quizzes, suggested homework and the corresponding chapters in the book.