Transcription
PRACTICE APPLICATIONSTopics of Professional InterestAccurate Coding Impacts the Geometric Lengthof Stay for Malnourished InpatientsCHANGES IN HEALTH CARE,such as rising costs andrevised reimbursement practices like the hospital ValueBased Purchasing program,1 haveresulted in a heightened focus on quality of care. Hospital performance,measured by patient outcomes suchas hospital acquired conditions andreadmission rates, has affected reimbursement rates since 2012 and is publicly reported.1 Good patient outcomesalso have the benefit of reducing a hospital’s average length of stay (LOS),thus lowering the cost of care. Thefocus of this article is to review previous literature exploring the associationbetween malnutrition and LOS and todemonstrate the importance of accurately coding for malnutrition toensure expected LOS is determinedaccurately, using an example from acommunity hospital.MEDICARE REIMBURSEMENTPROCESSMedicare determines expected LOS andreimbursement rates for hospitals using the Inpatient Prospective PaymentSystem,1 and some commercial insurance companies follow their lead. Thismeans that hospitals are usually notpaid using a fee-for-service modelwhere individual expenses, such asmedications, procedures, laboratorymeasurements, or tests, are reimbursed. Rather, they are paid one lumpsum for each patient’s hospital staybased on the Centers for Medicare andMedicaid Services’ (CMS) complexThis article was written by JenniferDoley, MBA, RD, FAND, regional clinical nutrition manager and certifiednutrition support clinician, and WendyPhillips, MS, RD, FAND, division director of clinical nutrition, certifiednutrition support clinician, and certified lactation educator, both withMorrison 023ª 2018 by the Academy of Nutrition and Dietetics.analysis of the average cost of care totreat patients with the same or similarprincipal and secondary diagnoses.At discharge, based upon providerdocumentation in the electronic healthrecord for that particular episode ofcare, the principal and all secondarydiagnoses that impact the carerequired for each patient must bedocumented on the Medicare claimform using codes from the InternationalClassification of Disease, 10th edition,Clinical Modification (ICD-10-CM).1Cases are then assigned to diagnosisrelated groups (DRGs), the CMS classification system that groups similardiagnoses together (Figure 1). The DRGassignment is determined by the patient’s principal diagnosis, up to 24secondary diagnoses, and up to 25procedures performed during the stay.To further refine payment to betteraccount for severity of illness andresource consumption for Medicarepatients, CMS modified the DRG classifications by designing the MedicareSeverity (MS)-DRG system. There arethree levels of severity in this systembased on secondary diagnoses andprocedures, as documented using ICD10-CM codes. A designation of MajorComplications/Comorbidities(MCC)reflects the highest level of severity,with Complications/Comorbidities (CC)indicating the next level of severity.Secondary diagnoses that CMS hasdetermined do not significantly affectseverity of illness and resource use areclassified as Non-CC. CMS has designated different malnutrition diagnosesas MCCs, CCs, or Non-CCs for use in theMS-DRG system.Only one MS-DRG is assigned perdischarge; because there are 754different MS-DRGs available (for fiscalyear 2018),1 and because most patientshave several secondary diagnoses andprocedures, hospitals use coding software with algorithms to determine theproper MS-DRG assignment. Becausethis can be a complicated system tocomprehend, Figure 2 uses a simplifiedexample patient to demonstrate thesteps necessary to determine the MSDRG.A weight is assigned to each MS-DRGthat reflects the average cost to providecare for inpatients with that diagnosis,relative to the average cost to providecare for all Medicare patients; this isknown as the relative weight (RW).Although also influenced by severalother factors, multiplying the RW ofthe assigned MS-DRG by the hospital’sbase payment rate can provide an estimate of the Medicare payment thehospital will receive for that case.CMS completes an annual analysisusing billing and quality data submitted by hospitals to continually refinethe MS-DRG system to ensure that eachdiagnosis group includes cases withclinically similar conditions thatconsume comparable amounts of resources.1 They also assess secondarydiagnoses and may reassign them to adifferent level of severity (MCC, CC, orNon-CC). In addition, CMS may reassign diagnoses and procedures to adifferent diagnostic category, create anew DRG, or modify the RW or expected LOS. Updated DRG tables mustbe obtained from the CMS website eachfederal fiscal year (October 1 throughSeptember 30 of the following year) toensure that data analysis is accurate.2LENGTH OF STAYThe MS-DRG RW table referenced inFigure 1 includes the expected LOS foreach MS-DRG, differentiated as thearithmetic mean LOS and geometricmean LOS.2 The arithmetic mean LOSdoes not account for outliers, such aspatients who are in the hospital for asignificantly longer or shorter timethan expected for the assigned MSDRG.3 The geometric mean LOS doesaccount for these stays, reducing theeffect of these outliers on the expectedLOS. The geometric mean LOS is one ofthe components that Medicare considers when determining the RW andJOURNAL OF THE ACADEMY OF NUTRITION AND DIETETICS1
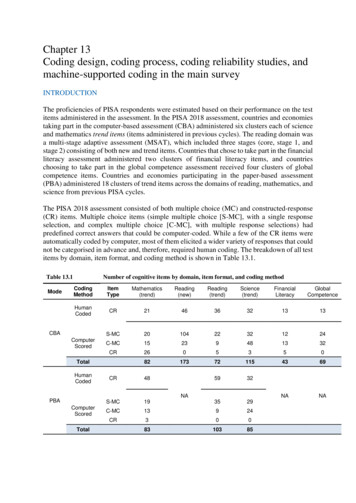
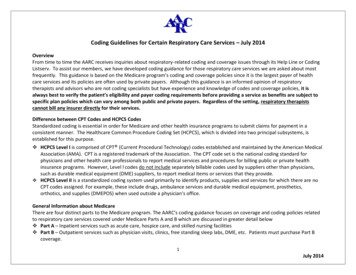
Figure 1. Screen shot of a section of Medicare’s Table 5 for Fiscal Year 2017—List of Medicare Severity Diagnosis-Related Groups, Relative Weighting Factors, and Geometricand Arithmetic Mean Length of Stay.2PRACTICE APPLICATIONS2JOURNAL OF THE ACADEMY OF NUTRITION AND DIETETICStherefore the reimbursement for eachMS-DRG. Because hospitals do notreceive extra reimbursement for additional hospital days (except for extremeoutlier cases), the goal is often todischarge patients before they exceedthe expected geometric mean LOS forthe assigned MS-DRG. Likewise, it isimportant to ensure all secondary diagnoses are properly coded to maximize the assigned MS-DRG to increasethe expected geometric mean LOS.Hospitals can compare their actualaverage LOS to the expected geometricmean LOS for each MS-DRG to gauge theirperformance against the Medicarebenchmark and identify possible patternsor performance improvement areas. Forexample, analysis of geometric mean LOSdata may reveal that patients admittedlate on a Thursday or Friday have a longerLOS than Medicare’s expected geometricmean LOS.3 This information can be usedto develop a performance improvementproject. Further review may suggest thatthe longer LOS is due to delays incompleting diagnostic tests and procedures over the weekend. This insight canthen be used to develop a plan of action toreduce the average LOS for that particulardemographic.Because CCs and MCCs influence LOS,an analysis of coding practices is alsoimportant when assessing a hospital’saverage LOS. For example, records ofpatients who underwent a specific surgical procedure, such as a colectomy,could be examined to determine ifmalnutrition was noted by the registered dietitian nutritionist (RDN). If themalnutrition is not coded as a CC or MCC(depending on severity level) and noother CCs or MCCs are identified, the staymay be assigned to an MS-DRG with alower RW than it should be, missing theopportunity for a higher payment andlonger expected geometric mean LOSagainst which to benchmark. Figure 3provides instructions on how to calculate the difference in expected geometricmean LOS if the malnutrition diagnosisis coded properly.MALNUTRITION AND LENGTHOF STAYMany research studies reporting the effect of malnutrition on LOS have beenpublished. However, the methodologiesused are highly variable, thus makingthe results difficult to compare andquantify. One complicating factor is that--2018 Volume-Number-
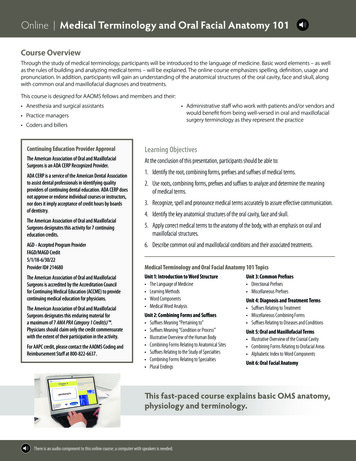
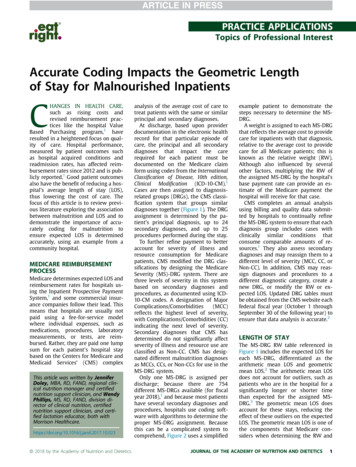
PRACTICE APPLICATIONSMS-DRGa Assignment ProcessExample PatientPrincipal diagnosis (reason admitted to the hospital): Perforation ofesophagus (ICD-10-CMd code K22.3)Step 1. Assign 1 of 25 MDCb based on principaldiagnosis causing that hospitalizationStep 1. Assigned to MDC 06: Diseases and Disorders of the DigestiveSystem.Step 2. Assign DRGc within that MDC based on theprincipal diagnosisStep 2. Assigned to DRG, Major Esophageal Disorder based onprincipal diagnosis.Step 3. Assign severity level within that DRG based onsecondary diagnoses impacting the hospitalization andprocedures furnished during the stayStep 3. Identified secondary diagnosis: MCCe Severe protein-caloriemalnutrition (ICD-10-CM code E43)Final: Assigned to MS-DRG 368, Major Esophageal Disorder with MCCbased on principal and secondary diagnoses.aMS-DRG¼Medicare Severity Diagnosis-Related Group.bMDC¼major diagnostic categories.cDRG¼diagnosis-related group.dICD-10-CM¼International Classification of Disease, 10th edition, Clinical Modification.eMCC¼Major Complications/Comorbidities.Figure 2. Steps to determine Medicare Severity Diagnosis-Related Group assigned to the patient’s hospital stay.many studies examined only very specific groups of patients (ie, cerebrovascular accident4; elective surgery5;elective ear, nose, and throat surgery6;appendectomy within 24 hours ofadmission7; or intensive care unitpatients 65 years of age8). Other keydifferences specifically related to themalnutrition diagnosis were also noted.Many researchers described theirsubjects as malnourished; however, theonly methods used to determine nutrition status were nutrition screeningtools such as the Malnutrition ScreeningTool (MST) or Nutrition Risk Screening2002 (NRS-2002).4-6,9-12 These tools areintended to identify malnutrition risk,not actually diagnose malnutrition.Some studies did diagnose malnutritionusing assessment methods such as theSubjective Global Assessment; however,the nutrition assessment was notcompleted by an RDN (or the assessorwas not reported).7,13,14 Lastly, none ofthe identified studies used the Academyof Nutrition and Dietetics (Academy)and American Society for Parenteral andEnteral Nutrition (A.S.P.E.N.) proposedmalnutrition definitions published in2012.4-27To our knowledge, this is the firststudy examining the effect of malnutrition coding on expected geometricmean LOS in which the Academy andA.S.P.E.N. malnutrition criteria for adult--2018 Volume-Number-patients28 were used by RDNs to diagnose malnutrition. Furthermore, allpatients admitted to the hospital, notjust specific patient populations, werescreened and referred to the RDN for afull nutrition assessment if they werepositively identified as at nutrition risk.MALNUTRITION AND LENGTHOF STAY IN A COMMUNITYHOSPITALIn a community hospital with anaverage census of 185 and average LOSof 4.5 days, patients are screened by thenurse for nutritional risk within 24hours of admission, the results of whichare documented in the electronic healthrecord. An RDN consult is generatedautomatically if the patient triggerspositively as at nutrition risk, and theRDN assesses the patient within 24 to 48hours. The RDNs use criteria suggestedby the Academy and A.S.P.E.N.28 to diagnose malnutrition and recordmalnourished inpatients’ names andaccount numbers (inpatients underobservation status are excluded). Reports on all malnourished patients aregenerated monthly by the hospital’sfinancial analysts and include theadmissionanddischargedates,assigned MS-DRG, and CCs or MCCs andtheir associated ICD-10-CM codes.Between March 2015 and June 2017,the RDNs identified 1,817 malnourishedadult patients. Of these, 1,171 (64.4%)were not coded for malnutrition. Of thepatients not coded for malnutrition, theassigned MS-DRGs, including secondarydiagnoses coded as CCs and MCCs, wereassessed to see if a malnutrition codewould have made an impact on the MSDRG and, therefore, the RW and expected geometric mean LOS. If the RDNdiagnosed severe malnutrition, this wascorrelated with severe protein caloriemalnutrition (E43), an MCC; similarly,an RDN diagnosis of nonsevere malnutrition correlated with either moderateprotein-calorie malnutrition (E44.0),mildprotein-caloriemalnutrition(E44.1), or unspecified protein-caloriemalnutrition (E46), all CCs.If the patient was diagnosed withmalnutrition but not coded as such, theexpected geometric mean LOS wouldnot have increased appropriately dueto the missing MCC or CC.Of the 1,171 malnourished patientsthat were not coded for malnutrition,475 (40.6%) would have benefitted fromproper coding to change the MS-DRGand increase the RW and expectedgeometric mean LOS. The actual averageLOS for this group was 5.3 days, and theMedicare expected geometric mean LOSbased on the assigned MS-DRGs was 3.5days (see the Table).2 If the malnutritionhad been coded appropriately, the potential expected geometric mean LOSJOURNAL OF THE ACADEMY OF NUTRITION AND DIETETICS3
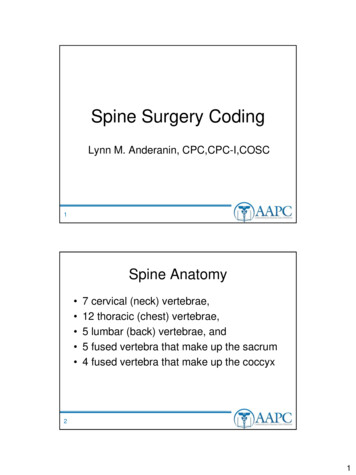
PRACTICE APPLICATIONSStep 1. Visit www.cms.gov and access the Acute Inpatient IPPSa page for the current fiscal year. Download Table 5, “List ofMS-DRGs,b Relative Weighting Factors, and Geometric and Arithmetic Mean Length of Stay.”2Steps Required for Each PatientCompleted Example Using 2017 DataStep 2. Using data provided by the hospital, identify the actualassigned MS-DRG for each malnourished patient.MS-DRG 293 Heart Failure & Shock without CCe/MCCfStep 3. Using Medicare’s Table 5 from step 1, determine theexpected gmLOSc for that MS-DRG.MS-DRG 293 Heart Failure & Shock without CC/MCC gmLOS: 2.6 daysStep 4. Using Table 5, determine what the MS-DRG would havebeen if the malnutrition diagnosis had been included.Same patient as in step 2, but coded with severe proteincalorie malnutrition, which is an MCC. New MS-DRG 291 Heart Failure & Shock with MCCStep 5. Using Table 5, determine what the expected gmLOS isfor the new MS-DRG from step 4.Same patient as in step 2, but coded with severe proteincalorie malnutrition, which is an MCC. New MS-DRG 291 Heart Failure & Shock with MCC New gmLOS: 4.6 daysStep 6. Determine the missed opportunity for expected LOS.dSubtract actual gmLOS (step 3) from new gmLOS (step 5) (ifmalnutrition had been coded)¼missed opportunity. 4.6 dayse2.6 days¼2 daysIn this example, the patient would have been expected to stay for 2 days longer based on the increased nursing care and otherresources required to treat the secondary diagnosis (severe protein-calorie malnutrition) in addition to the principal diagnosis(heart failure and shock). Because the patient likely would stay extra days due to an increased severity of illness, the hospitalneeds the increased reimbursement that would also accompany the higher MS-DRG.aIPPS¼Inpatient Prospective Payment System.bMS-DRG¼Medicare Severity diagnosis-related group.cgmLOS¼geometric mean length of stay.dLOS¼length of stay.eCC¼Complications/Comorbidities.fMCC¼Major Complications/Comorbidities.Figure 3. Steps to determine the missed opportunity for maximizing the expected geometric mean length of stay for a patient case.would have been 5.2 days. This correlates closely with the actual average LOSof 5.3 days. Comparison of the actualexpected geometric mean LOS (3.5days) and the potential expected geometric mean LOS (5.2 days) showed adifference of 1.7 days.These data have several implications.Consistent with previous reports,29-31malnourished patients are not beingproperly coded for malnutrition, whichnegatively affects MS-DRG assignmentand therefore reimbursement andcomparison benchmarks such as expected geometric mean LOS. Requiredcare for the malnourished patient inthis hospital, at least in terms of LOS, isconsistent with the expected norms, asTable. Comparison of actual LOSa to expected gmLOSb in malnourished patientsthat were not coded for malnutrition (n¼475)Difference betweenactual and potentialPotential expectedgmLOS if malnutrition gmLOS (“MissedActualActualOpportunity”)average LOS expected gmLOS had been coded5.3 days3.5 days5.2 daysaLOS¼length of stay.gmLOS¼geometric mean length of stay.b4JOURNAL OF THE ACADEMY OF NUTRITION AND DIETETICS1.7 daysthe potential expected geometric meanLOS was essentially the same as theactual average LOS.The hospital’s actual average LOS formalnourished patients is 5.3 days,which is longer than the expectedgeometric mean LOS of 3.5 days basedon the MS-DRGs assigned at discharge,indicating that there is an opportunityto improve the claims submitted toCMS to better reflect the acuity level ofpatients served and amount of careprovided. Accurately identifying andcoding for malnutrition is one way toimprove this process to ensure theproper MS-DRG is assigned to the patient case upon discharge.CONCLUSIONAccurate coding for malnutrition canimpact the assigned MS-DRG, appropriately bringing greater reimbursement for the hospital stay and--2018 Volume-Number-
PRACTICE APPLICATIONSestablishing appropriate comparisonbenchmarks such as expected geometric mean LOS. Accurate coding willalso inform CMS’s ongoing efforts torefine the MS-DRG system. Consistentuse of standardized criteria, such asthat published by the Academy andA.S.P.E.N., to determine the presence ofsevere and nonsevere malnutritionaids ongoing efforts to predict financialcosts and outcomes associated with theprevention and treatment of malnutrition. Future research should concentrate on efforts to determine whichinterventions, provided by whichhealth care providers at which point inthe care continuum, are the mosteffective in preventing or treatingmalnutrition.8.9.2.3.Centers for Medicare and Medicaid Services. Acute Care Hospital Inpatient ct¼/AcuteInpatientPPS/.Updated August 2, 2017. Accessed August12, 2017.Centers for Medicare and Medicaid Services.Acute Inpatient PPS. Details for Title: FY 2017Final Rule and Correction Notice bles.html. AccessedSeptember 1, 2017.Case Management Innovations. Length ofStay: What Is the Difference Between“Average” and “Geometric Mean”? ometric-mean/.Accessed September 1, 2017.4.Gomes F, Emery PW, Weekes CE. Risk ofmalnutrition is an independent predictorof mortality, length of stay, and hospitalization costs in stroke patients. J StrokeCerebrovasc Dis. 2016;25(4):799-806.5.Thomas MN, Kufeldt J, Kisser U, et al. Effects of malnutrition on complicationrates, length of hospital stay, and revenuein elective surgical patient in the G-DRGsystem. Nutrition. 2016;32(2):249-254.6.7.--Kisser U, Kufeldt J, Adderson-Kisser C,et al. Clinical impact of malnutrition oncomplication rate and length of stay inelective ENT patients: a prospectivecohort study. Eur Arch Otorhinolaryngol.2016;273:2231-2237.Huang TH, Chi CC, Liu CH, Chang CC,Kuo LM, Hsieh CC. Nutritional statusassessed by scored patient-generatedsubjective global assessment associatedwith length of hospital stay in adult patients receiving an appendectomy. Biomed J. 2014;37:71-77.2018 Volume-Number-20.Felder S, Lechtenboehmer C, Bally M, et al.Association of nutritional risk and adversemedical outcomes across different medical inpatient populations. Nutrition.2015;31:1385-1393.Jeejeebhoy K, Keller H, Gramlich L, et al.Nutritional assessment: Comparison ofclinical assessment and objective variables for the prediction of length of hospital stay and readmission. Am J Clin Nutr.2015;101:956-965.21.Agarwal E, Ferguson M, Banks M, et al.Malnutrition and poor food intake areassociated with prolonged hospital stay,frequent readmissions and greater inhospital mortality: Results from theNutrition Care Day Survey 2010. Clin Nutr.2013;32:737-745.Valente da Silva HG, Santos SO, Silva NO,Ribeiro FD, Josua LL, Moreira AS. Nutritional assessment associated with lengthof inpatients’ hospital stay. Nutr Hosp.2012;27(2):542-547.Guerra RS, Fonseca I, Pichel F, Restivo MT,Amaral TF. Usefulness of six diagnosticand screening measures for undernutrition in predicting length of hospital stay:A comparative analysis. J Acad Nutr Diet.2015;115:927-938.10.Kruizenga HM, Van Tulder MW, Seidell JC.Effectiveness and cost-effectiveness ofearly screening and treatment ofmalnourished patients. Am J Clin Nutr.2005;82:1082-1089.11.Kruizenga H, van Keeken S, Weijs P, et al.Undernutrition screening survey in 564,063 patients: patients with a positiveundernutrition screening score stay inhospital 1.4 d longer. Am J Clin Nutr.2016;103:1026-1032.12.References1.Sheean PM, Peterson SJ, Chen Y, Liu D,Lateef O, Braunschweig CA. Utilizingmultiple methods to classify malnutritionamong elderly patients admitted to themedical and surgical intensive care units(ICU). Clin Nutr. 2013;32(5):752-757.13.14.Van Venrooij LMW, Van Leeuwen PAM,Hopmans W, Borgmeijer-Hoelen MM, deVos R, De Mol BA. Accuracy of quick andeasy undernutrition screening tools—short nutritional assessment questionnaire, malnutrition universal screeningtool, and modified malnutrition universalscreening tool—in patient undergoingcardiac surgery. J Am Diet Assoc.2011;111:1924-1930.Allard JP, Keller H, Jeejeebhoy K, et al.Malnutrition at hospital admission—Contributors and effect on length of stay:a prospective cohort study from theCanadian Malnutrition Task Force. JPENJ Parenter Enteral Nutr. 2016;40(4):487497.Ordonez AM, Madalozzo Schieferdecker ME,Cestonaro T, Cardoso Neto J, LigockiCampos AC. Nutritional status influencesthe length of stay and clinical outcomesin hospitalized patient in internalmedicine wards. Nutr Hosp. 2013;28(4):1313-1320.15.Chima CS, Barco K, Dewitt ML, Maeda M,Teran JC, Mullen KD. Relationship ofnutritional status to length of stay, hospital costs, and discharge status of patients hospitalized in the medicineservice. J Am Diet Assoc. 1997;97:975-978.16.Kucukardali Y, Yazgan Y, Solmazgul E,Sahan B, Kaplan M, Yonem A. Malnutrition screening with the nutritional riskscreening 2002 in internal medicine service and the intensive care unit. Anatol JClin Investig. 2008;2(1):19-24.17.18.19.Sheean PM, Peterson SJ, Zhao W,Gurka DP, Braunschweig CA. Intensivemedical nutrition therapy: Methods toimprove nutrition provision in the criticalcare setting. J Acad Nutr Diet. 2012;112:1073-1079.Lim SL, Ong KC, Chan YH, Loke WC,Ferguson M, Daniels L. Malnutrition andits impact on cost of hospitalization,length of stay, readmission and 3-yearmortality. Clin Nutr. 2012;31(3):345-350.Merli M, Giusto M, Gentili F, et al. Nutritional status: Its influence on the outcomeof patients undergoing liver transplantation. Liver Int. 2010;30(2):208-214.22.23.24.Coltman A, Peterson S, Roehl K,Roosevelt H, Sowa D. Use of 3 tools toassess nutrition risk in the intensive careunit. JPEN J Parenter Enteral Nutr.2015;39(1):28-33.25.Fontes D, Generoso, S, Toulson DavissonCorreia, MI. Subjective global assessment:A reliable nutrition assessment tool topredict outcomes in critically ill patients.Clin Nutr. 2014;33(2):291-295.26.Tripathy S, Mishra JC. Assessing nutritionstatus in the critically ill elderly patient: Acomparison of two screening tools. IndianJ Crit Care Med. shko V, et al. Prognostic value ofnutritional screening tools for patientsscheduled for cardiac surgery. InteractCardiovasc Thorac Surg. 2013;16:612-618.28.White JV, Guenter P, Jensen G, et al.Consensus Statement of the Academyof Nutrition and Dietetics/AmericanSociety of Parenteral and EnteralNutrition:Characteristicsrecommended for the identification anddocumentation of adult malnutrition(undernutrition). J Acad Nutr Diet.2012;112(5):730-738.29.Suarez J, Phillips W, Willcutts K. Accuracyof malnutrition documentation in thehospitalized adult: A retrospective analysis. Presented at the Academy of Nutrition and Dietetics Food & NutritionConference & Expo, Boston, MA, October18, 2016.30.Phillips W, Whiddon C, Wehausen D.A step-by-step guide to implementing amalnutrition coding program for adultinpatients. Support Line. 2017;39:2-9.31.Phillips W, Doley J. Granting orderwriting privileges to registered dietitiannutritionists can decrease costs in acutecare hospitals. J Acad Nutr Diet. 2017;117:840-847.JOURNAL OF THE ACADEMY OF NUTRITION AND DIETETICS5
PRACTICE APPLICATIONSAUTHOR INFORMATIONAddress correspondence to: Jennifer Doley, MBA, RD, FAND. E-mail: jenniferdoley@iammorrison.comSTATEMENT OF POTENTIAL CONFLICT OF INTERESTNo potential conflict of interest was reported by the authors.FUNDING/SUPPORTThere was no funding support for this article.ACKNOWLEDGEMENTSAuthor Contributions: J. Doley collected data, reviewed literature regarding length of stay and malnutrition, and authored the first draft of theMalnutrition and Length of Stay sections; W. Phillips authored first draft of the other sections; J. Doley and W. Phillips reviewed and revisedsubsequent drafts.6JOURNAL OF THE ACADEMY OF NUTRITION AND DIETETICS--2018 Volume-Number-
Based Purchasing program,1 have resulted in a heightened focus on qual-ity of care. Hospital performance, measured by patient outcomes such as hospital acquired conditions and readmission rates, has affected reim-bursement rates since 2012 and is pub-licly reported.1 Good patient outcomes also have the benefit of reducing a hos-