Transcription
A THOMSON REUTERS FINANCIAL AND RISK WHITE PAPERGLOBAL 500 GREENHOUSE GASESPERFORMANCE 2010-20152016 REPORT ON TRENDSBY JOHN MOORHEAD (BSD CONSULTING) AND TIM NIXON (THOMSON REUTERS)JUNE 2016
A THOMSON REUTERS FINANCIAL AND RISK WHITE PAPERCONTENTSIntroduction. 2Analysis of Global 500 Greenhouse Gas Emissions. 3Global 500 Corporations with Greatest Change in Greenhouse Gas Footprint.4Largest decreases.4Largest increases.5Global 500 Top 20 Emitters.6Global 500 Revenue Growth Compared with GHG Emissions Growth. 7Conclusion.9Appendix 1: Companies ranked in order of size of GHG footprint (Scope 1 & 2). 10The authors would like to acknowledge the important contributions of Frank Schilder and Xin Shuai from Thomson Reuters Research & Development,Adam Baron from Thomson Reuters Content Analytics and Andre Chanavat from Thomson Reuters ESG. We would also like to thank the ResnickSustainability Institute at Caltech for its ongoing consultation and insight while preparing this report.INTRODUCTIONAre the 500 largest businesses in the world (Global 500) reducingtheir greenhouse gas (GHG) emissions at a rate that follows theglobal scientific consensus on the risks of climate change? As agroup, they were not in our prior reports1 covering performance from2010 through 2013, and they are not now, according to the mostrecent data, current to the beginning of 2016.2 However, the gap, orthe difference, between actual performance and IntergovernmentalPanel on Climate Change (IPCC) guidance is now improving slightly,offering some grounds for hope coming out of COP21.3decoupling that growth from GHG emissions and decreasing them ina manner consistent with warming less than 2 C. Finally, we will alsoprovide an update on the latest planetary trends to put the privatesector progress, or lack thereof, in a planetary frame of reference.It is important to note that the underlying data landscape forGHG emissions is complex and dynamic. By reporting on recentgreenhouse gas emissions trends using data reported by thecompanies themselves, this report seeks to catalyze engagement.We invite the business community and its stakeholders, be theycustomers, suppliers, employees, investors, local communities,governments or nongovernmental organizations (NGOs), to help findsolutions to climate change through dialogue and inquiry. Ratherthan conclusive rankings or grades, the trends uncovered hererepresent opportunities to begin more detailed discussions aroundwhy an individual company is performing the way it is. We stronglyencourage those inquiries.In addition to this updated gap analysis, this report will seek toengage with the Global 500 and their stakeholders by creating anew “sustainable growth view,” which will provide insight into howcompanies are performing with respect to growing their businesseswhile at the same time reducing their emissions. This approachadopts the operating assumption coming out of COP21 that theworld will and should continue to grow economically, but only by lobal 500 Greenhouse Gas Report: The Fossil Fuel Energy obal 500 Greenhouse Gases Performance 2010-2013: 2014 house-gases-performance-trends-2010-2013.pdfCarbon Pricing on the Horizon. From Volkswagen to Glencore to Shell: Carbon Risks Continueto Rise for the Global 500. ncy/costavoiding-carbon-pricing2 GHG data is reported by the companies themselves and is generally provided for a prioryear’s performance in an annual report. As such, the most current data available for some ofthe companies in this report is to the end of 2015, as reported in 2016 reports. As additionaldata is made available or estimates become possible, Thomson Reuters plans to continue toupdate this analysis.2 United Nations Climate Change Conferences are yearly conferences held in the frameworkof the United Nations Framework Convention on Climate Change (UNFCCC). They serve asthe formal meeting of the UNFCCC Parties (Conferences of the Parties, or COP) to assessprogress in dealing with climate change and to establish legally binding obligations fordeveloped countries to reduce their greenhouse gas emissions. https://en.wikipedia.org/wiki/United Nations Climate Change conference3
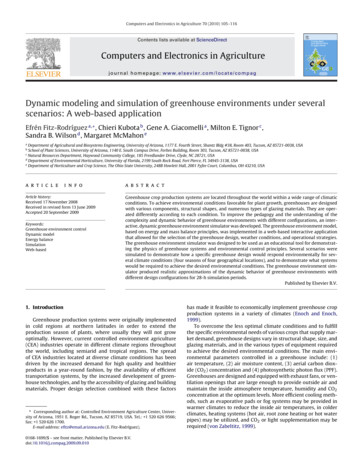
A THOMSON REUTERS FINANCIAL AND RISK WHITE PAPER“The world’s largest businesses’ aggregatedemissions increased when they should havedecreased, with a consequent ‘gap’ of 6.6%of emissions over the period from 2010 to2014.”ANALYSIS OF GLOBAL 500 GREENHOUSE GAS OBAL 500 GHG EMISSIONS20146.6% GAP100UNFor the Global 500 as a whole, greenhouse gas emissions increasedby 1% from 2010 to the beginning of 2015, which is the latest datefor which complete and comparable data is available.5 This differsfrom the 1.2 to 1.7% (median value 1.4%) average annual decreasebetween 2010 and 2050 required to have a likely chance of stayingwithin a 2 C average increase in global temperature, as was setout in the 2013 UNEP Emissions Gap Report.6 In other words, theworld’s largest businesses’ aggregated emissions increased whenthey should have decreased, with a consequent “gap” of 6.6% ofemissions over the period from 2010 to 2014 (see Figure 1).2014101.01101420The world’s 500 largest businesses collectively emitted over5 gigatons (10% of global emissions) of CO2e (carbon dioxideequivalents) through their operations and purchase of energy4 inthe latest reported and estimated data. These businesses representaround 28% of global GDP and therefore reflect more broadly onhow the broader economy is responding to the climate challenge.Figure 1. Global 500 GHG Emissions.4Scopes 1 & 2 aggregations with double counting included.5For this report’s gap analysis, most recent reported figures were taken with over 80%falling in the four-year period 2010-2014 with a distribution as follows: reported figuresFY2015 (52 companies), FY2014 (413 companies), FY2013 (32 companies), and FY2012 (1company) compared to results four years previous to that: FY2011 (52 companies), FY2010(413 companies), FY2009 (32 companies), and FY2008 (1 company). In other words, allcompanies’ performance is for a four-year port2013.pdf7We recommend consulting WRI’s Science Based Target Initiative for more detail oncompanies committing to such targets: argets-initiativeNote that as each year passes where emissions are not decreasing inline with science-based targets,7 we are increasing the rate at whichwe must eventually decline in order to stay within the 2 C scenario.One example scenario is represented by the sharply declining orangehashed line in Figure 1, corresponding to an approximate 3% requireddecline per year through 2050. This is a bit like saving for retirement.The longer you wait to start, the more severe the burden onceyou begin.3
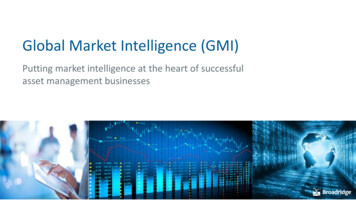
BUTHOMSONANAME REUTERS FINANCIAL AND RISK WHITE PAPERGLOBAL 500 CORPORATIONS WITH GREATEST CHANGE INGREENHOUSE GAS FOOTPRINTLargest decreasesThe emissions profile of the Global 500 varies significantly fromone business to the next. Twenty-six businesses with a greenhousegas footprint of over 10 million tons had emissions that decreasedby more than 8% for the same time period. They are listed below inFigure 2, going from largest to smallest decreases, in percentageterms (indexed to 100 baseline year, whereby 100 0% decrease,55 45% decrease, etc.). Again, it is important to use this list as astarting point for inquiry. What is driving the decrease? Divestiture?Innovation? Decline in business? On this last question, it can beinstructive to look at whether businesses on the list below are alsogrowing their top-line revenues over the same time period. Alsoinstructive is to review whether these businesses are among thelargest overall emitters, thereby obtaining a sense for the relativeimpact of the decrease. We explore the “sustainable growth view”and the top overall emitters in the last section of this report.Estimated totalScope 1 Scope 2emission in tonsFigure 2. Global 500 corporations with decreased emissions.2014 versus 2010Baseline 100CO2 estimatemethodCompany NameCountryGCIS SectorEstimated CO2 e MTIndexEstimation methodSSEUnited KingdomUtilities14,323,00055ReportedValero Energy CorporationUSAEnergy18,187,68457CO2Dominion Resources, RussiaEnergy144,871,00061ReportedIberdrola SASpainUtilities31,749,64969ReportedEni SpAItalyEnergy43,598,19074ReportedBPUnited KingdomEnergy55,200,00074ReportedNextEra Energy, Inc.USAUtilities39,559,89676ReportedE.ON SEGermanyUtilities101,800,00077ReportedRio TintoUnited KingdomMaterials34,400,00077ReportedCEZCzech ities64,300,00079ReportedLyondellBasell Industries Cl lMaterials15,900,00080ReportedExxon Mobil CorporationUSAEnergy122,000,00083ReportedChevron trials15,800,00084ReportedThe Southern CompanyUSAUtilities112,000,00085ReportedDuke Energy CorporationUSAUtilities137,555,00086ReportedBASF SEGermanyMaterials22,361,00087ReportedAnglo AmericanUnited KingdomMaterials17,440,00087ReportedAmerican Electric Power Company, Inc.USAUtilities122,700,00089ReportedLafarge S.A.FranceMaterials93,290,00089ReportedSasol LimitedSouth AfricaEnergy67,484,00090ReportedThe Dow Chemical ix businesses with a greenhousegas footprint of over 10 million tons hademissions that decreased by more than 8%for the same time period.”4
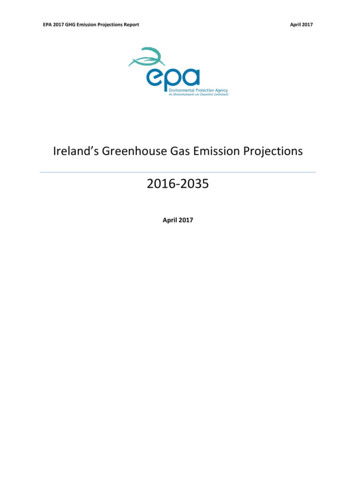
A THOMSON REUTERS FINANCIAL AND RISK WHITE PAPERLargest increasesConversely, of the Global 500 businesses with an annual greenhousegas footprint of over 10 million tons, 29 businesses showed increasesin greenhouse gas emissions of more than 8% over the most recentlyavailable four-year period. The largest increases in percent termsover this time period are listed below in Figure 3, ranked by largestpercentage increase from a baseline of 100 that represents noincrease. Note that the reasons for increase can vary from rapidlygrowing a carbon-intensive business to acquiring a new carbonbased business over this time period. Whatever the reason, eachcompany “owns” its own footprint and is responsible for managing itin line with global policy.Estimated totalScope 1 Scope 2emission in tonsFigure 3. Global 500 corporations with increased emissions.2014 versus 2010Baseline 100CO2 estimatemethodCompany NameCountryGCIS SectorEstimated CO2 e MTIndexCoal IndiaIndiaEnergy16,695,966980Estimation methodEnergyMMC Norilsk Nickel OSJCRussiaMaterials51,955,941480EnergyGlencore Xstrata plcSwitzerlandMaterials36,567,000326ReportedDevon Energy CorporationUSAEnergy13,970,234248CO2Exelon tRussiaEnergy73,700,000206ReportedCanadian Natural Resources LimitedCanadaEnergy32,207,000177ReportedLinde AGGermanyMaterials24,300,000158ReportedOil & Natural GasIndiaEnergy12,960,000157ReportedHusky Energy ergy34,182,568144ReportedNippon Steel & Sumitomo Metal air, Inc.USAMaterials20,245,000134ReportedPetróleo Brasileiro SA - PetrobrasBrazilEnergy80,800,000132ReportedReliance IndustriesIndiaEnergy26,858,749130ReportedCLP Holdings LimitedHong KongUtilities53,258,000127ReportedAir uth KoreaMaterials89,154,000124ReportedWilliams Companies, Inc.USAEnergy24,115,981124CO2Woodside PetroleumAustraliaEnergy10,014,854120ReportedE.I. du Pont de Nemours and CompanyUSAMaterials18,020,763117ReportedGDF SuezFranceUtilities131,154,736117ReportedAir Products & Chemicals, Inc.USAMaterials27,450,000116ReportedStatoil ASANorwayEnergy16,600,000115ReportedUnion Pacific CorporationUSAIndustrials12,666,733114ReportedSiam CementThailandMaterials24,760,000114ReportedChina eportedHolcim LtdSwitzerlandMaterials110,100,000108ReportedNTPC LtdIndiaUtilities201,036,494108Reported“Of the Global 500 businesses with anannual greenhouse gas footprint of over10 million tons, 29 businesses showedincreases in greenhouse gas emissionsof more than 8% over the most recentlyavailable four-year period.”5
A THOMSON REUTERS FINANCIAL AND RISK WHITE PAPERGLOBAL 500 TOP 20 EMITTERS8And finally, we arrive at the top 20 emitters in terms of most annualgreenhouse gases emitted into the atmosphere in the latest yearof the four-year period we examined (Figure 4). It should be kept inmind that these emission numbers include only direct and indirectemissions, and not scope 3 or supply/value chain emissions. Whenscope 3 emissions are included for many of the companies, emissionnumbers increase dramatically, to account, for example, for about30% of global emissions from only 32 global fossil fuel companies.9That said, it’s important to put these companies in their socialand economic context. Which important needs for energy arebeing served? Is this a story about providing energy to places thatpreviously have had no access to reliable electricity? How many liveshave been positively affected by energy availability? A key questionto ask of all these companies is whether they are providing theirservices while, at the same time, decreasing their greenhouse gasfootprints in line with IPCC guidance. If the answer is “yes,” then theyare “running sustainably” in what is a fair definition of the term. Thelist is important therefore, not as a final determination for climateculpability, but rather as the place where it makes the most sense tostart your inquiry on “sustainable growth.”Figure 4. Global 500 Top 20 emitters.Estimated totalScope 1 Scope 2emission in tons2014 versus 2010Baseline 100CO2 estimatemethodCompany NameCountryGCIS SectorEstimated CO2 e MTIndexEstimation methodPETROCHINA Company LimitedChinaEnergy325,974,176108MedianChina Petroleum & Chemical CorporationChinaEnergy268,527,476106MedianNTPC LtdIndiaUtilities201,036,494108ReportedArcelor MittalLuxembourgMaterials191,000,000103ReportedRWE gasRussiaEnergy144,871,00061ReportedDuke Energy CorporationUSAUtilities137,555,00086ReportedGDF SuezFranceUtilities131,154,736117ReportedAmerican Electric Power Company, Inc.USAUtilities122,700,00089ReportedGazprom OAORussiaEnergy122,200,00093ReportedExxon Mobil CorporationUSAEnergy122,000,00083ReportedENEL SpAItalyUtilities116,116,000100ReportedThe Southern CompanyUSAUtilities112,000,00085ReportedHolcim LtdSwitzerlandMaterials110,100,000108ReportedE.ON SEGermanyUtilities101,800,00077ReportedNippon Steel & Sumitomo Metal rge S.A.FranceMaterials93,290,00089ReportedPOSCOSouth KoreaMaterials89,154,000124ReportedRoyal Dutch eo Brasileiro SA - PetrobrasBrazilEnergy80,800,000132Reported8 ote that when a company has not reported its emissions, we use Thomson ReutersNpatented methodologies to estimate scope 1 and 2 using models that compare thenonreporting company with other similar companies; we strongly encourage all companiesto report their data, and will replace an estimated value with a company-submitted figurethat is qualitatively consistent with its peers.9h as-report-fossil-fuel-energy-sector.pdf6“A key question to ask of all these companiesis whether they are providing their serviceswhile, at the same time, decreasing theirgreenhouse gas footprints in line with IPCCguidance. If the answer is ‘yes,’ then theyare ‘running sustainably’ in what is a fairdefinition of the term.”
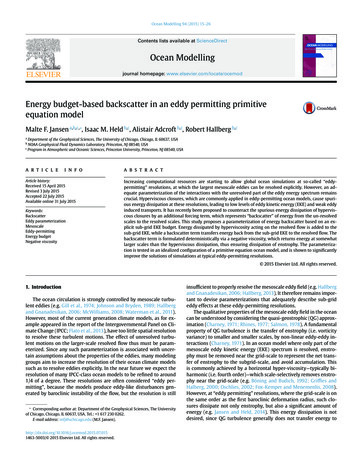
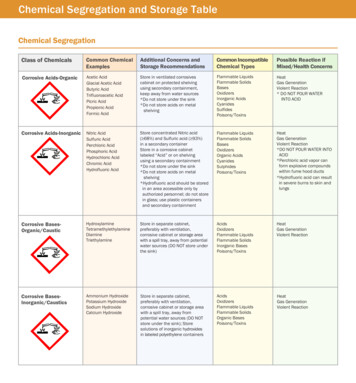
A THOMSON REUTERS FINANCIAL AND RISK WHITE PAPERGLOBAL 500 REVENUE GROWTH COMPARED WITH GHG EMISSIONS GROWTHIn this last section of our report, we arrive at two different views ofhow the Global 500 is performing in terms of reducing its greenhousegas footprint while running a business at the same time. The firstscatter graph (Figure 5) represents a plot of the largest 300 emittersof the Global 500. All of the dots to the left of the “GHG ReduceGuide Line” represent companies that have reduced emissions overthe four-year period examined in line with a 2 C decrease scenario(at least 1.4% per year). Additionally, all of the companies locatedabove the slanted green line represent companies in which revenuesare growing faster than emissions, suggesting decoupling of the two.Two observations from this plot include:1. As indicated by the blue-shaded oval, there are more companiesclustering slightly above the Sustainable Growth Borderlinethan below. In fact, Global 500 revenues as a whole grew by 5%compared with a growth rate in emissions of 1%, which suggestsdecoupling.102. The data sets (including from our previous report) suggest thatthe decline in emissions growth is relatively recent (in the last twoyears), and it will be important to observe how the data pointscontinue to migrate to the left as more years of data becomeavailable.Figure 5. GHG emissions change rates of the largest 300 emitters of the Global 500.1.0GHG Reduce Guide LineSales Change Rate0.50.0-0.5Sustainable Growth Borderline-1.010-1.0-0.50.00.51.0 Both Figure 5 and Figure 6 exclude those points that are outside of the range of [-1, 1] inboth x- and y-axis. Those points are considered “outliers;” the number of “outliers” is quitesmall compared to the whole data sets.7
A THOMSON REUTERS FINANCIAL AND RISK WHITE PAPERHowever, when we focus on the 100 companies with the largest GHGfootprints (see list in Appendix 1) represented by the size of the datapoint in Figure 6,11 the story is quite different. For this grouping, totalrevenues are decreasing by 7.5%, while total emissions are increasingby 1.1%. Similarly, a majority are also below the green SustainableGrowth Borderline, indicating emissions are growing faster thanrevenues (see Figure 6).There are many possible interpretations of this data. Is this partiallya reflection of the decline in fossil fuel prices (led by oil) andconsequent impact on revenues (for those producing fossil fuels)?Are these firms taking advantage of cheap energy to competewith each other at the expense of the environment? Are some ofthem demonstrating real leadership despite these factors? Do theyoperate in an intensive regulatory environment, or are they planningon growing their businesses in such an environment? Is importantinnovation happening in some of the companies that are movingmost quickly towards the upper left? Perhaps most significantly, inwhich direction are these individual firms moving?Figure 6. GHG emissions vs. revenue change rates for the 100 Global 500companies with the largest GHG footprints.1.0GHG Reduce Guide LineRevenue Change Rate0.50.0-0.5Sustainable Growth Borderline-1.0-1.0-0.50.0GHG Emissions Change Rate118#1 corresponds to the largest emitter, #2 second largest, etc., as listed in Appendix 1.0.51.0
A THOMSON REUTERS FINANCIAL AND RISK WHITE PAPERCONCLUSIONAll of the questions posed above are meant to be starting points forfurther inquiry. This data provides an additional catalyst for investors,regulators, consumers and stakeholders of all stripes to begin to askkey questions about the viability of a business going into a post-COP21world. Above all else, we suggest asking three questions:1. Are you operating your business, whatever it is, in a mannerconsistent with IPCC guidance on reducing emissions over time?2. If the answer is “yes,” then ask about the plan to keep doing so.Is it about technological innovation, divestment, business modeltransformation, etc.?3. If the answer is “no,” then ask if there is a plan to reconsider inlight of steadily increasing transparency around performance andstakeholder scrutiny for business as usual. The planet is changing(see planetary status snapshot at right), and what will be your rolein that change?STATE OF THE CLIMATE 2016CLIMATE CHANGE BY THE NUMBERSWarmer winters. Out-of-season blooms and new birds in yourbackyard. Live coverage of the latest extreme weather event onCNN. Yet another “warmest year on record” globally.There are many ways we observe and experience climate change.But climate change can seem like an abstract, hazy concept attimes. What does the latest climate science tell us about thecurrent state of earth’s climate by the numbers?400 ppm – global average atmospheric CO2 levels as of March 201522 to 44 cm IPCC projected sea level rise by 21002015 – warmest year on record globally since 18802014 – previous warmest year on record globally since 188015 of 16 warmest years on record globally have occurred since 20001 in 27 million odds that string of hottest years globally since 2000occurred naturally31 years – since the last cooler than average month globally inFebruary 198540 years – since the last cooler than average year globally in 1976 1C – global temperature rise as of 2015 vs. pre-industrial time 2C – 2015 Paris COP goal for limiting global temperature rise by 210094% of glaciers losing ice worldwide12% per decade – rate of Arctic Sea ice declineContributed by Minnesota Public Radio Chief Meteorologist Paul -focus-meteorologist-paul-huttner9
A THOMSON REUTERS FINANCIAL AND RISK WHITE PAPERLike the transition to a less carbon-intensive economy, this type ofreporting is a work in progress. We will continue to provide updatedguidance using this type of methodology, which will only improve asmore data becomes available and additional views become possible.In the meantime, we invite your engagement. Begin your inquiry,keeping in mind that many of these companies have and can continueto play a crucial role in our collective prosperity as long as theydemonstrate how they contribute to an ever lower carbon economy.Appendix 1. Companies ranked in order of size of GHG footprint (Scope 1 & 2).101 PETROCHINA Company Limited26CLP Holdings Limited52Praxair, Inc.772 China Petroleum & ChemicalCorporation27MMC Norilsk Nickel OSJC53LyondellBasell Industries Cl A28Total54Suncor Energy Inc.78 Freeport-McMoRan Copper &Gold Inc.29BHP Billiton55Valero Energy Corporation30Eni SpA31Endesa56 E.I. du Pont de Nemours andCompany32NextEra Energy, Inc.57 Occidental PetroleumCorporation33Glencore Xstrata plc58Anglo AmericanCoal India3NTPC Ltd4Arcelor Mittal5RWE AG6Surgutneftegas7Duke Energy Corporation8GDF Suez34The Dow Chemical Company9 American Electric PowerCompany, Inc.5935Rio Tinto60 Statoil ASA10Gazprom OAO36PTT61Vale11Exxon Mobil Corporation37Dominion Resources, Inc.62Saint-Gobain12ENEL SpA38 Canadian Natural ResourcesLimited63Repsol13The Southern Company64FedEx Corporation14Holcim Ltd65SSE15E.ON SE39Iberdrola SA40 CEZ41ConocoPhillips66 Devon Energy Corporation16 Nippon Steel & Sumitomo MetalCorporation4217Lafarge S.A.4318POSCO44Siam Cement19Royal Dutch Shell45Linde AG20 Petróleo Brasileiro SA – Petrobras46Williams Companies, Inc.21Rosneft47Exelon Corporation22Sasol Limited58Air Liquide23EDF4924Chevron Corporation50 Wal-Mart Stores, Inc.75Carnival Corporation25BP5176Woodside PetroleumAir Products & Chemicals, Inc.Reliance IndustriesBASF SEGas Natural SDG SA79Spectra Energy CorpSamsung Electronics80 AT&T Inc.81Volkswagen AG82Halliburton Company83Bayer AG84Apache Corporation85LG Chem86General Motors Company87Astra International88BG Group89Toyota Motor Corporation90 Nestlé91Ecopetrol Sa92Honeywell International Inc.93Grupo Mexico S.A.B. de CV67Husky Energy Inc.68China Mobile69Oil & Natural Gas94 Anadarko PetroleumCorporation70UPS95National Grid71Union Pacific Corporation96Cenovus Energy Inc.72TransCanada Corporation973M Company73Imperial Oil98Formosa Petrochemical99EOG Resources, Inc.74 Potash Corporation ofSaskatchewan Inc.100 Taiwan SemiconductorManufacturing
BUTHOMSONANAME REUTERS FINANCIAL AND RISK WHITE PAPERABOUT THOMSON REUTERSThomson Reuters is the world’s leading source of intelligent information for businesses and professionals. We combine industryexpertise with innovative technology to deliver critical information to leading decision makers in the financial and risk, legal,tax and accounting, intellectual property and science and media markets, powered by the world’s most trusted newsorganization. Thomson Reuters shares are listed on the Toronto and New York Stock Exchanges (symbol: TRI). For moreinformation, go to thomsonreuters.com.ABOUT BSD CONSULTINGBSD is a global sustainability consultancy that provides thought leadership and customizedsolutions for the management of sustainability issues to international business andgovernmental organizations. bsdconsulting.comAUTHORSJohn MoorheadBSD ConsultingJohn Moorhead heads the ClimateChange practice at BSD Consultingand is responsible for French-speakingSwitzerland. The BSD Climate Changepractice has three areas of focus: Carbon Pricing, Innovationand Responsible Investment. John advises private and publicsector organizations on strategy and sustainable managementwith a particular focus on (climate) change management,business modelling, performance excellence and reporting.He also coaches managers on how to use sustainabilityreporting standards such as GRI and IIRC for managementpurposes such as sustainability strategy definition, rethinkingthe business model, managing change and improvingsustainability performance. John is coauthor of the BSD/Thomson Reuters Global 500 Greenhouse Gas PerformanceManagement series.A biologist by training, he has more than 28 years ofinternational management, training and consultingexperience in business and sustainability strategy andperformance management.j.moorhead@bsdconsulting.com 2016 Thomson Reuters S035283/6-16Tim NixonManaging Editor, SustainabilityThomson ReutersTim Nixon is a founder and the managingeditor Sustainability (sustainability.thomsonreuters.com). He is also directorof sustainability at Thomson Reuters, and has ongoingengagement with thought leaders across a wide spectrumof NGO and private sector partners. He has spoken at globalpolicymaking events, including the World Bank Land &Poverty Conference, UN PRI Annual Meeting and the firstglobal meeting of UNEA (United Nations EnvironmentAssembly). He is a frequent writer for the Sustainability blogand Thomson Reuters Answers On, and coauthor of a reporton the Global 500 greenhouse gas emission trends.Tim is a lawyer by training and has spent most of his careerworking with diverse collaborators to build ters.com
2014 6.6% GAP AL 500 GHG EMISSIONS 050 050 0 2010 2014 2020 2030 2040 2050 45 100 110 Figure 1. Global 500 GHG Emissions. 4 Scopes 1 & 2 aggregations with double counting included. 5 For this report's gap analysis, most recent reported figures were taken with over 80% falling in the four-year period 2010-2014 with a distribution as follows .