Transcription
The Saudi Insurance Market Report2020The General Department of Insurance Control
Table of ContentoHighlights of the Saudi Insurance Sector-20205oMajor Developments in 20206oInsurance Market Performance - Overallo Gross Written Premiums9 Insurance Penetration10 Insurance Density11 Gross Written Premiums by Line of Business12 Net Written Premiums by Line of Business14 Gross Written Premiums by Client Segment16 Gross Written Premiums by Geographic Regions17 Gross Written Premiums by Distribution Channel18 Retention Ratio by Line of Business19 Gross Claims Paid by Line of Business20 General and Health Net Earned Premiums vs. Net Claims Incurred21 Market Profitability22 Balance Sheet - Policyholders’ Assets23 Balance Sheet - Shareholders’ Assets24 Balance Sheet - Policyholders’ Liabilities and Equity25 Balance Sheet - Shareholders’ Liabilities and Equity26Insurance Market Performance - By Line of Business Health Insurance28 Protection and Savings Insurance29
Table of Contentoo Motor Insurance30 Property/ Fire Insurance31 Engineering Insurance32 A&L and Other Insurance33 Marine Insurance34 Energy Insurance35 Aviation Insurance36Other Market Indicators Gross Commissions Incurred by Line of Business38 Employees of Insurance Companies by Nationality39 Employees of Insurance intermediaries by Nationality40 Insurance Market Structure41 Capitalization of Insurance Companies42Appendix: Data Tables Table 1: Gross Written Premiums by Line of Business44 Tables 2 & 3: Insurance Penetration and Density45 Table 4: Net Written Premiums by Line of Business46 Table 5: Gross Written Premiums by Distribution Channel47 Table 6: Gross Written Premiums by Client Segments48 Table 7: Retention Ratio by Line of Business49 Table 8: Gross Commissions Incurred by Line of Business50 Table 9: Gross Claims Paid by Line of Business51
Insurance Sector Highlights - 2020
Highlights of the Saudi Insurance Sector The insurance sector witnessed a premium growth of 2.3% in 2020*, with total written premiums reaching SR 38.78 Billion. Energy and Accident &Liability insurance classes witnessed notable increase in written premiums. The gross written premium through online aggregator reached SR 2.3 Billion in 2020 compared to SR 1.3 Billion in 2019. The penetration ratio of the sector increased from 1.28% in 2019 to 1.48% in 2020. The overall loss ratio decreased from 81.9% in 2019 to reach 77.5% in 2020 due to the improvements in the loss ratio of Health and Motorinsurance classes. The net profit (after zakat & tax) for the sector increased by 61.6% over the last year’s corresponding figure, reaching 1.38 Billion in 2020,improving in turn the return-on-assets and return-on-equity ratios. The overall Saudization ratio increased from 74% in 2019 to 75% in 2020. In 2020, the sector witnessed materialization of the first merger, which was between Walaa and Metlife-AIG-ANB Cooperative Insurance Company,followed by the merger between Gulf Union and Alahlia Cooperative insurance company, also in 2020. This reflects the Central Bank’s effort tosupport the sector in consolidation and acquisition in order to achieve the objectives of Saudi Vision 2030. This is also expected to strengthen thefinancial position of insurance companies enabling them to better protect the rights of policyholders, enhance customer services, manage thecosts, enhance efficiency, provide diverse insurance products, and attract talented resources. Additionally, the year 2020 witnessed signing of a binding merger agreement between Aljazira Takaful and Solidarity**. This was followed by amemorandum of understanding (MoU) between Enaya and Amanah insurance companies for their potential merger.(*) This report is based on the sector data collected from 30 insurance and reinsurance companies.(**) the merger materialized in February 20215/51
Major Regulatory Developments in 2020 The Central Bank conducted a number of supervisory visits and inspections as part of its risk-based supervision framework. Atotal of 261 supervisory visits and inspections were carried out during 2020 covering the insurance sector. In line with the CentralBank’s aim to measure the overall performance of the sector, the Market Conduct program for insurance intermediary wasintroduced during 2020 in order to prevent and control market misconduct activities, including unlicensed activities. In 2020, SAMA continued to refine the existing regulations and also introduced new regulations in order to respond to theevolving business environment in a timely manner. The highlighted regulations are as follows: –Rules governing the activities of Insurance Aggregators, which are expected to streamline the operations and facilitate easy access to affordable insurance cover forthe masses–New rules for Insurance Products Approval by SAMA were issued, aimed at making the approval process more efficient as well as strengthing the internal reviewprocess at insurance companies–Bancassurance activities with the objective of increasing awareness and reach of insurance savings products–Actuarial Work Rules, which are expected to significantly strengthen the role of actuarial expertise in the sector and increase the level of technical sophistication inthe sector, ultimately increasing the reliability of results produced by insurance companies.–Issuance of at least 44 circulars on a range of subjectsSAMA also proactively facilitated introduction of a number of new insurance products in line with its mandate to promote and develop theinsurance industry, some of which are: drone risk insurance, insurance against cancellation of live-events, and unified policy for Inherent DefectsInsurance aimed at protecting policy holders and beneficiaries in the construction and housing sector.6/51
Major Developments in 2020 The sector successfully completed Phase 2 of the IFRS17 implementation-journey, and moved on to Phase 3 of the four-phaseimplementation road map issued by the Central Bank (Phase 3 is due for completion in April 2021). SAMA encouraged insurance companies to adopt the latest technology in their operations and services provided to customers,which was reflected in the digitization of a large number of procedures in the insurance sector. These ranges from right at thestart of the sales process until the final claim settlement, in addition to handling of accidents, in order to improve quality ofservice and hence increase customer satisfaction. The success of this was clearly demonstrated during the lock-down perioddue to COVID-19. The Saudi Central Bank valued the initiatives taken by the insurance sector during the COVID19 pandemic. In the motor sector,insurance companies extended all in force policies for individuals for two months free of charge. In the health sector, with theobjective of providing easy and risk-free access to health services, insurance companies introduced telemedicine services forconsultation with physicians as well as started a service to deliver medicines to beneficiaries at their homes. The Central Bankalso highly appreciates the donation of 68 million riyals made by the insurance sector to a government fund created to dealwith the adverse impact of COVID19.7/51
Insurance Market Performance
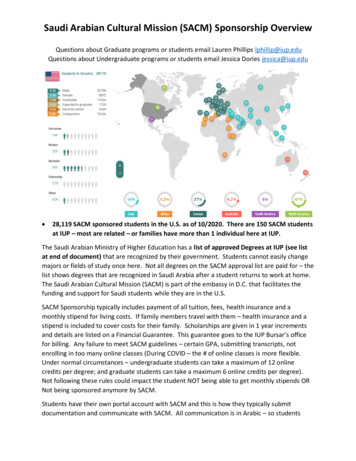
Gross Written PremiumsSR Million In 2020, the total Gross Written Premiums grewby 2.3 percent, reaching SR 38.78 Billioncompared to SR 37.89 Billion in 2019.Gross Written 9,883.4ProtectionInsuranceHealthInsurance Health insurance remained the largest line ofbusiness in 2020, growing at 1.6%. Itscontribution to total GWP in 2020 8.320162017201820192020 General insurance’s contribution to total GWPslightly increased from 37.7% in 2019 to 37.9%in 2020. Protection and Savings insurance, representingthe smallest line of business, slightly increasedin 2020 attaining 3.3% share in total 0Growth2019-2020Line of BusinessSR M% of TotalSR M% of TotalSR M% of TotalSR M% of TotalHealth ,474.959.3%22,836.8 58.9%1.6%General ,280.737.7%14,678.3 37.9%2.8%Protection Insurance 38,778.7100%2.3%Total36,855.3SR M% ofTotal9/51
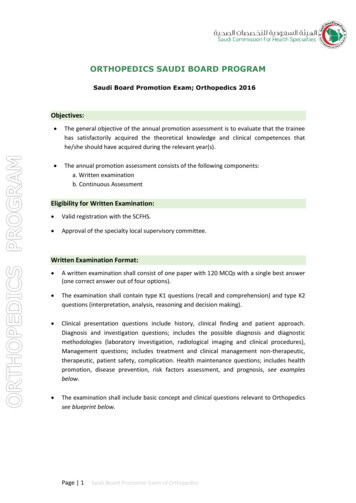
Insurance PenetrationInsurance Penetration of Total GDP (1)-0.13%1.54%0.04% The insurance penetration (ratio of insurance premium toGDP) increased from 1.28 percent in 2019 to 1.48 percent in2020 due to the increase in premiums. Over the course of 5 years, compound annual growth ratefor insurance penetration has been l .76%0.48%0.48%0.56%201820192020Health Insurance The penetration of insurance to non-oil GDP increasedmarginally from 1.87 percent in 2019 to 1.92 percent in 2020.Protection InsuranceInsurance Penetration of Non-Oil GDP .70%0.73%20162017201820192020General Insurance(1) Total GDP of SR 2,398, SR2,570, SR 2.934, SR 2,973 and 2,625 Billion in 2016, 2017, 2018, 2019 and 2020 respectively, General Authority for Statistics(2) Non-oil GDP SR 1,791 SR 1,835, SR 1.928, SR 2,026, and 2,017 Billion in 2016, 2017, 2018,2019 and 2020 respectively, General Authority for StatisticsHealth InsuranceProtection Insurance10/51
Insurance Density (1)Insurance Density-1.28%1,159 Insurance density is defined as Gross WrittenPremiums per Capita. Despite the increase in GWP In 2020,Insurance density decreased by 1.1% toreach SR 1,095, from SR 1,107 per Capita in2019, due to the increase in 595.07540.2620161.09533.17501.582017General InsuranceHealth InsuranceProtection Insurance(1) Saudi population of 30.77, 31.78, 32.5, 33.4,34.2 and 35.42 Million in 2016, 2017,2018, 2019, and 2020 respectively, General Authority for Statistics11/51
Gross Written Premiums by Line of Business (1 of 2) Motor and Health insurance represent 80.4% oftotal GWP in 2020. Health insurance including the compulsory and noncompulsory remained the largest line of business in2020, accounting for 58.9% of total GWP, andexperiencing 1.6% premium growth during 2020. Motor insurance stood in the second place with a21.6% share of total GWP. Its’ gross writtenpremiums decreased by 2.9% in 2020.2016Line of BusinessSR M2017% ofTotalSR M2018% ofTotalSR M2019% ofTotalSR M2020% ofTotalSR M% 1.8%5.6%Property / 109.25.4%14.3%A&L and %1,134.93.0%1,263.63.3%11.3%Motor12,158.433.0% 2.9)%Health18,630.350.5% 19,035.552.1% 19,883.456.8% 22,474.959.3% 2.3%36,503.235,014.537,890.538,778.712/51
Gross Written Premiums by Line of Business (2 of 2)40,000,00035,000,00030,000,000SR 23.3Other 92020Health5,000,000013/51
Net Written Premiums by Line of Business (1 of 2) Net Written Premiums (NWP) is defined asthe premiums retained by the insurancecompany, after the subtraction of thepremiums ceded to local or internationalreinsurers from Total GWP Total NWP increased by 1% from SR 31.68Billion in 2019 to SR 31.99 Billion in 2020. General Insurance (excluding Motor) shareof total NWP increased slightly from 3.6% in2019 to 4.5% in 2020. Health insurance accounted for 68.5% oftotal NWP in 2020, whereas Motorinsurance share was 24.3% of total NWP in20202016Line of BusinessSR M2017% ofTotal2018SR M% ofTotal2019SR M% ofTotal2020SR M% ofTotalSR M% roperty / 5.3%A&L and otor10,720.434.8% 10,388.233.7%Health18,095.058.7% 18,411.659.7% 19,319.464.3% 21,622.068.3% 21,924.768.5%1.4%Total30,847.5100% 30,838.7100% 30,043.4100% 31,679.7100% 31,986.3100%1.0%14/51
Net Written Premiums by Line of Business (2 of 2)29,000,00030,84730,8391,211.4820.61,192.7846.2SR 9861,143.5797.21,438.6859.48,117.17,763.5Other 20Health5,000,00015/51
Gross Written Premiums by Client SegmentGWP by Client Segment Retail insurance GWP totaled SR 5.67 Billion, representing14.6% share of total market GWP in 2020. Under motorinsurance, individual policyholders represent 51.8% shareof total motor premium. Micro enterprises, small enterprises, and mediumenterprises insurance represents 3.5%, 5.9%, and 12.2%share of total market GWP respectively. Large Enterprises’ insurance represents 63.7% of totalmarket GWP. Under health insurance, large enterprises’premium totaled SR 16.26 Billion, representing 71.2% oftotal health insurance GWP.63.75%% of Total GWP65.27%2019202012.64%14.61%12.32% 12.18%6.25%3.53%Retail3.53%Micro Enterprises5.93%Small Enterprises Medium EnterprisesCorporate16/51
Gross Written Premiums by Geographic RegionsGWP by Geographic Regions60% Central region remained the highest in GWP reaching a50% share of total GWP in 2020 Eastern region’s share of total GWP decreased from 20%in 2019 to reach 16% in 2020.50%40%% of Total GWP Western region stood in second place with a 31% shareof total GWP in 2020 compared to 26% in 2019WestrenCentral202017/51
GWP by Distribution ChannelGWP By Distribution Channel70% Sales through brokers increased from 34.2% in 2019 to reach35.2% in 2020.57.4%57.9%50%% of Total GWP Direct sales remained the largest distribution channel in2020. Its contribution to total GWP in 2020 reached 57.9%compared to 57.4% in 2019.60%40%34.2%35.1%30%20%8.4%10%7.0%0%Direct SalesAgent2019Broker202018/51
Retention Ratio by Line of Business forGeneral and Health Insurance The retention ratio measures the written premiums retained bythe insurance company after excluding the reinsurers’ share,which is considered a measure of the net risk carried by theinsurer. Retention ratio is calculated by dividing the NWP by theGWP. The overall retention ratio decreased from 84% in 2019 to 83% in2020 The retention for health and motor insurance classes remainedhigh, at 96% and 93% respectively For other general insurance classes in aggregate, the retentionratio reached 23% in 2020 compared to 20% in 2019Notes: All licensed companies are required to adhere to a minimumretention ratio of 30% of its total insurance premiums (as perArticle 40 of the Implementing Regulations) Retention ratios are not shown for Protection & Savings insuranceas the savings element of the contract must be retained by thecompany. Therefore retentions for Protection & Savings insuranceare not directly comparable with other insurance lines of businessWeighted average excludingMotor and Health insuranceWeighted average including alllines of ngineering2018201918%17%17%Property / Fire202029%28%26%Marine47%43%47%A&L and 0%19/51
Gross Claims Paid by Line of 6,507.05,478.68,314.1Other GeneralSR Million Total gross claims paid decreased from SR 28.45Billion in 2019 to SR 26.91 Billion in 2020, whichrepresents a decrease of 5.4% In 2020, Health gross claims paid increased by 0.7%whereas Motor gross claims paid decreased by15.8% over 2019 Table 9 in the appendix contains all the gross claimspaid data by line of business from 2016 to rOther GeneralP&S0.7%(15.8)%(25)%13%% Growth20/51
General and Health Net Earned Premiums vs. Net Claims IncurredNet Earned Premiums Vs. Net Claims Incurred Net Earned Premiums (NEP) is equal to NWP minus thechange in net unearned premium reserveThe insurance market’s General and Health NEP totaled SR30.84 Billion in 2020, compared to SR 30.25 Billion in2019, an increase of 1.9%General and Health Net Claims Incurred (NCI), is equal tothe total of net claims paid plus the change in outstandingand IBNR claims reserveIn 2020 General and Health net claims incurred decreasedby (4.6%) to reach SR 23.64 BillionIn 2020 General and Health net Loss ratio decreased andreached 76.7% from 81.9% in 201935,00083%30,20230,00025,00082.3% Loss Ratio 2019202021/51
Market Profitability Insurance Market Profitability1,9161,848Underwriting result is equal to insurance revenues including insuranceinvestment income minus related insurance expenses.1,386 Shareholders Operations Results include the share of shareholders fromunderwriting result and the shareholder investment income minus othersG&A expense. The net result is equal to the sum of revenues minus the sum of expensesand Zakat & Tax. In 2020, the underwriting result increased by 94.1% to reach SR 1,848million, compared to 952 million in 2019. Shareholders operations’ results increased to SR 1,916 million in2020,reprensting a 50.3% growth compared to SR 1,274 million in 2019. The insurance market’s net result increased by 61.6% to 1,386 million in2020, compared to SR 858 million in 2019. Return on Assets (ROA) is the ratio of net result to total assets. In 2020,insurance market’s ROA was 2.05%1,2742019952858Underwriting ResultIncome fromShareholders OperationsNet ResultInsurance Market ROA/ROE7.52%5.27%20192.05% Return on Equity (ROE) is the ratio of net result to total equity. In 2020,insurance market’s ROE was 7.52%202020201.34%ROAROE22/51
Balance Sheet - Policyholders’ Assets Total Policyholders’ assets amounted to SR46.33 Billion in 2020 compared to SR 44.59Billion in 2019 Investments accounted for the largest shareof policyholders’ assets, with a value of SR17.46 Billion in 2020 compared to SR 16.21Billion in 2019 At the end of 2020 insurance companies heldSR 4.88 Billion in cash and cash equivalents intheir policyholders’ accounts compared to SR5.48 Billion in 2019Protection andSavings Insurance201920199,662,429Deferred policy acquisition cost775,122845,3354,2124,878779,334850,213Prepaid expensesInvestmentsDeposits at 02344,586,42746,327,491Cash and cash equivalentsReceivables, netReinsurance recoverablesLoansDebt securities and fixedincomeShares (common, preferred)Real estateOtherTangible assetsIntangible assetsOther policyholders ,290423,1202020210,869322,373521,191Total t in subsidiaries &affiliates* Other investments consists mainly of investments in funds related to saving productsGeneral and 9,221,97523/51
Balance Sheet - Shareholders’ AssetsAmount In 91815,510,237Deposits at financial institutionsLoans8,839,169-7,516,955-Debt securities and fixed income3,757,1824,037,497Shares (common, 951,827,1292,151,869Tangible assets265,681375,555Accrued interest, rent, income101,116135,251Intangible assets953,1661,121,397Distributions due from policyholders account540,716991,871Other shareholders assets(168,670)311,995Total Shareholders Assets19,338,89621,315,029Total Assets63,925,32367,642,521Cash and cash equivalents Shareholders’ assets amounted to SR 21.32 Billion in2020 compared to SR 19.34 Billion in 2019 Investments accounted for the largest share ofshareholders’ assets, with a value of SR 15.51 Billion in2020 compared to SR 15.9 Billion in 2019 At the end of 2020, insurance companies’ shareholdersheld SR 2.87 Billion in cash and cash equivalentscompared to SR 1.7 Billion in 2019 Insurance companies’ total assets amounted to SR 67.64Billion in 2020 compared to SR 63.93 Billion in 2019Receivables, netInvestmentsReal estateInvestment in subsidiaries & affiliatesOther24/51
Balance Sheet - Policyholders’ Liabilities and EquityAmount In ThousandsGeneral and Health InsurancePolicy At the end of 2020, insurance companies held SR 32.41Billion in technical reserves, which consist of unearnedpremiums, outstanding claims, IBNR and adjustmentexpense reserves, compared to SR 33.1 Billion in 2019 Mathematical reserves amounted to SR 3.37 Billion in2020 compared to SR 3.19 Billion in 2019 Total policyholders’ liabilities and allocated surplusamounted to SR 46.33 Billion in 2020 compared to SR44.59 Billion in 2019Protection and SavingsInsuranceTotal ders 24,524Reinsurance balances 5,367Technical 4032,407,202Unearned 816,643,981Outstanding claims, IBNRand adjustment tal Policyholders liabilitiesMathematical reservesOther arned reinsurance Accrued expense and deferred incomeDeclared dividend payable--Distribution due to shareholders er policyholders 1,211Accumulated al Policyholders liabilities and ,42746,327,48925/51
Balance Sheet - Shareholders’ Liabilities and EquityAmount In Thousands At the end of 2020, shareholders’ liabilities decreased toSR 2.88 Billion from SR 3.07 Billion in 2019 whileshareholders’ equity increased to SR 18.44 Billion in 2020compared to SR 16.27 Billion in 2019 Share capital increased to SR 12.49 Billion in 2020compared to SR 12.4 Billion in 2019 Shareholders’ liabilities and equity increased to SR 21.32Billion in 2020 compared to SR 19.34 Billion in 2019Policy20192020Total Shareholders liability3,065,3292,876,783Shareholders ed expenses and deferred income182,829189,100Other shareholders liabilities1,495,0801,202,127Total Shareholders equity16,273,56718,438,246Share capital12,402,66712,488,539Statutory reserves2,544,8072,726,161Retained earnings1,109,5392,599,571Other shareholders equity216,554623,975Total Shareholders Liabilities & Equity19,338,89621,315,029Total Liabilities & Equity63,925,32367,642,51926/51
Insurance Market Performance ByLine of Business
Health Insurance1.6%22,475 22,83720,89921,789(1.9%)18,345 17,99120192020GWPNWPNEPNCIHealth% of Total- Loss Ratio is defined as the percentage of net claim incurred over the net earned premium21,622 21,925Million SR Health insurance, which includes both compulsory and noncompulsory lines, accounted for 58.9% of the 2020 totalmarket gross written premiums (GWP) with SR 22.84 Billionin underwritten premiums Health insurance accounted for 68.3% of the market’s netwritten premiums (NWP) as insurance companies retainedSR 21.92 Billion of their Health insurance GWP, which wasthe highest of all business lines representing a 96%retention ratio Health insurance’s net earned premiums (NEP) registered SR21.79 Billion, representing 68.8% of the insurance market’sNEP. Health insurance’s net claims incurred (NCI) amounted to SR17.99 Billion, and resulted in a loss ratio of n 4.1%Loss Ratio87.8%82.6%28/51
11.3%Protection and Savings .9640.0Million SR Protection and Savings insurance’s GWP totaled SR 1.26 Billion in2020, which represents a 3.3% contribution to the market’s totalbusiness volume. Protection and Savings insurance accounted for 2.7% of the market’sNWP, as insurance companies retained SR 859.4 Million of GWP. Protection and Savings insurance’s NEP registered SR 854.6 Million,which represents a share of 2.7% of total NEP. Protection and Savings insurance accounted for 2.7% of totalmarket’s NCI in 2020 and amounted to SR 640 Million.20.5%531.3GWPNWPNEP20192020NCIP&S% of .7%2.6%Retention ratio and loss ratio are not shown due to the savings part of thepremium which distorts the ratios29/51
Motor 763.58,211.17,761.9(13.8%)5,999.85,171.5Million SR Motor insurance’s GWP totaled SR 8.36 Billion in 2020, whichrepresents a 21.6% share of total market GWP Insurance companies retained 92.9% of their Motorunderwritten premiums Motor insurance NWP totaled SR 7.76Billion Motor insurance’s NEP amounted to SR 7.76 Billion andaccounted for 24.5% of the insurance market’s NEP Insurance companies recorded SR 5.17 Billion in Motorinsurance’s NCI and resulted in a loss ratio of 66.6%20192020GWPNWPNEPNCIMotor% of Total20192020GWP22.7%21.6%20192020Retention 1.3%Loss Ratio73.1%66.6%30/51
Property/ Fire Insurance14.3%2,109.2 Property/ Fire insurance’s GWP totaled SR 2.1 Billion in2020, which represents a 5.4% share of total market GWP Insurance companies retained 17.2% of their Property/ Fireinsurance premiums, as the business line’s NWP amountedto SR 362.7 Million. Property/ Fire insurance contributed1.1% to total market NWP in 2020Million SR1,844.62019202015.3%1.9%314.6 362.7316.7 322.836.3%118.1 161.1 Property/ Fire insurance’s NEP amounted SR 322.8 MillionGWP Insurance companies recorded SR 161.1 Million inProperty/ Fire insurance’s NCI, and resulted in a loss ratioof 49.8%NWPNEPNCIProperty / Fire% of Total20192020GWP4.9%5.4%20192020Retention ss Ratio37.3%49.9%31/51
Engineering Insurance(11.4%)1,198.4 Engineering insurance’s GWP totaled SR 1.06 Billion in2020, which represent a 2.7% contribution to totalmarket GWP Insurance companies retained 22.3% of theirEngineering underwritten premiums. Engineeringinsurance NWP amounted SR 236.5 MillionMillion .1%)59.3 Engineering insurance NEP amounted to SR 181.1Million and accounted for 0.6% of the insurancemarket’s NEPGWPNWPNEP39.1NCIEngineering Engineering insurance recorded a loss ratio of 21.6%,with NCI, totaling SR 39.1Million% of .6%0.2%Retention RatioLoss Ratio201912.0%42.4%202022.3%21.6%32/51
A&L and Other Insurance1,121.431.0%Million SR Accident and Liability (A&L) insurance includes the following linesof business: personal accident, work related, employer’s liability,third party liability, general liability, product liability, medicalliability, professional liability, theft & burglary, fidelity, safeburglary inside the premises and in transit and other liabilityproductsMillion SR22.2%1,369.918.0%2019637.2586.2496.8486.6176.5 176.2 Insurance companies underwritten SR 1.37 Billion in A&L andOther general insurance premiums in 2020GWPNWP Insurance companies retained SR 6372 Million of A&L and Othergeneral insurance underwritten premiums, with a 46.5% retentionratioNEPNCIA&L and Other A&L and Other general insurance NEP totaled SR 586.2 Million,which represents a 1.8% contribution to market’s NEP% of Total Insurance companies recorded SR 176.2 Million in A&L and Othergeneral insurance’s NCI, and resulted in a loss ratio of 03.5%2.0%1.8%0.7%Retention RatioLoss Ratio201943.4%35.5%202046.5%30.1%33/51
Marine Insurance5.6%653.6 Marine insurance GWP totaled SR 690 Million in 2020,which represents a 1.8% contribution to market’s GWP2019(2.5%)Million SR The Marine insurance line of business includes bothmarine cargo and marine hull insurance690.02020(2.7%)181.2 176.6176.5 171.726.5%65.8 Insurance companies retai
Insurance Density General Insurance Health Insurance Protection Insurance Insurance Density (1) 1,159 1,121 1,048-1.28% Insurance density is defined as Gross Written Premiums per Capita. Despite the increase in GWP In 2020, Insurance density decreased by 1.1% to reach SR 1,095, from SR 1,107 per Capita in