Transcription
Lavelle et al. International Journal of Behavioral Nutrition and Physical Activity(2016) 13:119DOI 10.1186/s12966-016-0446-yRESEARCHOpen AccessLearning cooking skills at different ages: across-sectional studyFiona Lavelle1, Michelle Spence1, Lynsey Hollywood2, Laura McGowan1, Dawn Surgenor2, Amanda McCloat3,Elaine Mooney3, Martin Caraher4, Monique Raats5 and Moira Dean1*AbstractBackground: Cooking skills are increasingly included in strategies to prevent and reduce chronic diet-relateddiseases and obesity. While cooking interventions target all age groups (Child, Teen and Adult), the optimal age forlearning these skills on: 1) skills retention, 2) cooking practices, 3) cooking attitudes, 4) diet quality and 5) health isunknown. Similarly, although the source of learning cooking skills has been previously studied, the differences inlearning from these different sources has not been considered. This research investigated the associations of theage and source of learning with the aforementioned five factors.Methods: A nationally representative (Northern/Republic of Ireland) cross-sectional survey was undertaken with1049 adults aged between 20–60 years. The survey included both measures developed and tested by theresearchers as well as validated measures of cooking (e.g. chopping) and food skills (e.g. budgeting), cookingpractices (e.g. food safety), cooking attitudes, diet quality and health. Respondents also stated when they learnt themajority of their skills and their sources of learning. The data was analysed using ANOVAs with post-hoc analysisand Chi2 crosstabs with a significance level of 0.05.Results: Results showed that child ( 12 years) and/or teen (13–18 years) learners had significantly greater numbersof, and confidence in, their cooking and food skills, cooking practices, cooking attitudes, diet quality(with the exception of fibre intake where adult learners were higher) and health. Mother was the primary source oflearning and those who learnt only from this source had significantly better outcomes on 12 of the 23 measures.Conclusions: This research highlights the importance of learning cooking skills at an early age for skill retention,confidence, cooking practices, cooking attitude and diet quality. Mother remained the primary source of learning,however, as there is a reported deskilling of domestic cooks, mothers may no longer have the ability to teachcooking skills to the next generation. A focus on alternative sources including practical cooking skills educationstarting at an early age is required. This study also highlights the need for further longitudinal research on theimpact of age and source of learning on cooking skills.Keywords: Learning, Cooking skills, Child, Teenager, Adult, Source, Diet quality, Disease preventionBackgroundImportance of cooking skillsCooking is a valuable life skill which is often linked withimproved diet quality, such as improving the uptake offruit and vegetables and an increased recognition ofhealthier foods [1, 2]. In a UK survey of 2000 residents,‘learn to cook’ was rated as the fifth most important life* Correspondence: moira.dean@qub.ac.uk1Institute for Global Food Security, School of Biological Sciences, Queen’sUniversity Belfast, Belfast BT9 5AG, UKFull list of author information is available at the end of the articleskill for modern living (the highest non-tech skill) following ‘searching the internet,’ ‘operating a mobile phone,’‘connecting WiFi’ and ‘mastering online banking,’ [3],demonstrating public interest in learning cooking skills.Cooking skills (CS) have been increasingly used ontheir own and as part of other initiatives as a preventivemeasure to address diet-related diseases including obesity [4, 5]. In recent years there has been an increase inCS and food skills (FS) interventions as a means to improve dietary outcomes [2]. Current reviews on cookingintervention studies indicate that these interventions The Author(s). 2016 Open Access This article is distributed under the terms of the Creative Commons Attribution 4.0International License (http://creativecommons.org/licenses/by/4.0/), which permits unrestricted use, distribution, andreproduction in any medium, provided you give appropriate credit to the original author(s) and the source, provide a link tothe Creative Commons license, and indicate if changes were made. The Creative Commons Public Domain Dedication o/1.0/) applies to the data made available in this article, unless otherwise stated.
Lavelle et al. International Journal of Behavioral Nutrition and Physical Activity (2016) 13:119vary in their teaching methods such as informationprovision, demonstrations and practical hands on sessions and have been targeted at people of all ages,including children [6], teenagers [7], and adults [8].While the rationale for targeting each of these groups isclearly stated in each intervention, the optimal age forlearning CS with regards to cooking skill maintenanceand dietary outcomes is yet unknown.Rationale for cooking skills interventions with differentage groupsThe increase in cooking interventions for children maybe attributed to the belief that prevention of chronic diseases should begin at an early age [9]. Dave andcolleagues [10], noted that a dislike for cooking is associated with fast food consumption which in turn has beenlinked with increasing levels of obesity. Thus there is anargument for children to learn cooking skills in their developmental years [11]. Among adolescents, thoseinvolved in food preparation have been shown to have ahigher diet quality than those with no involvement intheir meal preparation [12]. In the adult populationincreased and/or improved cooking skills have beenshown to improve cooking attitudes, confidence, healthyfood choices and dietary outcomes [2, 8].Although there has been some success in improvingcertain aspects of diet and food behaviours in each ofthese groups in the short term [6, 8, 12], there have beenfew long term positive changes [2]. Limited evidenceshows that cooking behaviours track from adolescenceto young adulthood [13], however, it is unknownwhether these behaviours can track from childhood rightthrough to adulthood. Thus very little is known aboutthe optimal age for learning CS and its subsequentimpact on adult dietary habits.Impact of age on the acquisition of skills in other areasIn relation to general skills acquisition, Janacsek et al.[14] showed that the most effective time for learningnew skills is from childhood until early adolescence. Thisprinciple has been shown to be effective in other areassuch as education, where early acquisition of learningrelated skills has had a positive impact on academic trajectories in math and reading [15]. In light of this background in other life skills, there is a need to investigatewhether early learning of CS has a positive dietaryimpact in later life.Measures used in cooking skills research to measureimpactThe learning and use of CS and FS have been positivelylinked to cooking confidence [16], cooking ability [16], foodsafety [17], reduction in food waste [18] and time spent inmeal preparation [19]. The possession of CS has also beenPage 2 of 11associated with cooking identity [20], Creativity [21], andFood Neophilia [22]. As previously emphasised, CS havebeen associated with better diet quality [23], where dietquality was measured using different instruments such asEating Choice Index (ECI) [24] and food frequency measures such as Dietary Instrument for Nutrition Education(DINE) [25]. Further, the impact of learning cooking skillsand home meal preparation behaviours on BMI has beenpreviously investigated [26]. Utilising these findings, this research investigates the relationships between the age atwhich the majority of CS are learnt and: (1) current cookingand food skills; (2) current cooking practices; (3) cookingattitudes; (4) diet quality; and (5) health and wellbeing.Does source of learning have an impact?In addition to the timing of learning CS, where or fromwhom individuals learn their CS also has the potential toinfluence their dietary habits [27]. Previous research hascited ‘the Mother’ as the primary source for learning CSacross all social classes, with cooking classes in schoolbeing the second most common source for learning [27].However, the impact the source of learning has oncurrent cooking and dietary habits is unknown. Thus, asecondary aim of this study was to investigate whetherthe source of learning also affects the aforementionedfive variables.MethodsProcedure and sampleThe data reported here were part of a larger crosssectional survey investigating CS and FS, sociodemographic and psychological factors on diet quality on theisland of Ireland (IOI includes Northern Ireland [NI]and Republic of Ireland [ROI]). A nationwide market research company, SMR, conducted all sampling and fielddata collection. A sample of 1049 adults between theages of 20–60 years, was selected using quota samplingto ensure the sample was nationally representative.Quotas were applied for gender, age, area of residenceand socio-economic grouping to achieve a balance ofparticipants. Participants were eligible if they prepared amain meal at least once a week and only one participantper household was eligible to partake in the study. Allsurvey data were collected using Computer Assisted Personal Interviewing (CAPI) and conducted by fullybriefed interviewers in the participants’ home betweenOctober and December 2014. Where a potential eligibleparticipant declined to partake, the reason was recorded.A total of 123 potential participants did not partake dueto: dietary restrictions which impacted their foodchoices; being too busy; not being interested; not havinga sufficient level of English; without reason; not beingaged 20–60 years; never preparing or cooking a mainmeal; security reasons; and not living at the address (in
Lavelle et al. International Journal of Behavioral Nutrition and Physical Activity (2016) 13:119Page 3 of 11weighted descending order). All participants wereinformed that by partaking in the survey they were consenting for their data to be used. No personal details, forexample name, were recorded, and participants weremade aware that that they could withdraw at any time.Ethical approval for this research was received fromQueen’s University Belfast Research Ethics Committeeand the study was conducted in line with the guidancegiven in the Declaration of Helsinki.of skills was given as an example, this may haveexcluded participants who had not yet reached thatnumber of skills. By leaving this question as subjective, itallowed for the maximum number of participants topartake and for each participant to respond with aspecific time which they considered had the most significant amount of learning. Participants were also askedabout from whom and/or where they learnt these skills(multiple sources were allowed).Survey and measuresCooking and food skillsThe survey included a number of development stages; arapid review of the literature [2], interviews with expertswho worked on healthy eating and cooking and foodskills education (n 4), and extensive piloting with arange of participants including students, employed, andunemployed adults (n 40), resulting in a number ofamendments. Where possible existing reliable and validated instruments were used for some components ofthe survey, otherwise researcher developed measureswere used. An overview of the measures used is givenbelow. Socio-demographic information such as age, gender, education level and occupation of highest householdearner was collected (Table 1).Two scales were developed and piloted as part of thesurvey; the CS scale and the FS scale. These scales weredeveloped so that the measures for CS and FS wereculturally appropriate for the IOI. Participants wereshown cards with a list of CS, such as chopping, mixingand stirring foods, stewing food, roasting food, and a listof FS for example, preparing meals in advance and comparing prices before buying food. Participants selectedthose skills which they possessed and were subsequentlyasked to rate their confidence in these selected skills,using a scale of 1 (very poor) to 7 (very good). The twoscales had an acceptable internal reliability (Cronbach’salpha for both was .90). These questions resulted infour measures; (1) number of CS; (2) number of FS; (3)CS confidence and; (4) FS Confidence. The number ofskills measures were a sum of the number of reportedskills and the confidence scores consisted of a meanscore. A higher score in each means a higher number ofskills used or a higher level of confidence. For furtherdetails on scales please contact authors.Learning of cooking skillsParticipants were asked ‘At what stage of your life didyou learn most of your cooking skills?’ The responseswere classified into ‘As a child (under 12 years),’ As ateenager (13–18 years),’ or ‘As an adult (18 years).’ Noexample of what was considered ‘most’ was given, because if specific skills or a certain number of skills weresuggested, a participant may have responded with thetime they learnt a specific skill not when the majority oftheir learning occurred. In addition, if a certain numberCooking practicesThe food safety measure consisted of a number of questions relating to best practise for the safe handling andTable 1 Characteristics of 3 groups in stages of most learningChildTeenAdultN 198 (22.9 %)N 286 (33.1 %)N 381 (44 %)MeanSDMeanSDMeanSDAge sehold Size3.171.423.061.303.081.33N (%)N (%)N (%)N (%)N (%)N (%)SexMale37 (18.7)Female161 (81.3)Male97 (33.9)Female189 (66.1)Male203 (53.3)Female178 (46.7)SES*High91 (46)Low107 (54)High142 (49.7)Low144 (50.3)High197 (51.7)Low184 (48.3)N (%)N (%)N (%)N (%)N (%)N (%)N (%)N (%)N (%)Compulsory33 (16.7)Further117 (59.1)Higher48 (24.2)Compulsory29 (10.1)Further184 (64.3)Higher73 (25.5)Compulsory48 (12.6)Further239 (62.7)Higher94 (24.7)Education Level*Socio-economic groupings were created based upon the occupation of the highest earner in the household and were classified as High (ABC1 - higher,intermediate, supervisory, clerical & junior managerial, administrative, professional occupations) versus low (C2DE - skilled, semi-skilled and unskilled manualoccupations, unemployed and lowest grade occupations), developed by the ONS, UK Office for National Statistics [53]
Lavelle et al. International Journal of Behavioral Nutrition and Physical Activity (2016) 13:119storage of food, for example, “Leftovers should be storedin the fridge and used within: 1 day, 3 days, 5 days, don’tknow” and “Raw chicken should always be washed beforecooking: True, False, Don’t know,” with a higher score(number of correct answers) equating to a betterknowledge and practise in food safety applications. Thismeasure was developed and tested by the researchers(Cronbach’s alpha 0.62) as there were no shortmeasures available for food safety in food preparation,suitable for the survey. The food waste measure wasbased on two questions, “How often do you: (1) Throwaway food after meals because you make too much, and(2) Throw away food because it goes past its use-by orbest before date,” respondents were able to answer either‘Never,’ ‘Sometimes,’ or ‘Often’, a lower score in foodwaste equating to being less wasteful with food. Thismeasure had an acceptable internal reliability (Cronbach’s alpha 0.71). Participants were also asked “Howlong do you typically spend preparing and cooking foodfrom start to finish for the main meal on a week day andon a weekend (in minutes)” to capture difference between midweek and weekend meal preparation patterns.Cooking attitudesCooking identity i.e. the degree to which you see yourself as a good cook, and Food Neophilia i.e. an opennessto trying new foods, were assessed using an adjusted 11item scale from previous research [20, 28, 29]. A higherscore on both of the scales indicates a positive result, i.e.that the participant identified themselves as a good cook,or had a higher willingness to try new foods or techniques. The creativity measure was a composite score(Cronbach’s alpha 0.78) and related to imagination/creativity with food and cooking. It was measured using 6statements on a 5-point Likert scale from 1 stronglyagree to 5 strongly disagree. A higher score in the measure equated to being more creative.Diet qualityRespondent’s likelihood of choosing healthy food optionswas measured using a validated tool; the ECI [24]. Thepreviously validated DINE was used to assess dietary intake of fibre; saturated fat; fruit and vegetables; friedfood; and biscuits, chocolate, or savoury snacks [25].The frequency of consumption of fried food and biscuits,chocolate, or savoury snacks were converted into a scorewith a lower score equating to never or very little consumption of the food and a higher score equating to amore frequent consumption. Participants were alsoasked “In a typical week how often do you . (1) eat takeaway foods or fast food which are ready to eat as yourmain meal (e.g. Chinese, fish and chips or McDonaldsetc.) [Consumption of take-away food] and (2) eat takeaway foods or fast food bought from the supermarket toPage 4 of 11be eaten at home as your main meal (e.g. Indian mealkits or pizza) [Consumption of convenience food]?” Thisprovided an indication of how often they did not cook.A higher score in these questions equated to a more frequent consumption of these foods. Participants reportedthe most common main meal that they prepared andfollowing this were asked to choose the option that bestdescribed how they prepared this dish from six optionsdenoting different levels of preparation and cooking options; 1) Buy it ready-made and reheat it; 2) Use mostlypre-prepared ingredients and I assemble the dish; 3) Usemostly pre-prepared ingredients and some fresh, basicor raw ingredients; 4) Use mostly fresh, basic or raw ingredients and some pre-prepared ingredients; 5) Useonly fresh, basic or raw ingredients; 6) I do somethingelse not listed here. Responses were classified into 3 categories: mainly fresh ingredients; a mixture of fresh andpre-prepared ingredients; and mainly pre-preparedingredients.Health and wellbeing indicatorsBMI was calculated from self-reported data on height andweight. The existing measure was used for healthconsciousness (General Health Interest [GHI]) [30]. Itemsfrom this measure relating to food were used in thesurvey. Participants responded to two statements, “I amvery particular about the healthiness of food I eat,” and “Ieat what I like and I do not worry much about the healthiness of food” on a 5 point Likert scale. A higher score inthis measure equated with a greater health motivation.Data analysisAll data were analysed using IBM SPSS Statistics Version22 (IBM Corporation, 2013). Descriptive statistics(means, standard deviations (SD), etc.) were conductedto examine socio-demographic differences between thethree groups, Child Learners (CL) [ 12 years], TeenageLearners (TL) [12–18 years] and Adult Learners (AL)[18 years]. Chi2 crosstabs and ANOVAs with post hoccomparisons made with Tukey’s HSD (honestly significant difference) test were used to investigate significantdifferences between 1) the three groups of learners and2) the different sources of learning on the differentcomponents of CS and FS; Cooking Practices; CookingAttitudes; Diet Quality; and Health and Wellbeing indicators. Differences were considered as significant for allanalysis, at a level of 0.05.ResultsThe sociodemographic details of the three groups (CL,TL, AL) are displayed in Table 1. As seen in Table 1 themean of all sociodemographic details are similar, withthe exception of gender, as the percentage of males
Lavelle et al. International Journal of Behavioral Nutrition and Physical Activity (2016) 13:119increases from CL to TL and then again from TL to AL(18.7 %, 33.9 %, 53.3 % respectively).Table 2 shows an overview of the significant differences for the ANOVAs performed. Following is a moredetailed report of the findings for each component.Cooking and food skillsThis component consisted of CS and FS confidence andnumber of CS and FS used by the participants. TL had asignificantly higher CS Confidence (F 9.82 (2,862), P 0.005), FS Confidence (F 16.47 (2,862), P 0.005) andnumber of FS (F 11.64 (2,862), P 0.005), than CL orPage 5 of 11AL. The number of CS was significantly higher (F 5.47(2,862), P 0.005) for both TL and CL in comparison toAL.Cooking practicesCL and TL scored significantly higher than AL on thefood safety score (F 10.98 (2,862), P 0.005). CLwasted significantly less food (F 7.03 (2,862), P 0.005)than TL or AL. Further, CL invested a significantlygreater amount of time cooking [both weekday (F 21.50(2,853), P 0.005) and weekend (F 10.75 (2,862), P 0.005)] than both TL and AL.Table 2 Differences in mean scores between Child, Teen and Adult learners on various measuresReliabilityRangeαOverall SampleF (df)M (SD)SignificanceChild(n 198)Teen(n 286)Adult(n 381)PM (SD)M (SD)M (SD)Cooking Food SkillsCooking Confidence0.930–9847.78 (29.32)9.82 (2,862)0.00053.40b (27.30)57.37a (31.64)47.76b (25.44)No. of CS–0–148.21 (4.49)5.47 (2,862)0.0049.31a (3.98)9.36a (4.55)8.39b (4.05)baFS Confidence0.940–13345.82 (38.64)16.47 (2,862)0.00046.50 (35.97)61.26 (46.13)44.81b (32.89)No. of FS–0–197.83(6.01)11.64 (2,862)0.0007.86b (5.34)9.96a (6.75)7.91b (5.52)Time spent cookingmidweek–0–24045.48 (34.02)21.50 (2,853)0.00061.99a (45.73)46.38b (27.44)42.87b (30.188)Time spent cookingweekend–0–28053.83 (36.52)10.75 (2,862)0.00067.62a (44.56)54.20b (31.28)53.61b (35.91)Food Safety0.620–52.78 (1.54)10.98 (2,862)0.0003.07a (1.40)3.15a (1.50)2.64b (1.52)Food Waste0.712–63.42 (1.00)7.03 (2,862)0.0013.21a (0.96)3.54b (0.82)3.46b (1.06)0.786–3018.69 (4.79)35.28 (2,862)0.00020.66a (4.30)20.21a (4.21)17.90b (4.52)aaCooking PracticesCooking AttitudesCooking CreativityCooking Identity0.887–3524.45 (5.39)18.43 (2,862)0.00026.19 (4.73)26.12 (4.47)24.20b (4.84)Food Neophilia0.743–1510.47 (2.67)13.51 (2,861)0.00010.60b (2.70)11.40a (2.35)10.42b (2.42)ECI–4–2012.22 (2.95)3.60 (2,862)0.02812.91a (2.99)12.21b (2.71)12.50ab (2.89)DINE (Sat Fat)–8–9235.54 (13.04)0.87 (2,862)0.43235.99 (14.01)34.46 (10.95)35.03 (13.00)DINE (fibre)–0.000abFried food–1–52.43 (0.78)6.84 �1–53.13 (1.07)7.78 (2,862)0.000Consumption of Takeaway–1–62.55 (0.92)4.75 (2,862)0.009Consumption of Takeawaystyle food–1–62.29 (0.97)2.92 (2,862)0.0512.07 (0.88)2.20(0.89)2.26b (0.95)Portions of Fruit per day–0–52.48 (0.97)3.71 (2,838)0.0342.69a (1.04)2.59ab (0.87)2.47b (0.94)Portions of Veg per day–0–51.88 (1.00)0.60 (2,862)0.5471.98 (1.02)2.01 (0.97)1.93 (1.00)BMI–13.03–46.4224.45 (4.20)1.62 (2,617)0.25424.06 (4.66)24.62 (3.95)24.80 (3.69)GHI–Diet Quality6–9134.62 (11.25)10.73 (2,862)35.19ab(9.68)b33.41 (10.61)37.35a (11.07)2.29 (0.70)2.49b (0.74)3.14b (1.03)2.91a (1.04)3.24b (1.10)2.27a (0.87)2.49b (0.87)2.48b (0.87)(0.80)aaabHealth Wellbeing Indicators2–106.85 (1.62)3.92 (2,862)0.020a7.27 (1.52)b6.90 (1.46)6.97ab (1.52)M mean, SD Standard Deviation, CS Cooking skills, FS Food skills, ECI Eating Choice Index, DINE Dietary Index for Nutrition Education, Sat Saturated, BMI Body MassIndex, GHI General Health InterestSuperscript letters depict where significant differences (P 0.05) fall between the groups
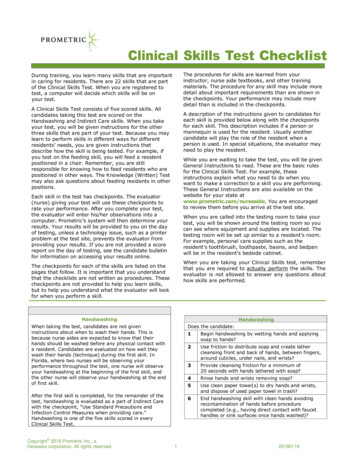
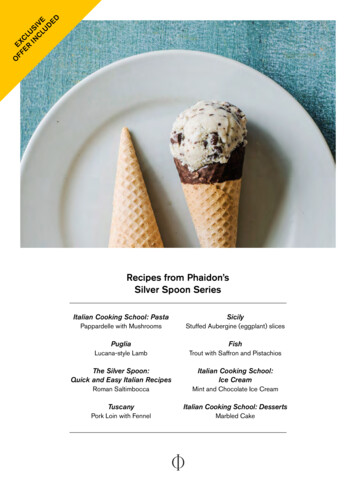
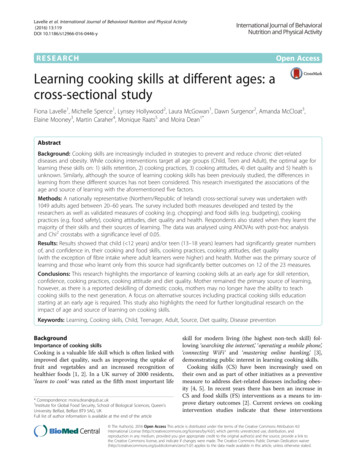
Lavelle et al. International Journal of Behavioral Nutrition and Physical Activity (2016) 13:119Page 6 of 11Cooking attitudesSources of learning cooking skillsSignificant differences were seen between the threegroups on all Cooking Attitudes. CL and TL scoredsignificantly higher than AL on Creativity (F 35.28(2,862), P 0.005) and cooking identity (F 18.43(2,862), P 0.005). However, TL were more open to newfoods (F 13.51 (2,861), P 0.005) than CL or AL.Following is an overview of sources of learning CS andwhether they had associations with the same measuresas above in Cooking and Food Skills; Cooking Practices;Cooking Attitudes; Diet Quality; and Health andWellbeing. Table 3 shows the sources from where cooking skills were learnt. The top five stated sources were:Mother (60.1 %); a different relative (16.2 %); Friends(13.6 %); Secondary School (9.3 %); and Food Packet(7.1 %).As participants were able to report more than onesource and the overwhelming majority reporting‘Mother’ as their source of learning, the results are categorised as ‘Mother Only’ (Mother mentioned exclusively) (N 426, 40.6 %) versus any other source orcombination of sources of learning (N 600, 57.2 %).Table 4 shows an overview of the significant differencesbetween the sources of learning on current cooking andfood skills, Cooking Practices, Cooking Attitudes, DietQuality and Health and Wellbeing. Results show thatMother only had significantly better outcomes on twelveof the twenty three measures; Cooking Confidence (F 5.35 (1,1024), P 0.05), Number of CS (F 6.88 (1,1024),P 0.05), Cooking Creativity (F 9.03 (1,1024), P 0.005), Cooking Identity (F 14.40 (1,1024), P 0.005),ECI (F 5.87 (1,1024), P 0.05), Consumption of friedfood (F 10.58 (1,1024), P 0.005), Consumption oftakeaway (F 13.19 (1,1024), P 0.005), Consumption oftakeaway style food from shops (F 13.46 (1,1024), P 0.005), portions of fruit per day (F 7.48 (1,998), P 0.05), and portions of veg per day (F 14.52 (1,1024), P 0.005). There was one borderline significant difference(F 3.67 (1,1024), P 0.052) for DINE fibre. A significant difference was found also (P 0.005) betweensource of learning and type of ingredients used in cooking (Fig. 2).Diet qualityIn the ECI, CL had significantly higher scores (F 3.60(2,862), P 0.05), indicating a greater interest in eatinghealthily compared to TL. No differences were seenacross the three groups for Saturated Fat intake, although,AL had a significantly higher intake of fibre (F 10.73(2,862), P 0.005) than TL. Significant differences werefound between the groups on the frequency of consumption of fried food (F 6.84 (2,862), P 0.005), and on consumption of biscuits, chocolate or savoury snacks (F 7.78 (2,862), P 0.005). In relation to fried food, TL consumed it less frequently than AL. TL also consumed biscuits, chocolate or savoury snacks less frequently thaneither CL or AL. A significant difference (F 4.75 (2,862),P 0.05) was found between the three groups on the frequency of consumption of take-away, with CL consumingtakeaway less frequently than both TL and AL. A bordering significant difference (F 2.92 (2,862), P 0.05) wasfound between the groups on the frequency of consumption of take-away styled foods purchased from a supermarket such as an Indian meal kit or pizza (convenienceproducts). Again, CL consumed convenience food lessfrequently than AL.Differences between groups on daily fruit and vegetableintakes showed a significant difference on the portions offruit consumed per day (F 3.71 (2,838), P 0.05), withCL consuming a significantly higher amount of fruit thanAL. No group differences were found on the portions ofvegetables consumed (F 0.60 (2,862), P 0.55).Figure 1 shows the significant differences (P 0.05)found between the three groups on the type of ingredients used in meal preparation (mainly fresh ingredients,a mixture of fresh and pre-prepared ingredients, mainlypre-prepared ingredients). AL appear to be twice aslikely to use pre-prepared ingredients in meal preparation when compared to those who learnt cooking skillsat earlier stages who were more inclined to use amixture of fresh and prepared or fresh ingredients.Health and wellbeing indicatorsThere were no significant differences in BMI across thethree types of learners (F 1.62 (2,617), P 0.2). In relation to GHI, CL had significantly more interest in theirhealth (F 3.92 (2,862), P 0.05), compared to TL.DiscussionTo our knowledge, this is the first study to investigatethe associations between when CS are learnt (self-perceived measurement of when the majority of learningoccurred) and current adult dietary and cooking behaviours. The results indicate that, learning CS mainly at ayounger age has a positive effect on many cookingrelated behaviours, practices and dietary quality.CL and TL reported better outcomes than AL on thenumber of currently used CS, cooking creativity andcooking identity. Both CLs and TLs possessed a significantly greater number of CS than AL. Laska et al. [13]showed CS track from adolescence into adulthood. Ourstudy suggests this tracking could start from childhoodinto adulthood. The possession and application of agreater number of CS has also been linked to a higherdiet quality in past studies [2, 23]. In addition, our
Lavelle et al. International Journal of Behavioral Nutrition and Physical Activity (2016) 13:119Page 7 of 11Fig. 1 Differences in the type of ingredients used in cooking between Child, Teen and Adult LearnersTable 3 Sources of learning cooking skillsSourcePercentMother60.1Home (from a different relative)16.2Friends13.6Post – Primary school (Home Ec etc.)9.3Food Packet7.1Partner5.6Self-taught5.5Cookery class4.7Internet Websites4.0Recipe books/magazines2.6TV Programmes1.3Don’t know1.3Other1.0Doctor0.9Health promotion leaflet0.6Health Practitioner (Dietician)0.5Smart Phone App0.5YouTube0.4Primary School0.3Social Media0.2Work0.2Weight Loss programme0.1findings suggest if CS are learnt at younger ages theseindividuals are more creative in the kitchen and aremore likely to see themselves as ‘cooks’ (cookingidentity).CLs spent more time than ALs in food preparation(both weekday and weekend), reported less food waste,consumed less takeaways and takeaway conveniencefood from the supermarket and shops, and ate morefruit. This suggests that those who learned cooking skillsas a child spend more time
Background: Cooking skills are increasingly included in strategies to prevent and reduce chronic diet-related diseases and obesity. While cooking interventions target all age groups (Child, Teen and Adult), the optimal age for learning these skills on: 1) skills retention, 2) cooking practices, 3) cooking attitudes, 4) diet quality and 5) health is