Transcription
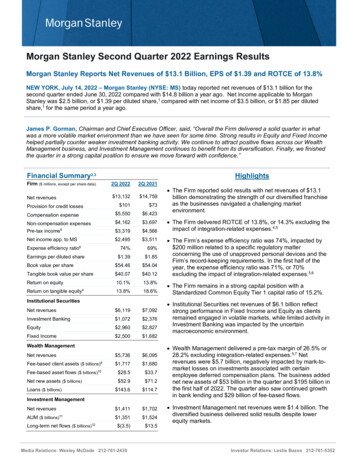
Morgan Stanley Second Quarter 2022 Earnings ResultsMorgan Stanley Reports Net Revenues of 13.1 Billion, EPS of 1.39 and ROTCE of 13.8%NEW YORK, July 14, 2022 – Morgan Stanley (NYSE: MS) today reported net revenues of 13.1 billion for thesecond quarter ended June 30, 2022 compared with 14.8 billion a year ago. Net income applicable to MorganStanley was 2.5 billion, or 1.39 per diluted share,1 compared with net income of 3.5 billion, or 1.85 per dilutedshare,1 for the same period a year ago.James P. Gorman, Chairman and Chief Executive Officer, said, “Overall the Firm delivered a solid quarter in whatwas a more volatile market environment than we have seen for some time. Strong results in Equity and Fixed Incomehelped partially counter weaker investment banking activity. We continue to attract positive flows across our WealthManagement business, and Investment Management continues to benefit from its diversification. Finally, we finishedthe quarter in a strong capital position to ensure we move forward with confidence.”Financial Summary2,3HighlightsFirm ( millions, except per share data)2Q 20222Q 2021Net revenues 13,132 14,759 101 73Compensation expense 5,550 6,423Non-compensation expensesPre-tax income8 4,162 3,697 3,319 4,566Net income app. to MS 2,495 3,51174%69% 1.39 1.85Book value per share 54.46 54.04Tangible book value per share 40.07 40.12Return on equity10.1%13.8%Return on tangible equity413.8%18.6%Net revenues 6,119 7,092Investment Banking 1,072 2,376Equity 2,960 2,827Fixed Income 2,500 1,682 5,736 6,095 1,717 1,680Fee-based asset flows ( billions) 28.5 33.7Net new assets ( billions) 52.9 71.2 143.6 114.7 1,411 1,702 1,351 1,524 (3.5) 13.5Provision for credit lossesExpense efficiency ratio6Earnings per diluted shareInstitutional SecuritiesWealth ManagementNet revenuesFee-based client assets ( billions)910Loans ( billions)Investment ManagementNet revenuesAUM ( billions)1112Long-term net flows ( billions)Media Relations: Wesley McDade 212-761-2430 The Firm reported solid results with net revenues of 13.1billion demonstrating the strength of our diversified franchiseas the businesses navigated a challenging marketenvironment. The Firm delivered ROTCE of 13.8%, or 14.3% excluding theimpact of integration-related expenses.4,5 The Firm’s expense efficiency ratio was 74%, impacted by 200 million related to a specific regulatory matterconcerning the use of unapproved personal devices and theFirm’s record-keeping requirements. In the first half of theyear, the expense efficiency ratio was 71%, or 70%excluding the impact of integration-related expenses.5,6 The Firm remains in a strong capital position with aStandardized Common Equity Tier 1 capital ratio of 15.2%. Institutional Securities net revenues of 6.1 billion reflectstrong performance in Fixed Income and Equity as clientsremained engaged in volatile markets, while limited activity inInvestment Banking was impacted by the uncertainmacroeconomic environment. Wealth Management delivered a pre-tax margin of 26.5% or28.2% excluding integration-related expenses.5,7 Netrevenues were 5.7 billion, negatively impacted by mark-tomarket losses on investments associated with certainemployee deferred compensation plans. The business addednet new assets of 53 billion in the quarter and 195 billion inthe first half of 2022. The quarter also saw continued growthin bank lending and 29 billion of fee-based flows. Investment Management net revenues were 1.4 billion. Thediversified business delivered solid results despite lowerequity markets.Investor Relations: Leslie Bazos 212-761-5352
Institutional SecuritiesInstitutional Securities reported net revenues for the current quarter of 6.1 billion compared with 7.1 billion a yearago. Pre-tax income was 1.6 billion compared with 2.5 billion a year ago.8Investment Banking revenues down 55% from a year ago: Advisory revenues decreased from a year ago driven bylower levels of completed M&A transactions. Equity underwriting revenues significantly decreased from ayear ago on lower issuances given uncertainty in themarkets. Fixed income underwriting revenues decreased from a yearago as macroeconomic conditions contributed to lowerissuances.2Q 20222Q 2021Net Revenues 6,119 7,092Investment Banking 1,072 2,376Advisory 598 664Equity underwriting 148 1,072Fixed income underwriting 326 640Equity 2,960 2,827Fixed Income 2,500 1,682Other (413) 207 82 70Total Expenses 4,483 4,524Compensation 2,050 2,433Non-compensation 2,433 2,091( millions)Equity net revenues up 5% from a year ago: Equity net revenues increased from a year ago on continuedstrong client engagement and elevated market volatility, withparticular strength in derivatives products and primebrokerage.Fixed Income net revenues up 49% from a year ago: Fixed Income net revenues increased substantially from ayear ago reflecting strength in our macro businesses and incommodities on increased client activity and volatility in themarkets.Other:Provision for credit losses Other revenues decreased from a year ago driven by markto-market losses on corporate loans held for sale, net ofhedges, reflecting the widening of credit spreads in thequarter. Mark-to-market losses on investments associatedwith certain employee deferred compensation plans alsocontributed to the decline.Total Expenses: Compensation expense decreased from a year ago primarily driven by a decline related to certain deferredcompensation plans linked to investment performance and the impact of lower revenues. Non-compensation expenses increased from a year ago primarily driven by higher litigation costs, including 200million related to a specific regulatory matter concerning the use of unapproved personal devices and the Firm’srecord-keeping requirements, and higher volume-related expenses.2
Wealth ManagementWealth Management reported net revenues of 5.7 billion compared with 6.1 billion a year ago. Pre-tax income was 1.5 billion compared with 1.6 billion a year ago.8 Pre-tax margin was 26.5% in the current quarter, or 28.2%excluding the impact of integration-related expenses.5,7Net revenues decreased 6% from a year ago:( millions) Asset management revenues increased 2% reflectinghigher asset levels driven by continued positive fee-basedflows, partially offset by lower market levels compared to ayear ago. Transactional revenues13 decreased 17% excluding theimpact of mark-to-market losses on investmentsassociated with certain employee deferred compensationplans. The decrease was driven by lower client activityfrom a strong prior year period.Net interest income Net interest income increased from a year ago on higherinterest rates and continued bank lending growth.Total Expenses:2Q 20222Q 2021Net Revenues 5,736 6,095Asset management 3,510 3,447 291 1,172 1,747 1,255 188 221 19 3Total Expenses 4,196 4,456Compensation 2,895 3,275Non-compensation 1,301 1,181Transactional13OtherProvision for credit losses Compensation expense decreased driven by a declineprimarily related to certain deferred compensation planslinked to investment performance. Non-compensation expenses increased from a year ago primarily driven by investments in technology, as well ashigher marketing and business development costs and integration-related expenses.Investment ManagementInvestment Management reported net revenues of 1.4 billion compared with 1.7 billion a year ago. Pre-tax incomewas 249 million compared with 430 million a year ago.8Net revenues down 17% from a year ago:( millions) Asset management and related fees decreased from ayear ago driven by lower AUM, primarily due to thedecline in equity markets. Performance-based income and other revenuesdecreased from a year ago primarily reflecting mark-tomarket losses on investments associated with certainemployee deferred compensation plans and lowermarks on public investments reflecting the decline inthe equity markets.2Q 20222Q 2021Net Revenues 1,411 1,702Asset management and related fees 1,304 1,418 107 284 1,162 1,272Compensation 605 715Non-compensation 557 557Performance-based income and otherTotal ExpensesTotal Expenses: Compensation expense decreased from a year ago primarily driven by a decline related to certain deferredcompensation plans linked to investment performance.3
Other Matters The Firm repurchased 2.7 billion of its outstanding commonstock during the quarter, completing our 12 billion buybackplan that we announced last year. The Firm also announced a multi-year repurchaseauthorization of up to 20 billion of outstanding commonstock without a set expiration date. The Board of Directors declared a 0.775 quarterly dividendper share, an 11% increase from the current 0.70 per sharedividend, payable on August 15, 2022 to commonshareholders of record on July 29, 2022. The Standardized Common Equity Tier 1 capital ratio was15.2%, 190 basis points above the new aggregatestandardized approach CET1 requirement beginning October1, 2022.2Q 20222Q 2021CET1 capital1515.2%16.6%Tier 1 capital1516.9%18.3%CET1 capital1515.4%17.7%Tier 1 capital1517.1%19.5%Tier 1 leverage166.6%7.5%SLR175.4%5.9% 2,738 2,9393334 82.05 86.211,7231,83423.6%23.1%Capital14Standardized ApproachAdvanced ApproachLeverage-based capitalCommon Stock RepurchasesRepurchases ( millions)Number of Shares (millions)Average PricePeriod End Shares (millions)Tax Rate4
Morgan Stanley is a leading global financial services firm providing a wide range of investment banking, securities,wealth management and investment management services. With offices in 41 countries, the Firm’s employees serveclients worldwide including corporations, governments, institutions and individuals. For further information aboutMorgan Stanley, please visit www.morganstanley.com.A financial summary follows. Financial, statistical and business-related information, as well as information regardingbusiness and segment trends, is included in the financial supplement. Both the earnings release and the financialsupplement are available online in the Investor Relations section at www.morganstanley.com.NOTICE:The information provided herein and in the financial supplement, including information provided on the Firm’s earningsconference calls, may include certain non-GAAP financial measures. The definition of such measures or reconciliationof such measures to the comparable U.S. GAAP figures are included in this earnings release and the financialsupplement, both of which are available on www.morganstanley.com.This earnings release may contain forward-looking statements, including the attainment of certain financial and othertargets, objectives and goals. Readers are cautioned not to place undue reliance on forward-looking statements, whichspeak only as of the date on which they are made, which reflect management’s current estimates, projections,expectations, assumptions, interpretations or beliefs and which are subject to risks and uncertainties that may causeactual results to differ materially. For a discussion of risks and uncertainties that may affect the future results of theFirm, please see “Forward-Looking Statements” preceding Part I, Item 1, “Competition” and “Supervision andRegulation” in Part I, Item 1, “Risk Factors” in Part I, Item 1A, “Legal Proceedings” in Part I, Item 3, “Management’sDiscussion and Analysis of Financial Condition and Results of Operations” in Part II, Item 7 and “Quantitative andQualitative Disclosures about Risk” in Part II, Item 7A in the Firm’s Annual Report on Form 10-K for the year endedDecember 31, 2021 and other items throughout the Form 10-K, the Firm’s Quarterly Reports on Form 10-Q and theFirm’s Current Reports on Form 8-K, including any amendments thereto.5
1Includes preferred dividends related to the calculation of earnings per share of 104 million and 103 million for the second quarter of2022 and 2021, respectively.2The Firm prepares its Consolidated Financial Statements using accounting principles generally accepted in the United States (U.S.GAAP). From time to time, Morgan Stanley may disclose certain “non-GAAP financial measures” in the course of its earnings releases,earnings conference calls, financial presentations and otherwise. The Securities and Exchange Commission defines a “non-GAAP financialmeasure” as a numerical measure of historical or future financial performance, financial position, or cash flows that is subject to adjustmentsthat effectively exclude, or include amounts from the most directly comparable measure calculated and presented in accordance with U.S.GAAP. Non-GAAP financial measures disclosed by Morgan Stanley are provided as additional information to analysts, investors and otherstakeholders in order to provide them with greater transparency about, or an alternative method for assessing our financial condition,operating results, or capital adequacy. These measures are not in accordance with, or a substitute for U.S. GAAP, and may be differentfrom or inconsistent with non-GAAP financial measures used by other companies. Whenever we refer to a non-GAAP financial measure, wewill also generally define it or present the most directly comparable financial measure calculated and presented in accordance with U.S.GAAP, along with a reconciliation of the differences between the non-GAAP financial measure we reference and such comparable U.S.GAAP financial measure.3Our earnings releases, earnings conference calls, financial presentations and other communications may also include certain metricswhich we believe to be useful to us, analysts, investors, and other stakeholders by providing further transparency about, or an additionalmeans of assessing, our financial condition and operating results.4Return on average tangible common equity and return on average tangible common equity excluding integration-related expenses arenon-GAAP financial measures that the Firm considers useful for analysts, investors and other stakeholders to allow comparability of periodto-period operating performance and capital adequacy. The calculation of return on average tangible common equity represents full year orannualized net income applicable to Morgan Stanley less preferred dividends as a percentage of average tangible common equity.Tangible common equity, also a non-GAAP financial measure, represents common equity less goodwill and intangible assets net ofallowable mortgage servicing rights deduction. The calculation of return on average tangible common equity excluding integration-relatedexpenses is adjusted in both the numerator and the denominator to exclude the integration-related expenses associated with theacquisitions of E*TRADE and Eaton Vance.5The Firm’s and business segment’s second quarter results for 2022 and 2021 include integration-related expenses as a result of theE*TRADE and Eaton Vance acquisitions reported in the Wealth Management segment and Investment Management segment, respectively.The amounts are presented as follows (in millions):2Q 20222Q 2021FirmCompensationNon-compensationTotal non-interest expensesTotal non-interest expenses (after-tax) 11109 120 92 2565 90 69Wealth ManagementCompensationNon-compensationTotal non-interest expensesTotal non-interest expenses (after-tax) 492 96 74 951 60 46Investment ManagementCompensationNon-compensationTotal non-interest expensesTotal non-interest expenses (after-tax) 717 24 18 1614 30 236The Firm expense efficiency ratio represents total non-interest expenses as a percentage of net revenues. The Firm expense efficiencyratio excluding integration-related expenses is a non-GAAP financial measure that the Firm considers useful for analysts, investors andother stakeholders to allow comparability of period-to-period operating performance.7Pre-tax margin represents income before taxes divided by net revenues. Wealth Management pre-tax margin excluding the integrationrelated expenses represents income before taxes less those expenses divided by net revenues. Wealth Management pre-tax marginexcluding integration-related expenses is a non-GAAP financial measure that the Firm considers useful for analysts, investors and otherstakeholders to allow comparability of period-to-period operating performance.6
8Pre-tax income represents income before taxes.9Wealth Management fee-based client assets represent the amount of assets in client accounts where the basis of payment for services isa fee calculated on those assets.10Wealth Management fee-based asset flows include net new fee-based assets (including asset acquisitions), net account transfers,dividends, interest, and client fees, and exclude institutional cash management related activity.11AUM is defined as assets under management or supervision.12Long-term net flows include the Equity, Fixed Income and Alternative and Solutions asset classes and excludes the Liquidity and OverlayServices asset class.13Transactional revenues include investment banking, trading, and commissions and fee revenues. Transactional revenues excluding theimpact of mark-to-market gains/losses on investments associated with certain employee deferred compensation plans is a non-GAAPfinancial measure that the Firm considers useful for analysts, investors and other stakeholders to allow better comparability of period-toperiod operating performance and capital adequacy.14Capital ratios are estimates as of the press release date, July 14, 2022.15CET1 capital is defined as Common Equity Tier 1 capital. The Firm’s risk-based capital ratios are computed under each of the (i)standardized approaches for calculating credit risk and market risk risk-weighted assets (RWAs) (the “Standardized Approach”) and (ii)applicable advanced approaches for calculating credit risk, market risk and operational risk RWAs (the “Advanced Approach”). Forinformation on the calculation of regulatory capital and ratios, and associated regulatory requirements, please refer to "Management’sDiscussion and Analysis of Financial Condition and Results of Operations – Liquidity and Capital Resources – Regulatory Requirements" inthe Firm’s Annual Report on Form 10-K for the year ended December 31, 2021 (2021 Form 10-K).16The Tier 1 leverage ratio is a leverage-based capital requirement that measures the Firm’s leverage. Tier 1 leverage ratio utilizes Tier 1capital as the numerator and average adjusted assets as the denominator.17The Firm’s supplementary leverage ratio (SLR) utilizes a Tier 1 capital numerator of approximately 77.8 billion and 84.6 billion, andsupplementary leverage exposure denominator of approximately 1.45 trillion and 1.44 trillion, for the second quarter of 2022 and 2021,respectively.7
Consolidated Income Statement Information(unaudited, dollars in millions)Jun 30, 2022Revenues:Investment bankingTradingInvestmentsCommissions and feesAsset managementOtherTotal non-interest revenues Interest incomeInterest expenseNet interestNet revenuesProvision for credit lossesNon-interest expenses:Compensation and benefitsNon-compensation expenses:Brokerage, clearing and exchange feesInformation processing and communicationsProfessional servicesOccupancy and equipmentMarketing and business developmentOtherTotal non-compensation expensesTotal non-interest expensesIncome before provision for income taxesProvision for income taxesNet incomeNet income applicable to nonredeemable noncontrolling interestsNet income applicable to Morgan StanleyPreferred stock dividendEarnings applicable to Morgan Stanley common shareholders 1,1503,597231,2204,912(52)10,850Quarter EndedMar 31, 2022 Jun 30, 2021 1,7583,983751,4165,11923412,585 Percentage Change From:Mar 31, 2022 Jun 30, 1%)63%*22%(11%)77%38%Six Months EndedJun 30, 2022 Jun 30, 2021 2,9087,580982,63610,03118223,435 4%(19%)(5%)(20%) 6,2621,7644,49827,933PercentageChange158 (25) The End Notes are an integral part of this presentation. Refer to the Financial Supplement on pages 12 - 17 for Definition of U.S. GAAP to Non-GAAP Measures, Definitions of Performance Metrics and Terms,Supplemental Quantitative Details and Calculations, and Legal Notice for additional information.8*
Consolidated Financial Metrics, Ratios and Statistical Data(unaudited)Jun 30, 2022Quarter EndedMar 31, 2022 Jun 30, 2021Percentage Change From:Mar 31, 2022 Jun 30, 2021Six Months EndedJun 30, 2022 Jun 30, 2021PercentageChangeFinancial Metrics:Earnings per basic shareEarnings per diluted share Return on average common equityReturn on average tangible common equityBook value per common shareTangible book value per common shareExcluding integration-related expensesAdjusted earnings per diluted shareAdjusted return on average common equityAdjusted return on average tangible common equity1.401.39 2.042.0210.1%13.8% 14.7%19.8%1.881.85(31%)(31%)(26%)(25%) 13.8%18.6% 54.4640.07 54.1839.91 54.0440.12 1.4410.5%14.3% 2.0615.0%20.3% 1.8914.1%19.0%3.453.41 12.4%16.8%(30%)(24%)4.104.04(16%)(16%)15.3%19.8% 54.4640.07 54.0440.12 3.5112.8%17.3% 4.1115.6%20.1%(15%)Financial Ratios:Pre-tax profit marginCompensation and benefits as a % of net revenuesNon-compensation expenses as a % of net revenuesFirm expense efficiency ratioFirm expense efficiency ratio excluding integration-related expensesEffective tax 1,7391,8041,829Statistical Data:Period end common shares outstanding (millions)Average common shares outstanding (millions)BasicDilutedWorldwide employeesNotes:- For the quarters ended June 30, 2022, March 31, 2022 and June 30, 2021, Firm results include pre-tax integration-related expenses of 120 million, 107 million and 90 million ( 92 million, 82 million and 69 millionafter-tax) respectively, reported in the Wealth Management and Investment Management business segments. The six months ended June 30, 2022 and 2021 results include pre-tax integration-related expenses of 227 millionand 165 million ( 174 million and 127 million after-tax), respectively.- The End Notes are an integral part of this presentation. Refer to the Financial Supplement on pages 12 - 17 for Definition of U.S. GAAP to Non-GAAP Measures, Definitions of Performance Metrics and Terms, SupplementalQuantitative Details and Calculations, and Legal Notice for additional information.9(5%)(5%)
NEW YORK, July 14, 2022 - Morgan Stanley (NYSE: MS) today reported net revenues of 13.1 billion for the second quarter ended June 30, 2022 compared with 14.8 billion a year ago. Net income applicable to Morgan Stanley was 2.5 billion, or 1.39 per diluted share,1 compared with net income of 3.5 billion, or 1.85 per diluted