Transcription
BALTIC REVIEW 2017Real Estate Markets of Estonia, Latvia and Lithuania
CONTENTSINTRODUCTION . 3ECONOMIC OVERVIEW . 4MARKET OF LAND WITHOUT BUILDING . 61.1.Residential land . 101.2.Commercial land . 171.3.Industrial and warehousing land . 201.4.Agricultural land . 231.5.Forest land . 27MARKET OF LAND WITH BUILDING . 301.6.Residential land with buildings . 331.7.Apartments . 411.8.Non-residential land with building . 54SUMMARY. 56
INTRODUCTIONBaltic Review is an overview of real estate markets in Estonia, Latvia and Lithuania. Thereport has been prepared in cooperation between three countries. Each Baltic country hasprepared its own data and comment on them. In the 2017 report, as in previous reports,each country's indicators are analysed and country-by-country comparison of the overallindicators, started in 2016, is continued.The Baltic States’ real estate market report has been prepared by the State Land Service ofthe Republic of Latvia, the Estonian Land Board, and the State Enterprise Centre of Registersin Lithuania. The 2017 annual report has been prepared by the State Land Service of theRepublic of Latvia.Since the data contained in each country are structured differently, the results cannot beinterpreted as an absolute truth. The analysis of the data included in the report was carriedout for the period 2013 - 2017.“Baltic Review” includes an overview of the main economic indicators and broaderinformation about transactions with vacant land and transactions with land with buildings.3
ECONOMIC OVERVIEWGeneral data (01.01.2017)Estonia2Area, kmCapitalPopulationNational currencySources: Eurostat, Statistics EstoniaLatvia45 339Tallinn1 315 635EURLithuania64 573Riga1 968 957EUR65 302Vilnius2 847 904EURGDP in current prices, million EUREstonia20132014201520162017Source: EurostatLatvia18 89019 75820 25220 91623 002Lithuania22 78723 63124 36825 01827 03335 00236 59037 33138 63147 168Average monthly gross wages, EUREstoniaLatviaLithuania201394971620141 00576520151 06581820161 14685920171 221926Sources: Statistics Estonia, Central Statistical Bureau of Latvia, Statistics Lithuania674698722774848GDP growth, %Estonia20132014201520162017Source: 4.63.53.52.02.44.1Inflation, %Estonia20132014201520162017Source: 2.91.20.2–0.70.73.74
Unemployment, %EstoniaLatvia20132014201520162017Source: 1.810.79.17.97.2Interest rates of long term commercial loans, 320172.3Sources: Bank of Estonia, Bank of Latvia, Bank of Lithuania2.82.63.22.72.74.84.87.32.82.8Tax rate (01.01.2017), %EstoniaLatviaLithuaniaIncome tax (for natural persons)202315Profit tax (for legal person)201515Value added tax202121Land taxation rate0,1 – 2,51,50,01 – 4Construction taxation–0,2 – 1,50,3 - 3Sources: Estonian Tax and Customs Board, Bank of Latvia, Lithuanian Tax and Customs Board5
MARKET OF LAND WITHOUT BUILDINGSources: Edijs Pālens/LETAFig.1.Purchased area (%) of the total area of the territory of Baltic StatesESTONIAIn 2013 - 2017, the total area of land purchased each year constituted 2% of the country’sterritory. This number increased over the years until it reached its highest value in 2014,when the transacted area made 2.7% of the total territory of Estonia. In 2015, thepercentage was 2.2 and in 2016 2.1. In 2017, the area of transacted land stayed on the samelevel, making 2.1% of Estonia’s territory.LATVIAStatistics on land sold in Latvia show that more than 2% of land is purchased annually fromthe total territory of Latvia, and in 2013 and 2014 it was even around 3%. This is due to thefact that in these years there were no restrictions on the purchase of agricultural and otherland in relation with the acquisition of residence permits for foreigners. The dominant area6
being sold still is agricultural land. Increase in total sales in 2017, compared to 2016 is due tothe fact that the total number of land transactions was increasing as the economic situationin the country improves. The real estate market is mostly dominated by local residents.LITHUANIAPercentage of purchased area in Lithuania significantly increased in 2013 – to 2.56%. Thissignificant increase was mostly influenced by higher number of agricultural landtransactions, related to the amended Law on the Acquisition of Agricultural Land, to beentered into force since 1 January 2014. Afterwards, situation returned to previous trends:in period 2014 – 2016 purchased area each year made approximately 1.5% of the totalterritory and in 2017 decreased to 1.4%. This could be explained by increasing popularity oflong-term lease1.BALTIC STATESDuring the period 2013 – 2017, the highest level of land sold was in Latvia (2.5 – 3.3%), butthe lowest in Lithuania (1.4 – 2.6%). If in Latvia the lowest level of land sold was only in 2015,then in Lithuania it has remained at the same level in Lithuania for the last four years. InLithuania and Estonia, the area purchased in 2017 was the lowest in the last five years.Fig.2.The number of land transactionsESTONIAThe number of land transactions rose by 17% in 2014 and decreased by 10% in 2015. In 2016the number of transactions remained the same as in 2015. By contrast, in 2017, thetransaction activity increased by 5%, reaching 13 062 transactions.1Note: land purchases made by state and municipalities excluded.7
LATVIAIn real estate market more transactions are carried out with vacant land. In 2017, theaverage transaction count of land without buildings was 14 thousand. In the same period theaverage transaction count of land with buildings was around 9.5 thousand.LITHUANIAIn 2013 total number of land transactions in Lithuania increased by 17% and in 2014 totalnumber of land transactions decreased by 17% (returned to previous trends). Afterwardsactivity in the land market in Lithuania, in general, remained almost at the same level, but in2016 total number of land transactions slightly increased by 5% comparing to 2015, in 2017increased by 6% comparing to 2016.BALTIC STATESThe number of land transactions in Lithuania ranged from 22 839 to 28 755, which wasalmost twice as high as in other Baltic States. In Estonia and Latvia, the number oftransactions was in the range from 11 852 to 14 136.In 2013, the number of transactions in Latvia was more than in Estonia, while in 2014 and2015 vice versa. In recent years, the number of transactions in Latvia has increased, reachingthe highest transaction count in Latvia in the last five years in 2017. Compared to 2016, thenumber of land transactions in all Baltic States increased in 2017.Fig.3.The proportions of transaction with different land types in Baltic StatesESTONIAIn the period 2013 - 2015, forest land transactions were most numerous, their share beingbetween 20 - 23%. After 2014, the share of forest land fell and the number of residentialland transactions increased. By 2017, the share of forest land transactions was 20%, theshare of residential land transactions 21% and that of agricultural land transactions 10%. Thetransactions with commercial and industrial land made a small percentage of all8
transactions. As can be seen in the table and in the figure, in a two year comparison, thehighest increase in 2017 was observed in the commercial land segment, which increased by30%. But as the number of commercial land transactions was relatively small, the increase intransaction activity in residential land segment (19%) could be considered more significant.Although the flat market is more active and occupies a more significant part of the realestate market, the increase in residential land transactions could indicate that the residentsintended to invest in private houses. The sector agricultural land suffered a 13.5% decline.LATVIAAs can be seen in the figure, according to the type of land use, most of the land transactionsoccur with agricultural land (20 - 25%) and just as much with residential land. The leasttransaction happened with commercial and industrial land. In 2017, 21-22% of transactionswere made with agricultural and residential land, 9% with forest land and only 5% withcommercial / industrial land.LITHUANIAIn 2013 total number of land transactions in Lithuania increased by 17%, highest increasewas observed in agricultural land segment – the number of these transactions increased by24% and made up 53% of all land transactions. The majority of agricultural transactions weremade in Vilnius district. This significant increase of agricultural land transactions was relatedto the amended Law on the Acquisition of Agricultural Land, to be entered into force since 1January 2014 that restricted purchases of agricultural land. During the period 2014 – 2017,most of the transactions in Lithuania were made with agricultural land (33 – 37%),residential land (37 – 40%) and forest land (16 – 19%). The transactions with commercial andindustrial land made up for only few percent of all transactions (2 – 3%).BALTIC STATESThe share of land transactions in all three Baltic States was different. In Estonia and Latvia,the proportion of transactions in comparison with Lithuania was much more similar. In theperiod from 2013 to 2017, most of the transactions in Estonia were carried out with forestland (21-23%), slightly less with residential areas (14-21%) and next with agricultural land(10-16%). In Latvia, most transactions were made with the same types of land, only withdifferent proportions: 22 – 25% with agricultural land, 17 – 24% with residential land and 8 –9% with forest land. At the same time, in Lithuania, the most popular were the transactionswith agricultural land (33-53%), residential land (26-40%) and forest land (15-19%).9
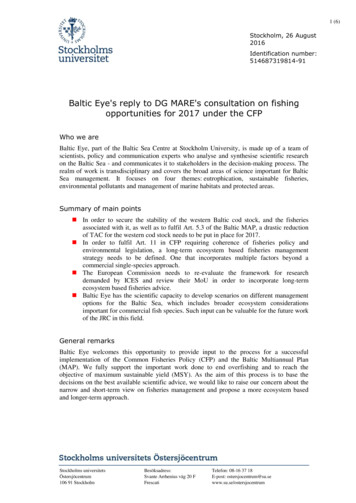
1.1. Residential landSources: Edijs Pālens/LETAFig.4.Residential land by acquired area (m2) in Baltic StatesESTONIADuring the period under review, the majority of transactions performed with residential landinvolved an area of 1 500 to 2 999 m2. The share of parcels of that size remained between 38- 41%. The share of 700 – 1 499 m2 parcels remained between 27 - 30% and that of 3 000 –9 999 m2 parcels between 25 - 29%. The demand for smaller parcels was the lowest, theshare varying between 4 to 8%. Similar to the year 2016, the demand for bigger, 3 000 –9 999 m2, residential land parcels increased.LATVIAThe transaction structure of residential land continues the trend of previous years. Most ofthe transactions performed involved residential parcels of 700 to 1 499 m2, representing35% of all residential land transactions, and land parcels of 1 500 to 2 999m2 - 31%. As a10
result of increasing economic activity and continuous development of new constructionprojects, in 2017 the demand for larger parcels of 1 500 – 2 999 m ² has increased by 35%compared to 2016. The number of transactions with small parcels (up to 700 m²) in cityhistorical centers and with Soviet time allotment gardens remains at the level of theprevious year.LITHUANIAThough number of transactions of parcels for residential housing construction was variableduring period of 2013 – 2017, trends on required area of land parcels remained similar. Themost demanded were residential land parcels of 700 – 1 499 m2 (43 – 53% of all residentialland transactions). The residential land transactions that involved smaller area of 300 to 699m2 in 2013 – 2017 made up 9 – 10%. The share of transactions involving an area of 1 500 to2 999 m2 in 2013 – 2016 was 29 – 32% and slightly decreased in 2017 to 27%. Transactionswith bigger 3 000 – 9 999 m2 parcels in 2017 comparing to 2013 decreased by 6%.BALTIC STATESIn Latvia and Lithuania, the most purchased units were residential land parcels of 700 – 1499m², ranging between 34 - 36% in Latvia and between 43 - 53% in Lithuania. While inEstonia most transactions were made with residential land with parcels of 1 500 – 2 999m²,representing 38 – 41% of the underlying transactions in the reporting period. The leastamount of transactions in Latvia was made with large parcels of 3 000 – 9 999 m ², rangingbetween 11 - 12%, while in Estonia small areas of 300 – 699 m² made up to just 4 - 8%. InLithuania the least of transactions were made with parcels of the smallest area (300 699m²), ranging between 9 - 10% and also large parcels (3 000 - 9 999 m ²), ranging between10 - 16% of all land transactions.Fig.5.The weighted average prices of residential land in Baltic States ( /m2)11
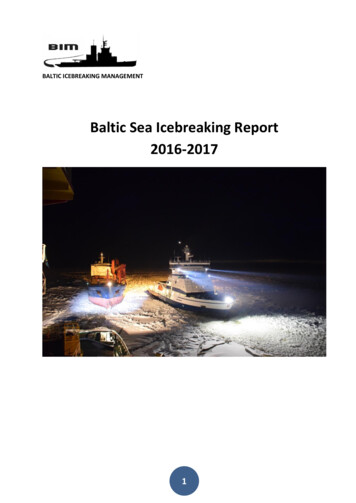
ESTONIAIn comparison to 2016, the average price of residential land stayed the same – 21 /m2.After a small 10% increase in 2015, the average price of residential land remained quitestable, varying between 20.3 - 21.4 /m2.LATVIAIn 2014 there was a drop in prices in the residential land market, but as of 2015, pricesstabilized. The decrease in prices in 2014 was affected by changes in the Immigration Lawand thus reduced the interest of non-residents in the Latvian real estate market. Instead,more transactions were focused on domestic demand. While the number of transactionswith residential land in 2016 and 2017 showed a growing trend, land prices generally did notshow rapid increase. In 2017, the average price of transactions was 1% higher than in 2016,while the total number of transactions increased by 16% within a year.LITHUANIAThe average prices of residential land were stable in 2013 and 2014 (14.54 /m2) and afterslightly decreased by 4.6% in 2015 and again remained stable in 2016. However, due to highreal estate market activity, in 2017 average prices increased by 14% and reached 15.87 /m2.BALTIC STATESIn 2017, the highest residential land prices of the Baltic States were in Estonia, where theyreached 21 /m2. During the period 2013 - 2016, in Estonia prices increased from 18 to 21 /m2 or by 16% and maintained at the same level in 2017. In Lithuania residential land pricesshowed a slight decrease from 14.50 /m2 to 13.60 /m2, but in 2017 increased by 16% andreached 15.80 /m2. Conversely in Latvia, prices decreased from 11.20 /m2 to 8.60 /m2between 2013 and 2016, but increased by 1% in 2017 and reached 8.70 /m2. Comparing theaverage residential land prices of the Baltic States in 2017 - Lithuania falls behind theEstonian average prices for residential land 1.3 times and Latvia 2.4 times.Sources: vestabalt.lv12
ESTONIAFig.6.The weighted average prices of residential land in major cities in Estonia ( /m2)During the period 2013 – 2017, the price level was highest in Estonia’s capital Tallinn. Incomparison with 2016, the average price fell by 3% and landed on 135 /m2, which was 1.4times higher than in 2013. Tallinn was followed by the city of Tartu, where the average priceincreased by 13% and reached the level of 64 /m2, which was 1.5 times higher than in 2013.Out of these three major cities, the city of Pärnu had the lowest average prices of residentialland. Since 2015, the average price in Pärnu grew steadily reaching in 2017 the level of39 /m2.Fig.7.The weighted average prices of residential land in regions in Estonia ( /m 2)During the period 2013 – 2017, Northern Estonia had the highest price level of residentialland. It should be mentioned that the higher price level in this region was strongly influenced13
by the city of Tallinn. In 2017, the average price of residential land in Northern Estonia was37 /m2 ( 4%). Southern Estonia includes the city Tartu, which also impacted the entireregion’s average prices. In Southern Estonia the average price in 2017 was 14 /m 2, inWestern Estonia 8 /m2, in North-Eastern Estonia 7 /m2 and in Middle Estonia 5 /m2. In2017, the average prices of all the above regions increased.LATVIAFig.8.The weighted average prices of residential land in major cities in Latvia ( /m2)The average residential land price in Rīga, in 2017 compared to 2016, increased by 30%, orfrom 32.70 /m2 to 42.60 /m2. In the capital the residential land prices, depending on thelocation and infrastructure, are on average between 20 /m2 and 95 /m2. In some casesthey can reach even 100 - 200 /m2, for example, in Mežaparks or Ķīpsala district. The city ofJūrmala from 2014 to 2016 had the steepest drop in residential land prices due toamendments to the Immigration Law, when the number of non-resident transactions fellsharply and the local buyers began to dominate the market. From 2016 prices are showingan upward trend, on average they have grown by 30%. The price increase was mainlybased on real estate transactions in the most attractive areas. Price fluctuations in 2016 and2017, in Liepāja were mainly determined by the location of transaction objects. In 2017, thenumber of residential land parcels sold in the outskirts of the city where prices range from 3to 10 /m2 was increasing. In contrast there were no registered transactions in the seasidearea where transaction prices recorded in previous years ranged between 35 and 50 /m2. InDaugavpils and Valmiera, the market for residential land remains stable. The average priceof transactions has increased slightly. In 2017 in Daugavpils, land prices range between 3 and10 /m2, an average price was 6.20 /m2. In Valmiera, the range for residential land pricesfalls between 3 and 17 /m2, with an average price of 7.80 /m2 in 2017. Residential landprices vary according to the location, placement and available communications of the parcel.14
Fig.9.The weighted average prices of residential land in regions in Latvia ( /m2)The Vidzeme region includes areas with the most active real estate market - Rīga, near-Rīgaterritories and the resort city of Jūrmala. In this region, by 2015, the market downturn wasrelated to amendments to the Immigration Law, resulting in fewer deals with expensiveobjects in the market. In turn, faster economic growth rates, particularly in the constructionsector, were seen in the period from 2015 until 2017. As a result, residential land prices in2017 show an increase of more than 18%. The tendency has showed growth of residentialland transaction prices in Zemgale and Latgale regions since 2015. Meanwhile, in Kurzeme,price fluctuations in 2016 and 2017 were related to the location and the provision ofcommunications of the sold land.LITHUANIAFig.10.The weighted average prices of residential land in major cities in Lithuania ( /m2)15
The highest average residential land prices were in capital Vilnius. Since 2013 average priceswere increasing and in 2015 reached 101 /m2, then decreased by 23% in 2016 and againincreased and surpassed previous level (reached 110 /m2) in 2017.This trend was related tovery high residential market activity in Vilnius. In Kaunas, contrary, average prices weredecreasing since 2013 till 2015, in 2016 increased to 54 /m 2, however, in 2017 starteddecreasing again. In Klaipėda average prices were increasing: in 2016 prices were 2 timeshigher than in 2013 and reached 68 /m2, however, in 2017 decreased by 17% to 56 /m2.Residential land prices in Panevėžys were not subjected to high fluctuations, (varied from 11to 15 /m2); in 2017 average price was 12 /m2. The lowest prices were in Šiauliai – variedfrom 7 to 12 /m2, substantial increase was observed in 2017 when prices surpassed level of2014 and reached 12 /m2. In bigger cities (Vilnius, Klaipėda and Kaunas) land parcelssuitable for the construction of individual houses are offered both by private persons anddevelopers which prepare entire packages of land parcels for sale (communications areinstalled, access roads are built and any other welfare is ensured). For this reason,purchasers have fairly good options both in terms of choice and negotiation.Fig.11.The weighted average prices of residential land in regions in Lithuania ( /m2)In Vilnius region highest average price was observed in 2014 (94 /m 2), afterwards pricessignificantly decreased by almost 3 times to 31 /m2 in 2016 and slightly increased in 2017 to39 /m2. In Kaunas region average residential land prices significantly varied: from 2013 till2015 decreased almost twice (from 22 /m2 to 12 /m2), in 2016 surpassed level of 2013 (25 /m2) and in 2017 decreased again to 21 /m2. Residential market in Klaipėda was variableduring the whole period. Prices significantly increased in 2014 (by 68% comparing to 2013),while in 2015 decreased by 24%, in 2016 decreased by another 47%, in 2017 increased againby 38% and reached 29 /m2. Prices in other regions remained almost stable due to lowactivity of residential real estate market.16
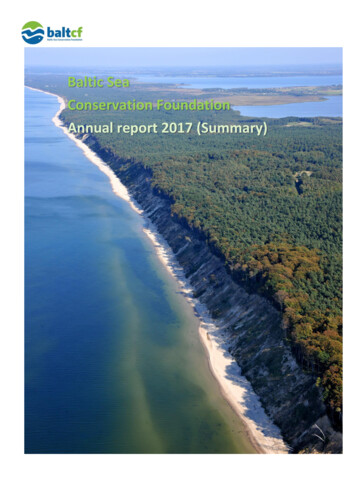
1.2. Commercial landSources: merks.lvFig.12.Commercial land by acquired area (m2) in Baltic StatesESTONIADuring the period 2013 – 2017, in contrast to residential land, the majority of transactionsperformed with commercial land involved an area of 3 000 – 9 000 m2. The share of theselargest parcels in commercial land market varied between 39 – 56%. The parcels with anarea of 300 – 699 m2 were least popular ones during that period constituting 8 – 14% oftransactions.LATVIAIn Latvia the activity of commercial land segment depends on the area of parcel. There ishigher number of transactions with bigger land parcels. About 45% of all transactions with17
commercial land happened with the biggest parcels of 3 000 – 9999m2, while only 13% oftransactions with small area parcels of 300-699 m2 were registered.LITHUANIADuring the period of 2013 – 2017, in contrast to residential land market, the bigger landplots 3 000 to 9 999 m2 were mostly demanded for commercial purposes. These transactionstook approximately 35% of all the transactions. Bigger land plots were usually acquired byreal estate developers for various mixed-use regeneration projects. Smaller land plots werealso demanded – transactions for 700 – 1 499 m2 plots took 20 – 27% of all the transactionsfollowed by transactions with 1 500 – 2 999 m2 plots (22 – 31%). Most of these transactionswere accomplished in Vilnius. The least of the transactions were made with parcels of thesmallest area (300 – 699m2), ranging between 14 – 18%.BALTIC STATESThe division of transactions by area is similar in all the Baltic States. Land parcels with largeareas are more requested. Transactions with large land parcels (3 000 – 9999 m2) inLithuania make up 35%, in Estonia nearly half - 48%, while parcels with small areas (1 500 –2 999 m2) in Lithuania make up 30%, in Estonia 27%.Fig.13.The weighted average prices of commercial land in Baltic States ( /m2)ESTONIABecause the number of commercial land transactions in Estonia is rather small, the averageprice tends to be volatile. The price of commercial land depends mostly on the location andtherefore the most expensive parcels are sold in or near Tallinn. During the period 2013 –2015, the average price remained between 34 and 55 /m2. The year 2016 witnessed an over50% rise in the average price of commercial land, which was caused by more expensivetransactions being made in the center of Tallinn. In 2017, the average price decreased by26% and landed on the level of 83 /m2, but still remaining higher than in 2015. Slight fall in18
2017 was caused because cheaper plots were sold which affected the average price. Anotherfactor that affects the value of commercial land is parcel’s size, which means that squaremeter of smaller parcel tend to be more expensive than bigger parcel’s. As in 2017, theshare of bigger commercial land plots increased, as these were sold more, then it might havehad an effect on the average price as well.LATVIAIn the reporting period the average price for commercial land fluctuated by years, reachingthe highest value in 2015 – 26 /m2 but falling to the lowest price in the period next year,19 /m2. The average price increased by 5% in 2017 reaching 25 /m2.Economic growth in Latvia, in recent year, has contributed to the entry of new entrants intothe market and to a slight increase in price level in the commercial land sector. IKEAshopping center is being built near Riga, in Stopiņu parish. Its construction was started in2017 and is planned to be completed already in 2018. The International Trade NetworkPEPCO plans to enter Latvia in 2018, opening 12 stores, the number of which is planned toincrease up to 30 in a few years.LITHUANIAFluctuations of the prices in commercial land market depended on year and the location.The most expensive were land plots in capital Vilnius. The average prices increased in 2013and remained almost stable till 2015. There was a significant decrease of average prices by26% in 2016; however, in 2017 average price increased again by 22% and reached 25 /m 2.BALTIC STATESIn 2017, German low-price network of stores “LIDL” strengthened its position in Lithuania,opening 9 new stores. In 2017, the “LIDL” chain store entered in Latvia, by purchasingindividual land parcels in Jelgava, Jūrmala, Liepāja, Rīga and Venstpils. In Estonia, thisnetwork of stores plans to enter in 2018/2019. However, there were participants who leftthe market because of the lack of market potential. For example, the Finnish retail networkPrisma has left the Latvian and Lithuanian markets, while the British network of storesMarks&Spencer has left the Estonian retail market. It left Latvian and Lithuanian marketalready in 2016.In 2017 the highest prices of commercial land remain in Estonia. In the period from 2013commercial land prices in Estonia have increased gradually from 34 /m2 to 82 /m2 in 2017.Compared with the previous year the price increase was 6%. Also in Lithuania, in comparisonwith the previous year, there was a rise in prices. In the period from 2013 to 2017, priceswith slight fluctuations have remained at the level of 25 /m2. In Latvia, during the last twoyears, prices in the commercial land segment have undergone a minimal change, decreasingby 1%. Compared to 2013, in Latvia price increase was around 20%. In addition, the priceincrease in the Baltic States was caused by the lack of A-class offices in the region. Accordingto demand, developers are interested in high-end offices. The lack of A-class offices isobserved in Tallinn, in Rīga and in Vilnius.19
1.3. Industrial and warehousing landFig.14.Industrial and warehousing land by acquired area (m2) in Baltic StatesESTONIAThe industrial and warehousing land segment included mostly large parcels with the size of3 000 – 9 999 m2. The share of these parcels in the industrial land market transactions wasbetween 48 – 61%. The parcels with an area 300 – 699 m2 were the least popular onesduring that period and the share of these parcels varied between 6 – 15%.LATVIAIn 2017, as it was in previous years, demand for large industrial and warehousing landparcels remained. 40 % of all registered properties lay within the group of parcel areabetween 3 000 and 9 999 m2. In 2017, the number of transactions with industrial landincreased by 17% and 24% compared to 2015 and 2016, almost returning to 2013 - 2014price levels. As a result of the impact of European Union Structural Funds and improvement20
of economic factors, demand for free areas increases for the development of industrialparks.LITHUANIAImproving financial performance of companies and increasing demand for modernwarehousing premises in recent years have encouraged faster development of this realestate segment. Financially stronger companies continued to implement projectsthemselves. During the period 2013 – 2017 industrial and warehouse land segment wasdominated by bigger transactions, 3 000 – 9 999 m2 parcels were mostly demanded. Theshare of these parcels in industrial land market transactions was between 34 – 42%.However, smaller land plots were also demanded. Transactions with the smallest areas (300– 699 m2) ranged between 21 – 38%, areas of 700 – 14 999 m2 ranged between 15 – 24%and areas of 1 500 – 2 999 m2 – between 13 – 22%.BALTIC STATESIn all three Baltic States in general there is a tendency of demand for large industrial landparcels with an area of 3 000 to 9 999 m2. In 2017 the share of these parcels in industrialland market transactions in Lithuania was 36%, in Latvia 40% while in Estonia even more –54%. The total number of industrial and warehousing land transactions in Latvia and Estoniais increasing but in Lithuania it is decreasing.Fig.15.The weighted average prices of industrial and warehousing land in Baltic States ( /m 2)ESTONIACompared to commercial land, industrial and warehousing land had a lower average price.The industrial land segment had also a higher transaction activity and more transactionswere made outside of Tallinn and Harju county. From 2013 to 2016, the average price ofindustrial land remained between 9 and 17 /m2. In 2017, the average
the highest transaction count in Latvia in the last five years in 2017. Compared to 2016, the number of land transactions in all Baltic States increased in 2017. Fig.3.The proportions of transaction with different land types in Baltic States ESTONIA In the period 2013 - 2015, forest land transactions were most numerous, their share being